

Summary
- After Bitcoin broke through $105,000 for the second time at the end of January, the market entered a contraction phase, with the monthly price momentum of major assets declining sharply.
- Bitcoin remained relatively stable, while Ethereum, Solana and Memecoins faced deeper adjustments, reflecting a change in risk appetite.
- Solana has become a market leader in capital inflows over the past two years, while Ethereum has been relatively difficult to attract sustained demand.
- However, this week, the capital flows of all digital assets except Bitcoin have declined sharply, with Solana and its related meme coin ecosystem being hit relatively hard.
- The open interest (OI) of perpetual futures for Bitcoin (-11.1%), Ethereum (-23.8%), Solana (-6.2%) and the Memecoins Index (-52.1%) have all declined, reflecting a weakening of leveraged speculation.
Market Momentum Takes a Breather
In late January 2025, the Bitcoin market attempted to break through its all-time high and re-enter the price discovery phase. However, this rebound failed to gain the necessary momentum, and the market subsequently entered a contraction and consolidation phase, with the price momentum of major assets declining sharply.
Bitcoin: +48.4% (November 2024) → -5.9% (February 2025)
Ethereum: +60.3% (December 2024) → -16.9% (February 2025)
Solana: +53.2% (November 2024) → -33.1% (February 2025)
Meme Coins Index: +90.2% (December 2024) → -37.4% (February 2025)
It is worth noting that Memecoins and Solana have thrived under strong market conditions, but they also tend to experience significant corrections during periods of weakness. Ethereum has been one of the weakest performing currencies throughout the cycle, and although its performance this week was better than Solana, a strong outperformance trend has not yet formed.
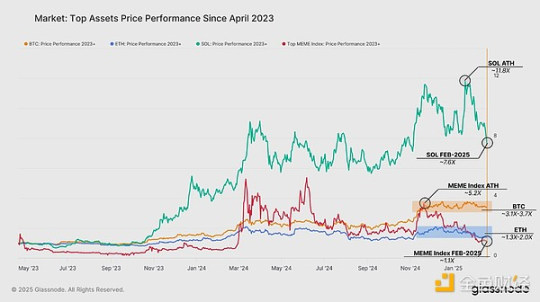
Evaluating Performance So Far
The recent slowdown has occurred after a prolonged period of strong growth in major digital assets. Looking at the performance since the beginning of 2023, we can see clear differences in the performance of each asset within the cycle:
- Bitcoin's trading range is about 3.4 times higher than April 2023, providing a benchmark return profile.
- Ethereum has struggled compared to its peers, with returns ranging from 1.3 to 2.0 times that of April 2023.
- Solana's returns since 2023 reached a peak of 11.8 times in early January 2025, but have since declined sharply to around 7.6 times as the current correction is implemented.
- Memecoins Index: Prices experienced an explosive mid-2024 rally, largely in line with Solana's stellar performance, reaching a peak of 5.2 times since 2023. However, the industry has been hit quite severely in recent weeks, and its overall performance is now the worst of the four assets.
This reflects Solana's high beta characteristics, experiencing both the strongest upside and the most severe downside. Bitcoin's more stable trajectory highlights the resilience of its benchmark return characteristics in the digital asset space. Particularly for Memecoins, the recent decline in investor demand clearly indicates a shift in risk appetite.

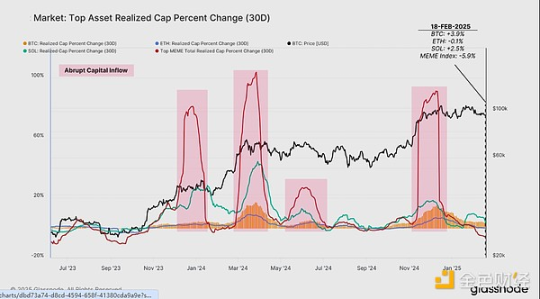
Capital Flows Driving the Market
Solana's strong performance over the past two years has been consistent with sustained capital inflows driven by investor demand. Looking at the monthly changes in realized market capitalization, we can see clear patterns in the capital flow dynamics of various digital assets:
- Solana: It has consistently attracted relatively high capital inflows, supporting its strong price appreciation.
- Ethereum: Among the major currencies, it has the weakest net capital inflows, explaining its relatively poor performance.
- Memecoins: They have experienced several sudden but unsustainable surges in capital inflows, reflecting speculative outbursts, but without sustained momentum.
However, in recent weeks, the momentum of capital inflows into all digital assets has declined. Notably, Ethereum and top Memecoins have now turned negative (capital outflows), with Ethereum's realized market cap net outflow at -0.1% and the Memecoins Index net outflow more severe at -5.9%.
This indicates a clear cooling of speculative appetite and suggests that capital may start to flow out of higher-risk assets in the future.
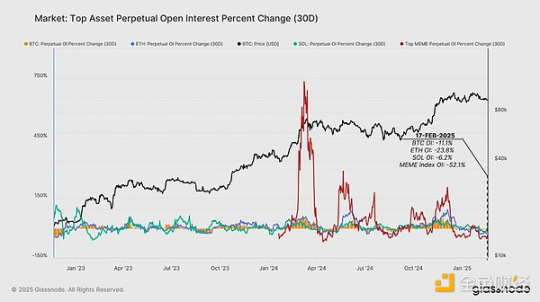
Futures Market Weakness
As the spot market momentum begins to weaken, we can also see a decline in capital inflows into the perpetual futures market. The cooling of spot demand has led to a sharp decline in the open interest (OI) of perpetual contracts for all major assets, indicating a reduction in speculative activity and a decline in spot and arbitrage yields.
Over the past 30 days, the changes in open interest highlight the widespread retreat of capital:
- Bitcoin OI: -11.1%
- Ethereum OI: -23.8%
- Solana OI: -6.2%
- Memecoins OI: -52.1%
The across-the-board decline in open interest suggests that speculators are reducing their leveraged exposures, likely due to weakening market momentum and increased market uncertainty. The largest decline is in Memecoins, which tend to attract more short-term leveraged bets, but quickly lose appeal as market sentiment weakens.
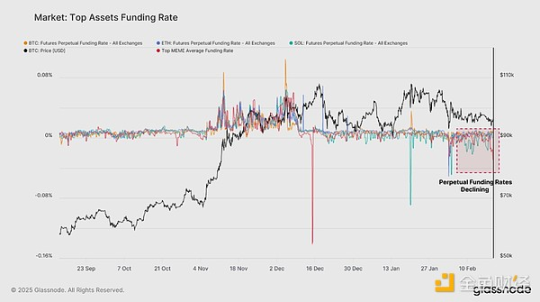
Funding Rates Indicate Bearish Sentiment
The decline in perpetual futures funding rates has further exacerbated the weakness in open interest. This reflects a shift in bearish sentiment and the unwinding of leveraged positions, particularly in higher-risk assets.
The funding rates for Bitcoin and Ethereum remain slightly positive, and their deeper liquidity conditions often result in positive funding rates, unless during events of significant deleveraging.
Solana's funding rate has declined slightly and turned negative in recent weeks, indicating a cooling of demand for long speculative positions.
Memecoins' funding rates have turned deeply negative, suggesting that shorts now dominate in these highly speculative assets, with many traders unwinding (or being liquidated) their positions.
The negative funding rates for Solana and Memecoins indicate a net shift in sentiment towards bearishness in high-risk assets, and the unwinding of over-leveraged long positions.
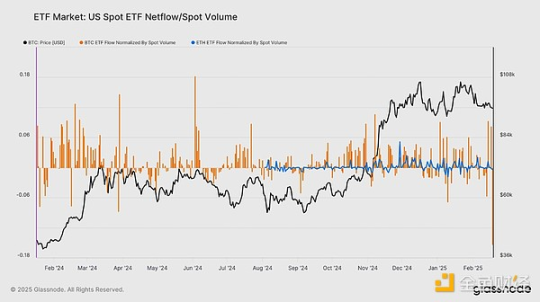
ETF Flows and Market Impact
As the market enters a contraction phase, institutional interest in Bitcoin and Ethereum has shown signs of cooling, based on spot ETF flows. By standardizing the net inflow volume against the native spot volume of each asset, we can gauge the weight and impact of ETFs on market dynamics.
- Last week, Bitcoin ETF outflows exceeded $200 million per day, but were subsequently met with a strong rebound in buyer activity, exceeding 8% of global spot trading volume, highlighting institutional demand (akin to "buy-the-dip" behavior).
- Ethereum ETF demand has cooled significantly, remaining much smaller in scale compared to Bitcoin. ETH's ETF activity has hovered near zero in both net inflows and outflows, indicating a lack of strong traditional investor demand and participation.
This divergence has been a theme of the current market cycle so far, and has further cemented Bitcoin's dominant position in institutional asset allocations. Ethereum has continued to struggle in attracting sustained capital inflows, further explaining its relatively poor performance in recent years.
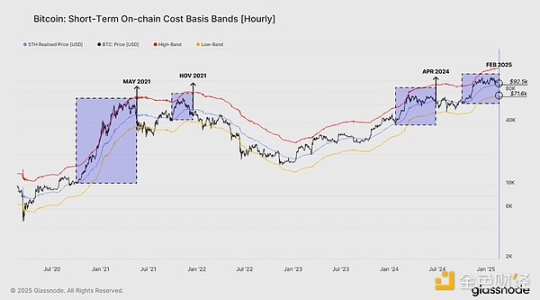
Key Bull-Bear Thresholds
The current trading price of Bitcoin is 1,000-5,000 USD above the cost basis of short-term holders (STH), positioned at $92,500. Historically, this level has been a critical pivot point between local bull and bear market phases, serving as the pivot point for the average buyer to move between unrealized profits and losses in the near term.
Reviewing previous instances of Bitcoin reaching new highs and then correcting downwards, we can observe similar patterns in May 2021, November 2021, April 2024, and February 2024.
In each case, the downtrend has extended to the lower bound of the STH cost basis model, specifically below the cost basis by -1 standard deviation (σ). Currently, this lower bound is at $71,600, helping to forecast the potential downside risk if these historical patterns were to repeat.
Consolidation After Reaching New Highs
In previous instances of Bitcoin reaching new highs, we have observed a consistent post-rally pattern, where a surge in realized supply density occurs within a ±15% range of the spot price. This is due to the market transitioning from an aggressive uptrend to a price consolidation, as the market trades within a relatively narrow range.
This behavior is evident at previous cycle tops, where:
- As the market rebounds within the price discovery range, the realized supply density declines all the way to the price peak.
- Then, as the market enters an adjustment or consolidation phase, market participants begin to redistribute their tokens.
- This typically occurs near the STH cost basis, as the conviction and demand state of new investors is tested.
- The current realized supply density is consistent with a typical post-ATH consolidation phase, as buyers and sellers attempt to establish a new equilibrium before the next major trend unfolds.
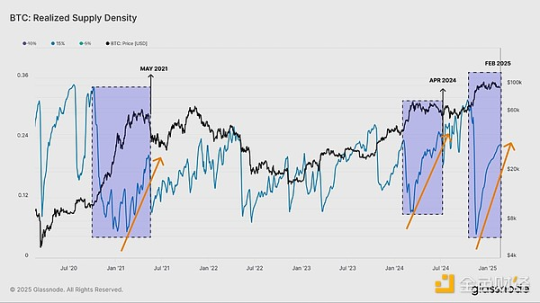
Approaching a Decisive Market Moment
To better understand the market's sensitivity to this supply density, we can analyze the recent post-ATH distribution phase of the short-term holder (STH) supply. This helps to measure the pattern of new investor accumulation and whether the current situation is similar to past cycle peaks.
When comparing the STH supply changes, we observe that:
- The recent accumulation phase is very similar to May 2021, suggesting a similarly large supply overhang, with investors sensitive to prices breaking below $925,000.
- In April 2024, new investors also aggressively accumulated, but the magnitude of the STH supply uptrend in the current cycle is structurally more consistent with May 2021 than April 2024.
Given these similarities, we are now very close to a decisive moment in the market - the stage where price action is poised to unfold. If demand remains strong, Bitcoin may establish a new range above the ATH. However, a lack of sustained buying pressure could lead to a deeper distribution-driven adjustment, similar to previous post-ATH phases. This may be driven by recent buyers' panic, as they see their recently purchased tokens move from profitable to unrealized losses.
Conclusion
Bitcoin has been consolidating around $95,000 for the past few weeks, with a relatively stable trading range. However, the broader digital asset space is not as such, with Ethereum, Solana, and Memecoins all experiencing significant pullbacks from their cyclical highs. Particularly, the demand for Memecoins has clearly cooled, with capital outflows, sharp price declines, and a bearish sentiment in the futures market as evidence.
For Bitcoin, the key level to watch is the short-term holder cost basis around $925,000. This is a critical point where the majority of recent buyers' holdings will turn to unrealized losses. With the emergence of panic sentiment, this could lead to further downside. Regardless, the current consolidation phase appears to be nearing its late stages, and the market seems poised to move in a direction once again.


