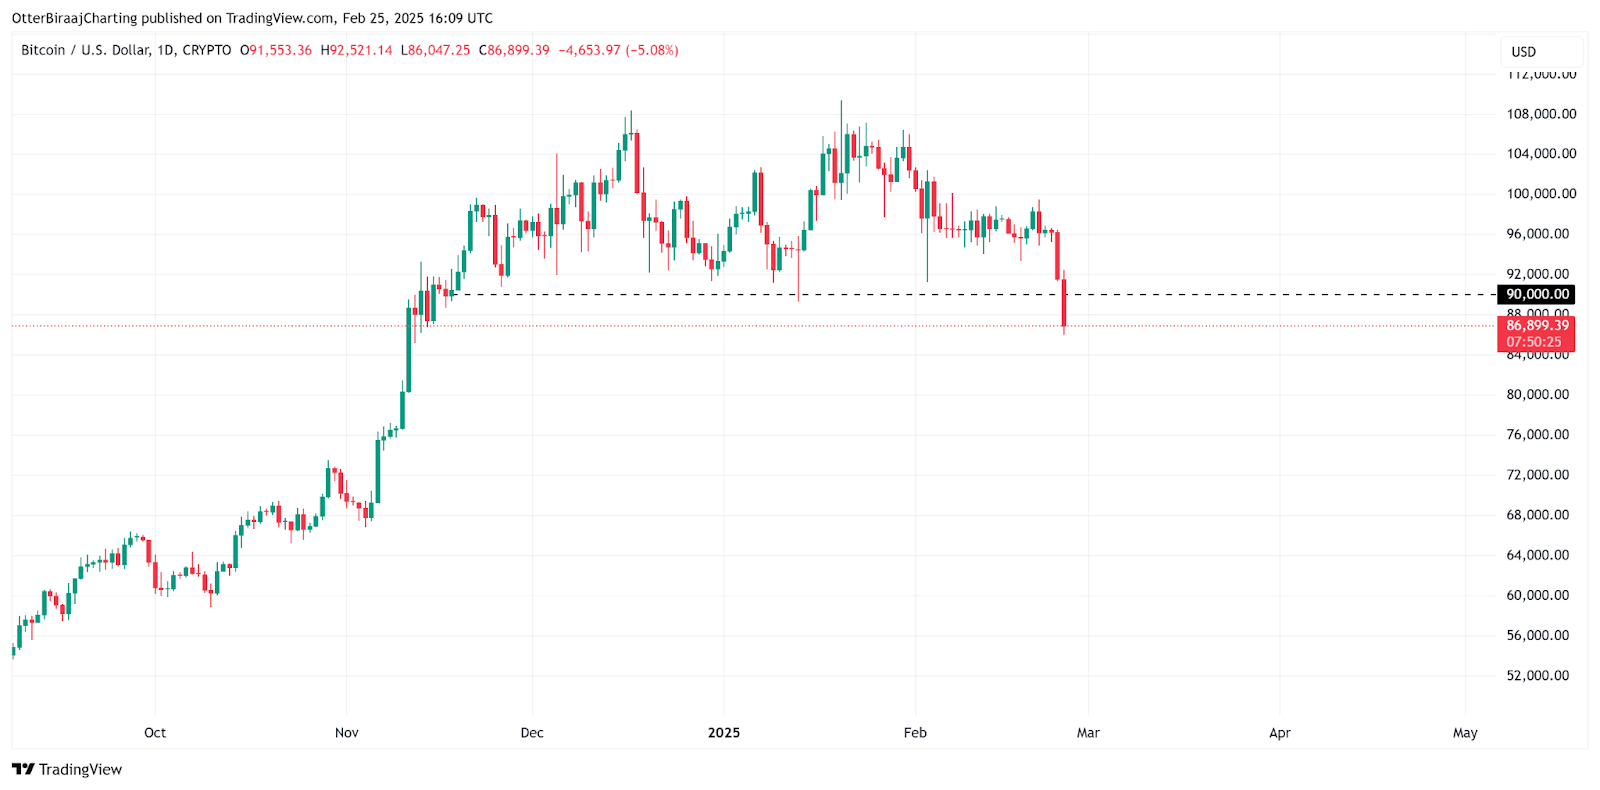
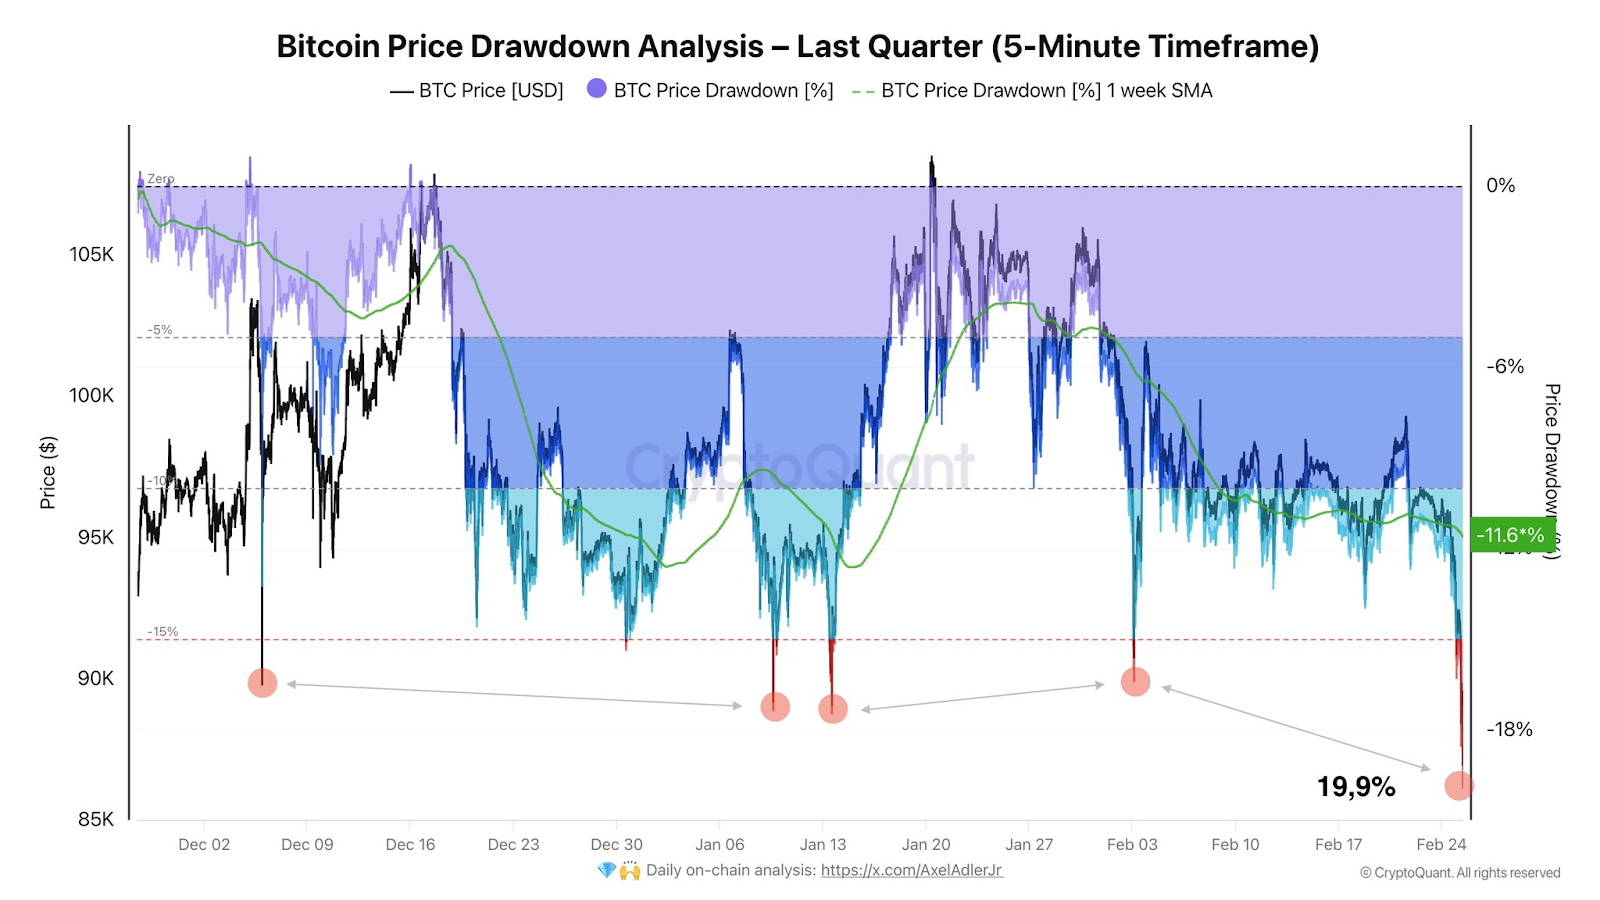
On February 25, 2025 at 11 PM, the price of Bitcoin briefly fell to $86,000, a new low since November 13, 2024.
This plunge not only led to the liquidation of nearly $2 billion in long and short positions across the network, but also marked a key market signal: the "double top" pattern that had been forming for more than three months was officially confirmed. Since November 2024, Bitcoin has oscillated between $91,000 and $105,000, forming two significant peaks, and the February 24 daily close below the $92,000 neckline position has completely triggered the technical selling frenzy.
At the same time, a secret capital game is unfolding, and although market panic is spreading, the "smart money" seems to have sniffed out the opportunity to 'buy the dips'.
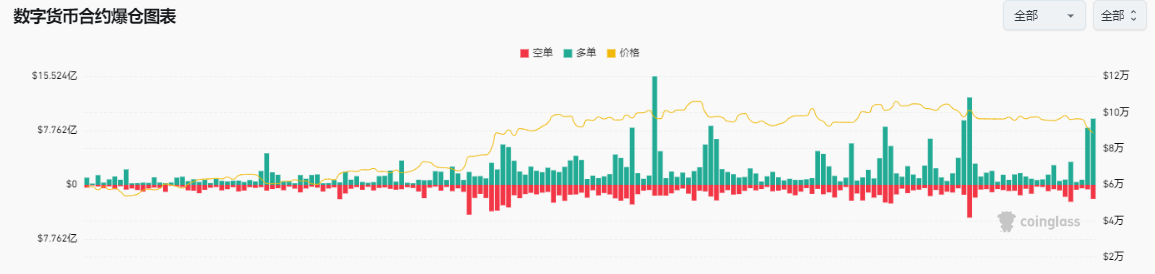
Coinglass data shows that the liquidation amount exceeded $2 billion in the past 48 hours, with long positions accounting for nearly 90%. The cryptocurrency market sentiment has quickly collapsed from neutral to "extreme fear" (25). It is worth noting that the current market leverage is still at a high level, with the total Bitcoin contract open interest reaching $56 billion, down less than 10% from the peak three days ago. This means that there are still a large number of contract positions in the market.
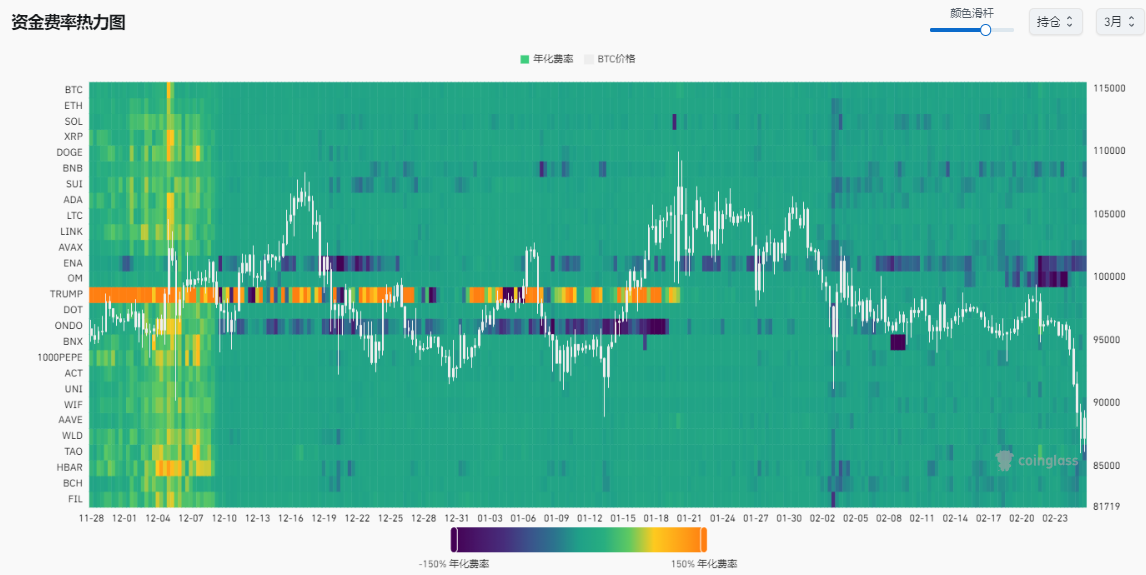
The funding rate heat map shows that the funding rates of mainstream cryptocurrencies have turned from positive to negative, and the spot-contract rate premium of some cryptocurrencies is significant, indicating that the market has generally become bearish.
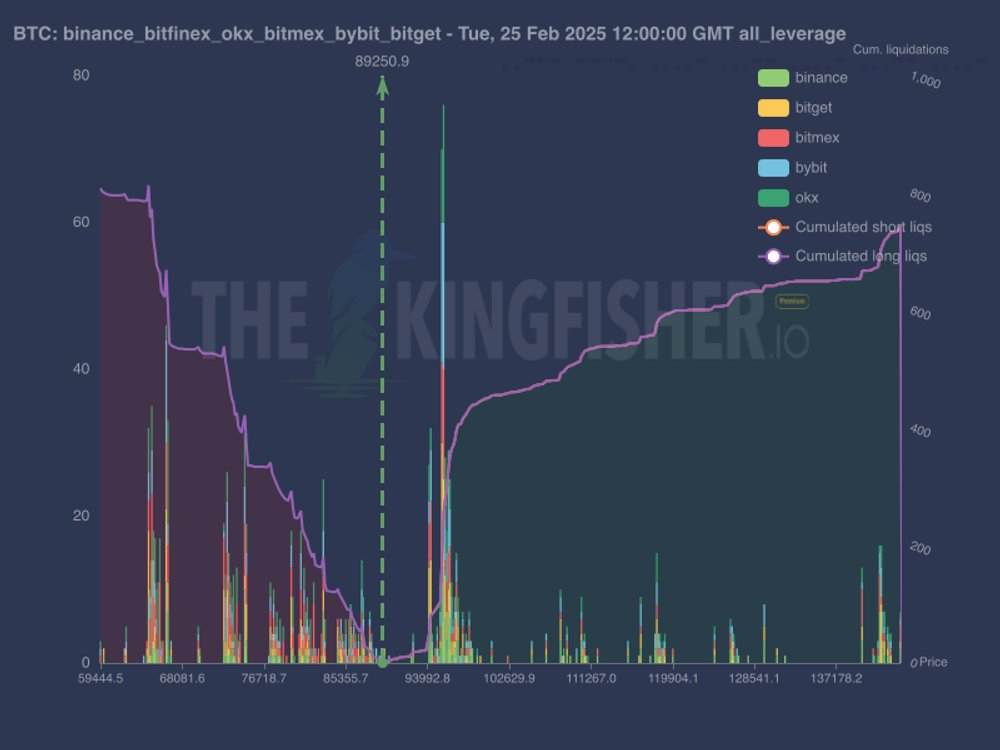
Furthermore, according to analyst The kingfisher, based on Bitcoin liquidation data, the current Bitcoin long liquidation (the bar graph on the left side of the green line) is heavily concentrated in the $68k-$77k range.
Short liquidation (the bar graph on the right side of the green line) has increased significantly, reaching $103k-$138k. The imbalance is favorable for more liquidation above the price.
Risk: The large long liquidation cluster below may provide support, but losing it could trigger a chain reaction.
This means that the critical price support for Bitcoin contracts is above $68,000.
According to CryptoQuant data, short-term holders (holding for less than 155 days) lost 27,500 BTC in the past 24 hours, and this part of the sell-off may exacerbate the downward pressure on the market.
However, Bitcoin whale addresses show different trends. On February 24, about 26,430 BTC were deposited into whale accumulation addresses, which are usually associated with over-the-counter trading and long-term storage.
It is worth noting that Strategy recently announced the purchase of 20,356 BTC for $1.99 billion, indicating that institutional capital has begun to enter the market, providing support for Bitcoin.
Overall, with the intervention of whale institutions, the risk of a massive Bitcoin crash - a drop of more than 30% - has been significantly reduced.
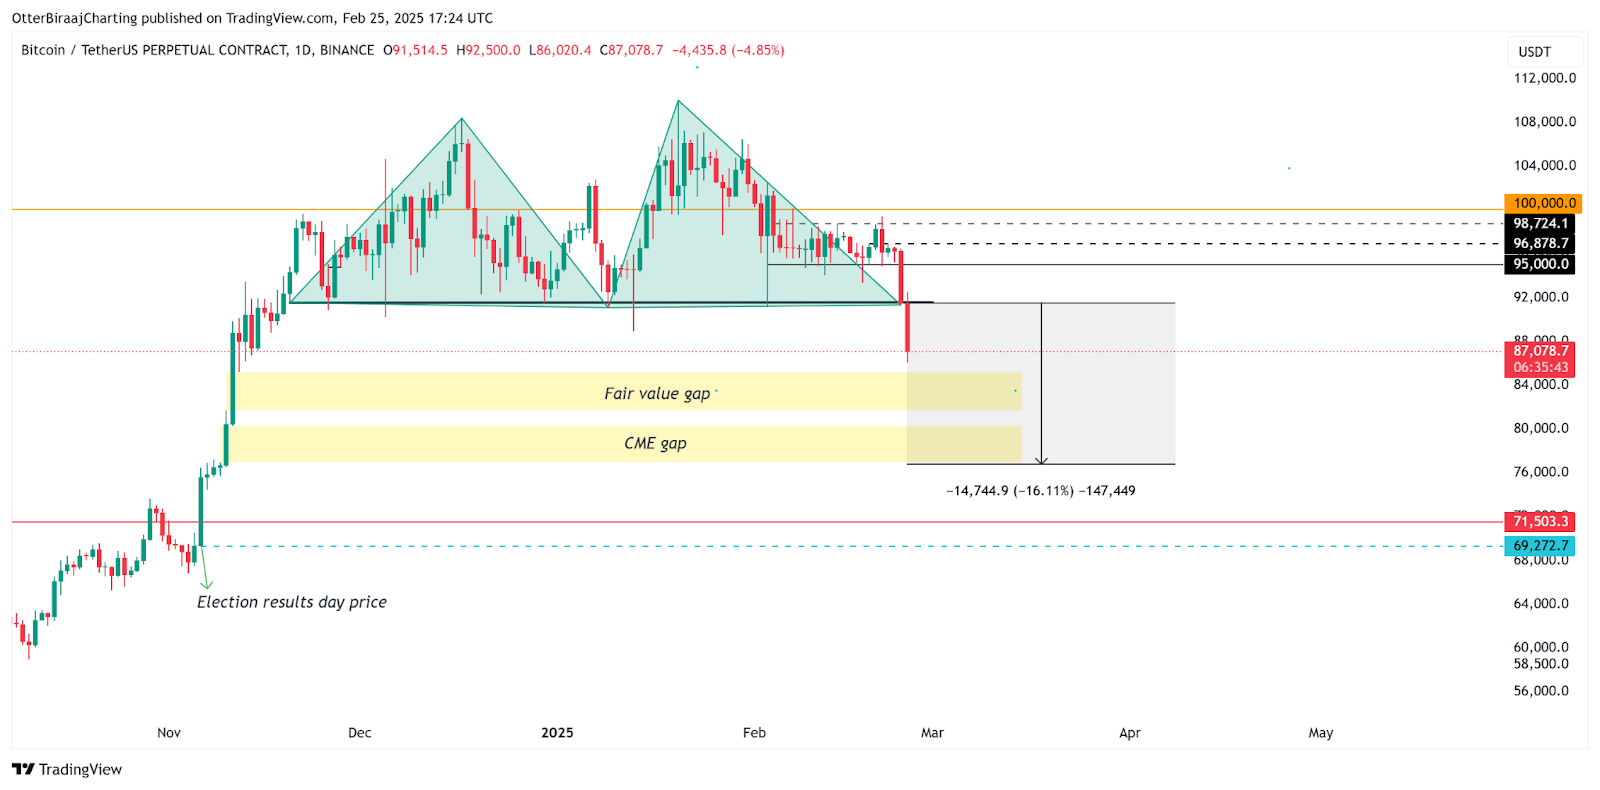
On February 24, the Bitcoin daily chart closed below $92,000, confirming the double top pattern that has existed for several months.
The completion of the double top pattern implies a theoretical downside target of 1 times the neckline height. Calculated at the $92,000 neckline position, the target range points to $78,000-$76,000.
In addition, the "fair value gap" of $81,700-$85,100 formed in November 2024 has not been filled, and this area may become the focus of short-term bull-bear tug-of-war.
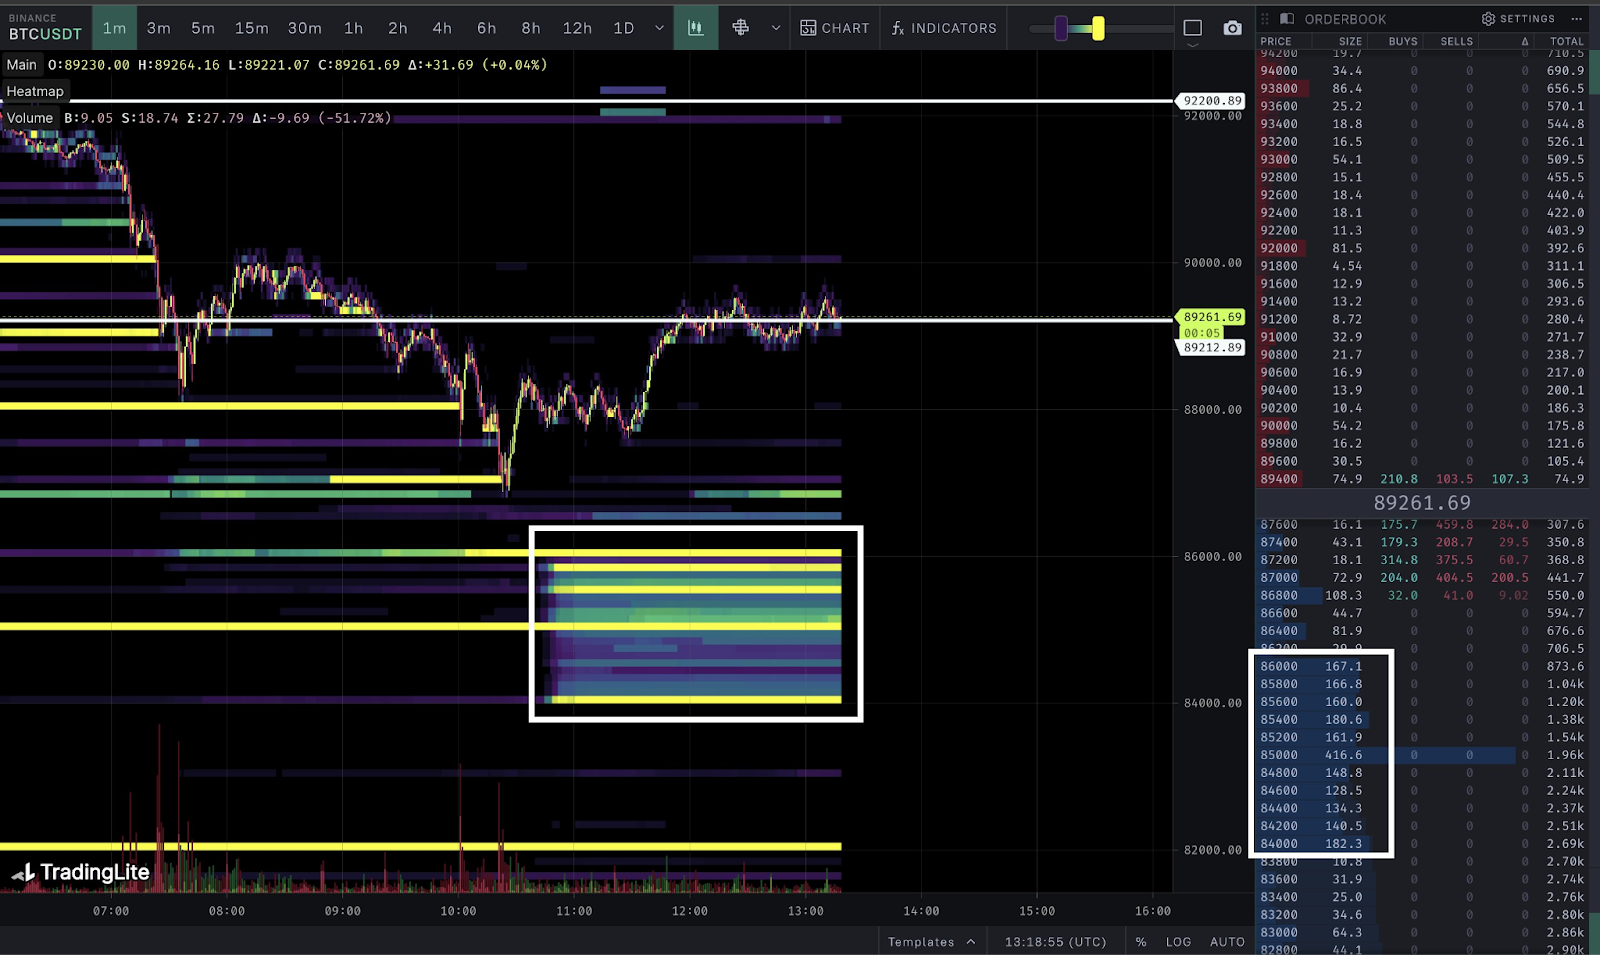
Crypto trader CRG emphasized that the spot offer on Binance is around $84,000 to $86,000, which increases the fair value gap.
If the price stabilizes here, it may trigger a "Dead Cat Bounce"; but if it breaks below, it may further test the $77,000 level where the CME futures gap is located.
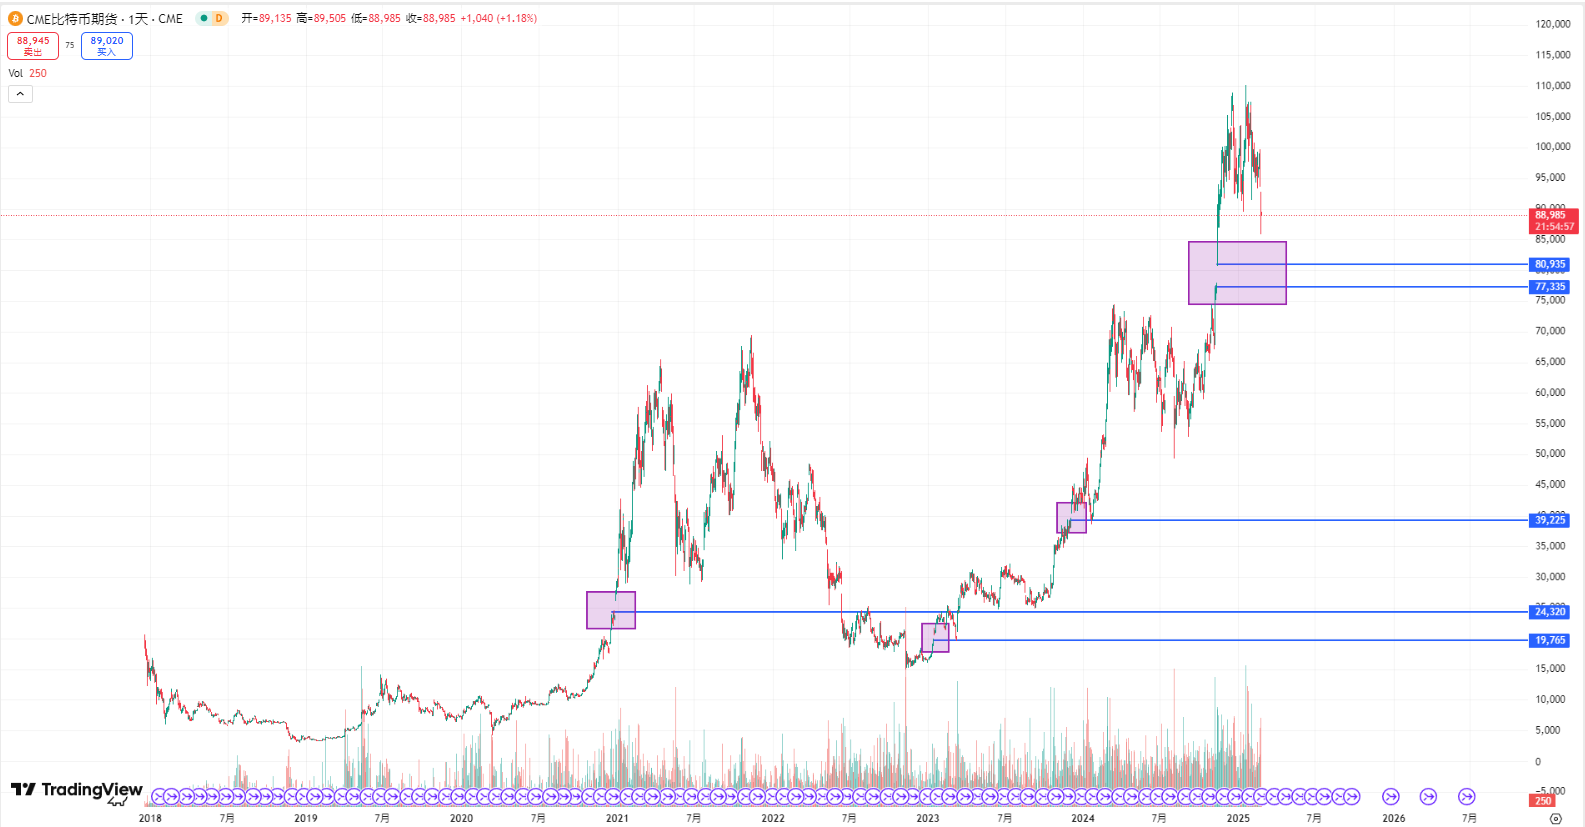
According to Tradeview data, over the past 7 days, every CME Bitcoin futures gap formed during the bull market rally has been filled, without exception.
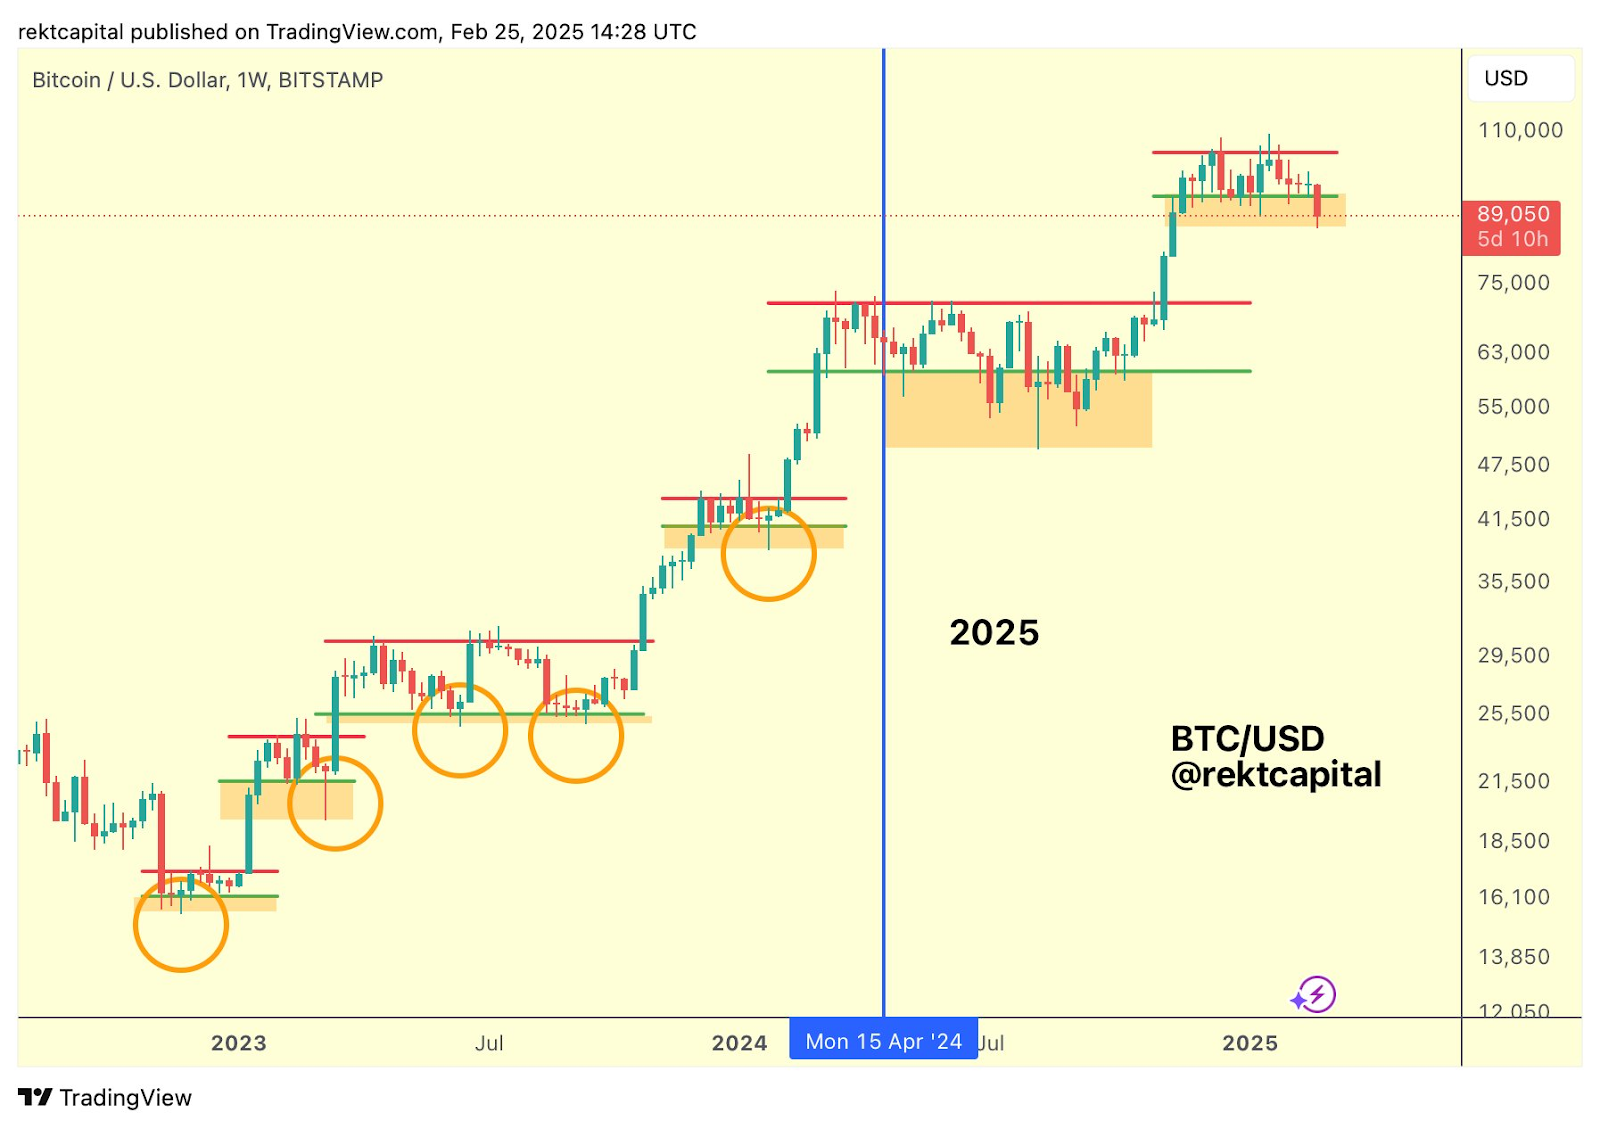
Rekt Capital has created a Bitcoin weekly chart, highlighting the key structures in BTC's price action since the end of the last macro bear market at the end of 2022. Currently, the downward deviation below the re-accumulation range low is underway.
This means that the price will fall to a lower level closer to the historical high of $73,800 in March 2024.
Reviewing Bitcoin's previous bull markets, quarterly declines of more than 30% are not uncommon. For example, in August 2024, Bitcoin's quarterly decline reached 30%, but then launched a new bull market under the Trump rally.
The current pullback (down about 20% from the high) has not yet reached the historical average adjustment depth, but if it falls to $77,000, the decline will expand to 30%, which is still moderate compared to the 2021 bull market correction.
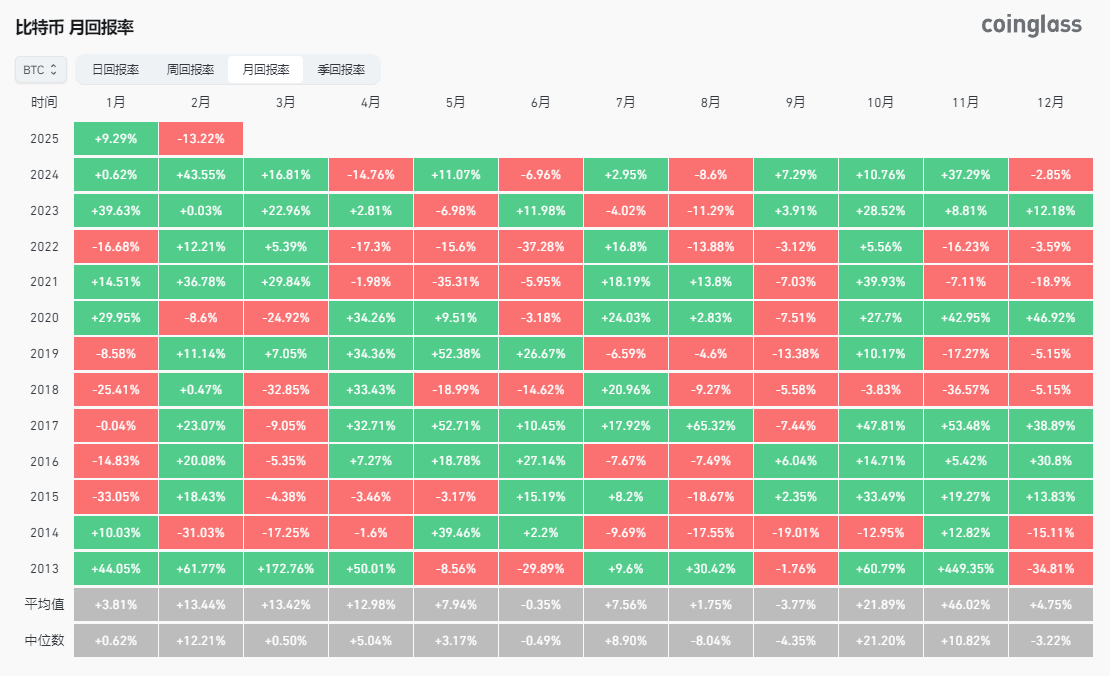
Looking at Bitcoin's monthly and quarterly returns, Bitcoin may have recorded its worst February performance on record.
But looking back at the performance in March, April, and May, Bitcoin has been outstanding, and combined with the potential macro turning points ahead, the Bitcoin bull market turning point may be among them.
Macro Variables: The Triple Whammy of Policy, Elections, and Liquidity
Beyond the technical aspects, the macro environment is the key variable in determining whether Bitcoin can bottom out:
1. Federal Reserve policy shift: The Fed has recently released hawkish signals, with the strong US dollar suppressing the performance of risk assets. BitMEX co-founder Arthur Hayes predicts that if global central banks delay quantitative easing, Bitcoin could fall to $70,000-$75,000, accompanied by a "mini financial crisis".
2. US political game: The fiscal policy of the Trump administration has become an uncertain factor. If the spending expansion bills he pushed for are blocked, Bitcoin may give back the "Trump rally" gains, falling to $75,000-$70,000. The failure of the Bitcoin investment bill in South Dakota also exposes the immediate impact of regulatory attitude differences on the market.
3. Liquidity contraction: Matrixport data shows that the weekly inflow of stablecoins has dropped from a peak of $8 billion to $4 billion, and the tightening of market liquidity may prolong the adjustment cycle.
Ultimate Simulation: $75,000 - Rebound Starting Point or Continuation of Decline?
Combining the technical aspects, on-chain data, and macro variables, Bitcoin's short-term trend has two possible paths:
Path One: Bottom and Rebound
- Support logic: The $81,000-$85,000 range has accumulated a large number of spot buy orders, and the power of whale and institutional 'buy the dips' capital forms a joint force.
- Catalysts: Implementation of Trump policies, dovish signals from the Fed, or news of institutional accumulation.
- Rebound target: If it stabilizes above $85,000, it may rebound to the $92,000 neckline position and start a new round of volatility.
Path Two: Continued Collapse
- Breakdown logic: A break below $81,000 will trigger stop-loss orders, with the CME gap ($77,000-$80,000) as the last line of defense.
- Risk amplifiers: Deterioration of the macroeconomic environment, tightening of regulatory policies, or black swan events (such as exchange hacking).
- Ultimate bottom: Double top target at $78,000-$76,000, or even a dip to $70,000-$75,000 as predicted by Hayes.
Conclusion: $75,000 may be the bulls and bears' watershed
Based on the above analysis, the possibility of BTC falling to around $75,000 is significant, but this position is more likely to be the starting point of a rebound rather than the starting point of a long-term decline. The battle for key support levels will determine the direction of the market:
If there are signs of increased trading volume and on-chain accumulation around $75,000, the bottom will be confirmed, and a rebound is expected;
If macroeconomic headwinds combined with technical breakthroughs, deeper liquidity crises need to be vigilant.
For investors, the current strategy should focus on risk control: reduce leverage, build positions in batches, and closely monitor the movements of whale addresses and policy trends. After all, in the huge waves of the crypto market, survival takes priority over profitability.