

The crypto market experienced a dramatic V-shaped reversal on March 11. Bitcoin violently rebounded 4% from a four-month low of $76,600, while Ethereum completed a heroic counterattack at the $1,754 level.The core controversy in the current market is: is this rebound a temporary respite in the bear market, or a true confirmation of the cycle bottom? Based on on-chain data, technical indicators, and the macroeconomic environment, we have reason to believe that the probability of Bitcoin $76,600 and Ethereum $1,754 forming a stage bottom exceeds 80%.
I. Bitcoin's Bottom Logic: VIX Fear Index and Short Squeeze Resonance
1. VIX Index Reveals 89% Probability of Bottoming
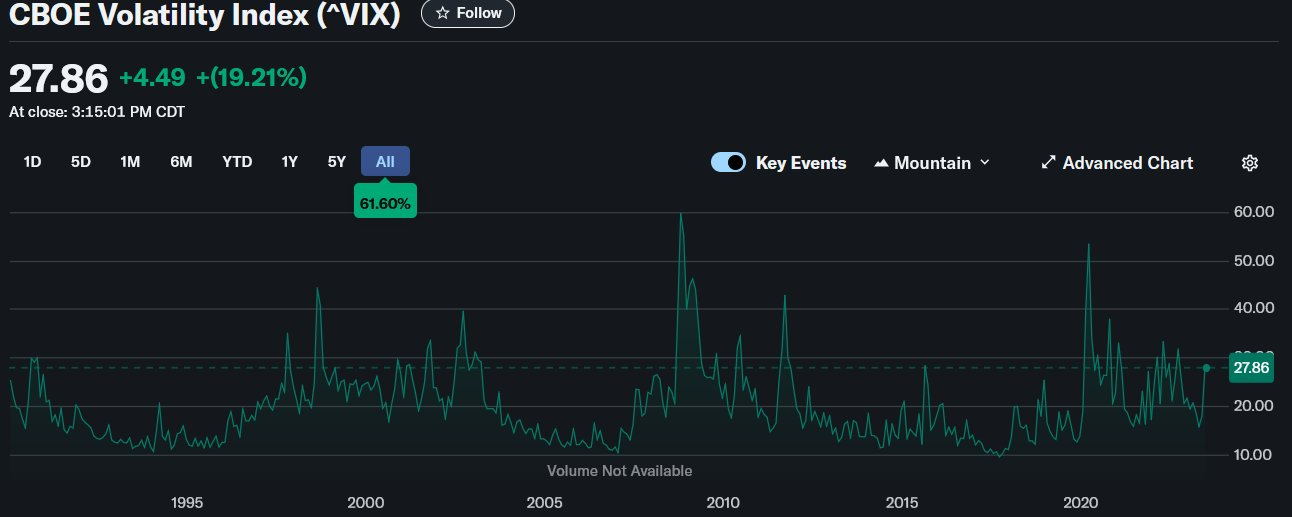
Economist Timothy Peterson, creator of various Bitcoin price prediction tools, said: "Since 1990, $VIX has been in the high range only 11% of the time."
When the VIX volatility index reaches the current high level, there is a 89% probability historically that it corresponds to a stage bottom in the stock market. This provides a key macroeconomic reference - the traditional financial market is often highly positively correlated with Bitcoin, especially when risk appetite switches, the two asset classes will show synchronized bottoming characteristics.
2. Conditions for Short Squeeze Mature
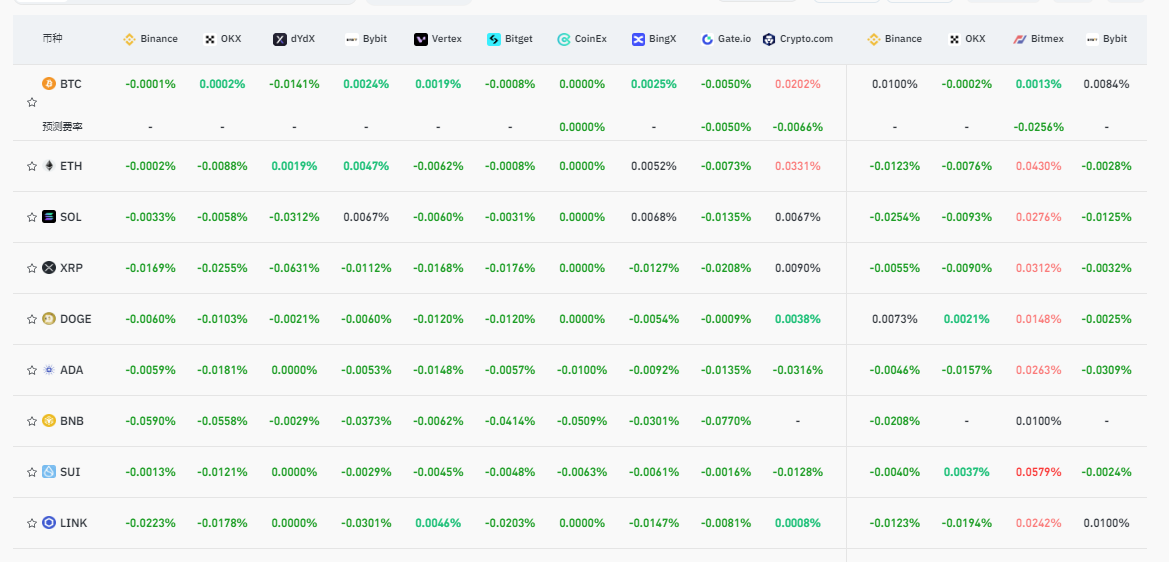 Renowned trader Kobeissi Letter observed that the current market sentiment has entered the "extreme fear" zone, with the accumulation of short contract volume in the derivatives market reaching a peak since September 2024, and the funding rates of mainstream cryptocurrencies have all turned negative. This extreme positioning structure is highly likely to trigger a "short squeeze": when the price breaks through the key $81,500 resistance, a large number of shorts will be forced to cover, forming a rocket-like upward thrust.
3. Technical Triple Bottom Divergence
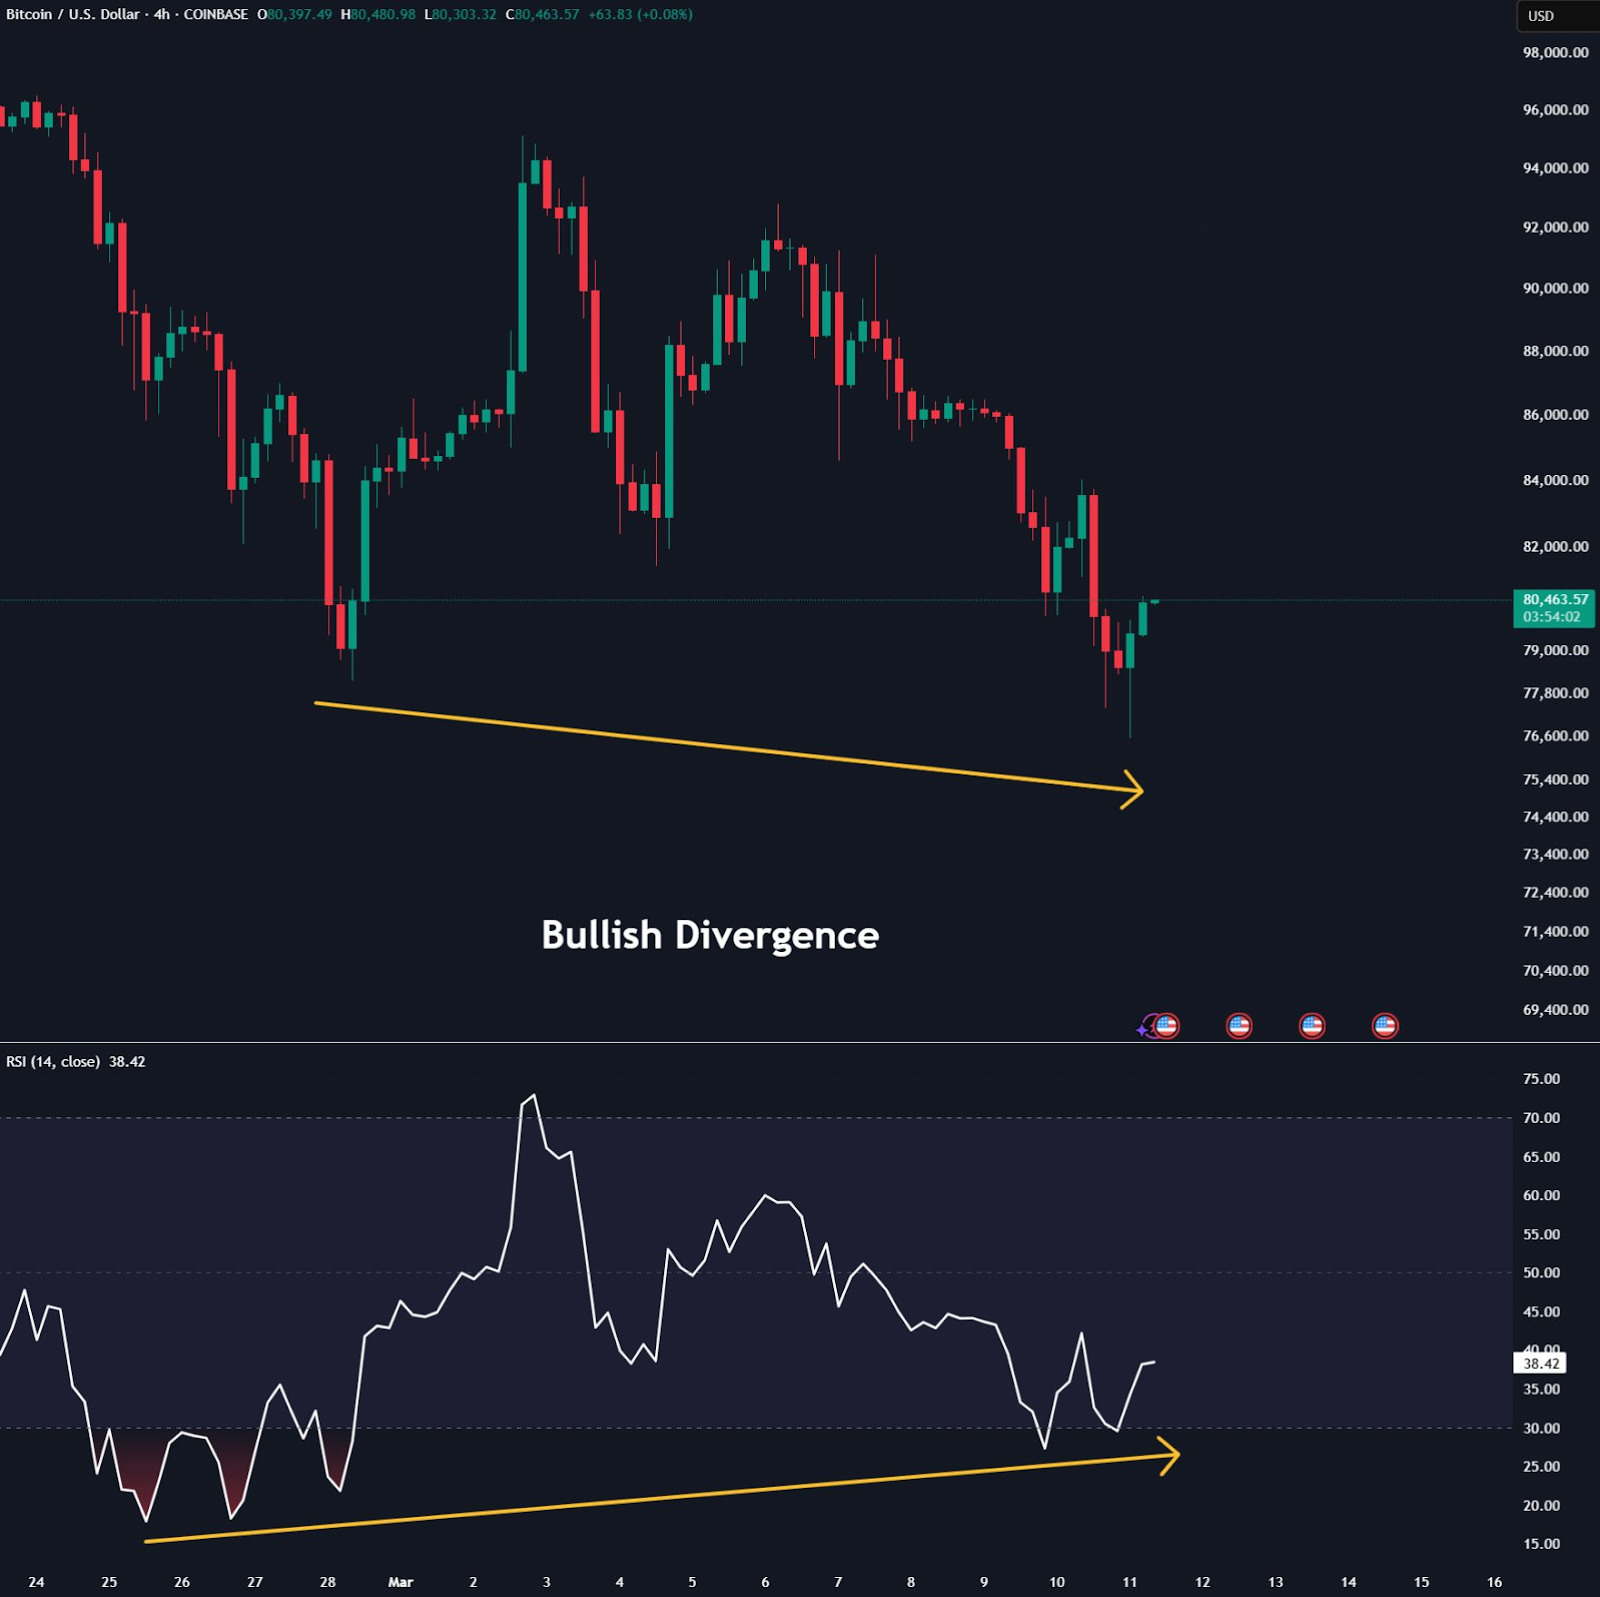
On the 4-hour chart, Bitcoin price has repeatedly tested the $76,600 level without breaking through, while the RSI indicator has formed a clear bottom divergence. This classic technical pattern has successfully predicted trend reversals in January 2023 ($16,800 bottom) and June 2024 ($56,500 bottom). If it can stabilize above $81,500 this week, the medium-term target will be the $88,000-$92,000 resistance zone.
II. Ethereum Bottom Signals: Whale Buying and Ecosystem Upgrade Dual Drivers
1. On-chain Data Shows "Whale Swallowing" Phenomenon
In the past 48 hours, addresses holding 1,000-10,000 ETH have suddenly increased their holdings by 330,000 ETH (about $630 million). Such large-scale concentrated buying usually occurs in two scenarios: either insiders have advance knowledge of positive news, or institutions believe the price is severely undervalued. It is worth noting that during the same period, the ETH reserves on exchanges have decreased by $1.8 billion, indicating that the chips are shifting from retail to whales.
2. MVRV-Z Score Hits a 17-Month Low
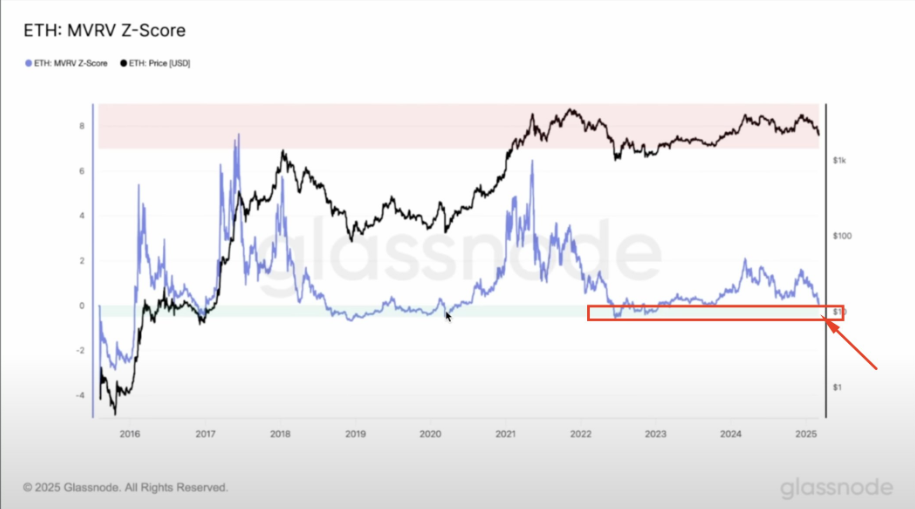 Ethereum's current MVRV-Z score has fallen below -0.5, a level last seen in November 2023 (corresponding to an ETH price of $1,600). Historical data shows that when MVRV-Z enters this range, the average gain in the following three months is 142%. Such extreme undervaluation often means that the market is overly panicked, but in fact harbors the opportunity for a reversal.
3. Pectra Upgrade Reconstructs Valuation Logic
The Pectra upgrade scheduled for Q2 2025 will bring two major changes:
- The staking threshold for validator nodes will be raised from 32 ETH to 2,048 ETH, increasing the locked-up amount 64-fold, and may also help the Ethereum ETF staking proposal pass.
- Introduce account abstraction, bringing DApp user experience on par with Web2 applications.
- These improvements directly address the market bias of "Ethereum lacking real use cases", injecting new vitality into the ecosystem.
III. Macroeconomic Environment: Stock Market Rebound and Regulatory Shift Provide Support
1. Tech Stock Rebound Eases Liquidity Pressure
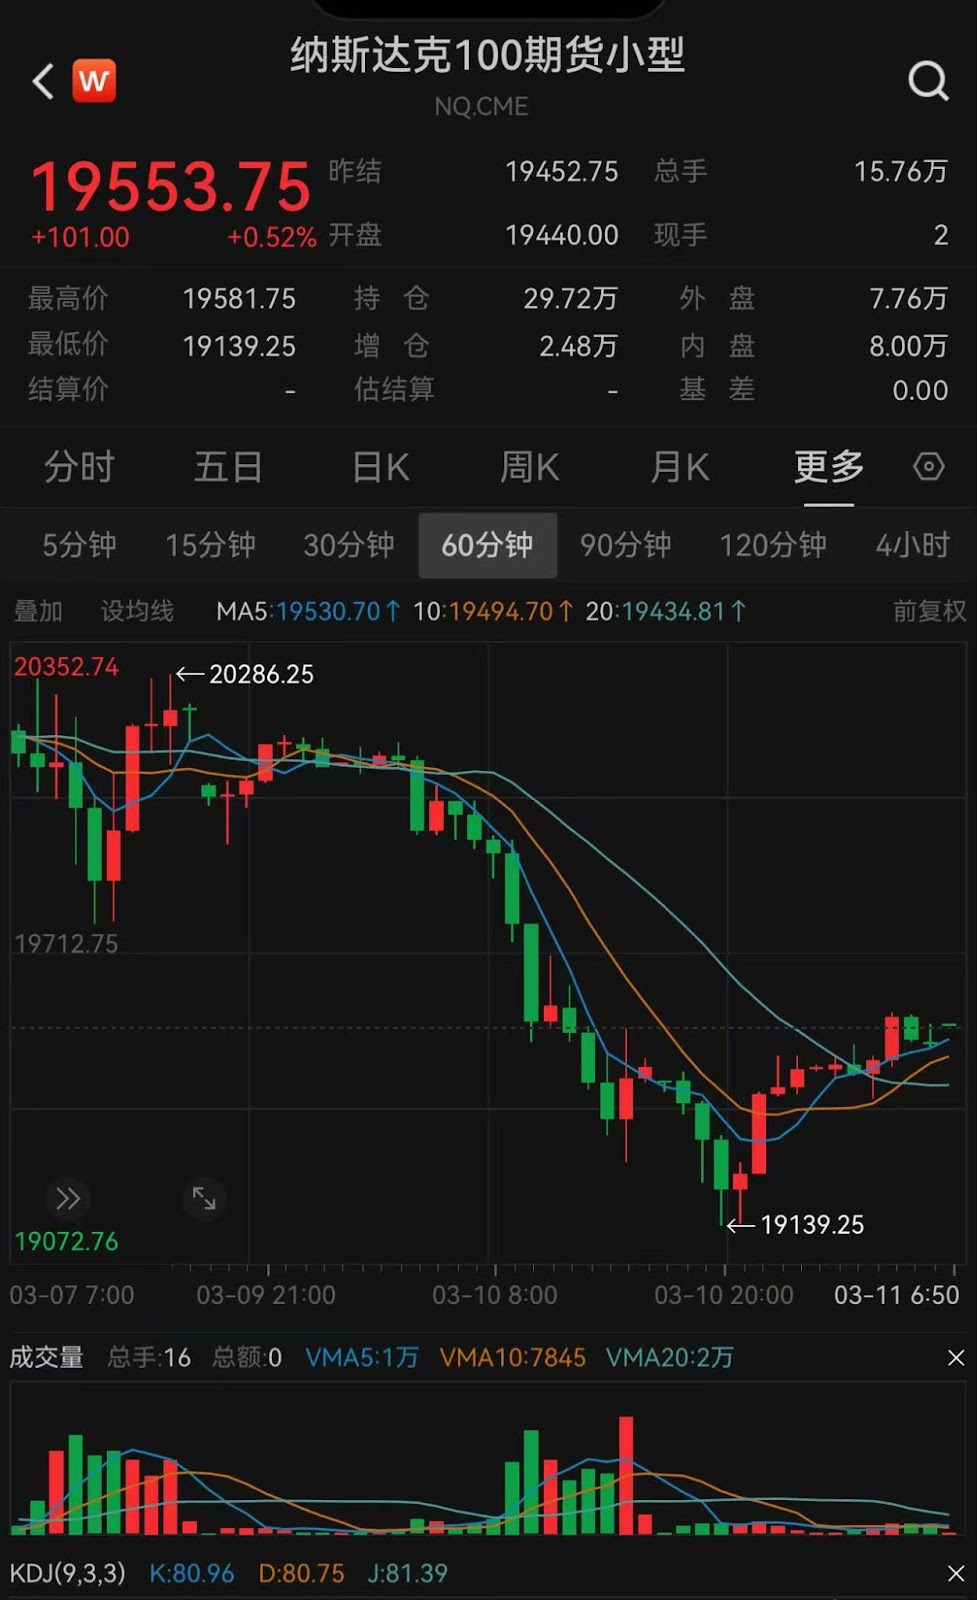
Nasdaq 100 futures rebounded 0.4% in early trading on March 11, with tech giants like Apple and Nvidia ending their consecutive plunges. This synchronized rebound is no coincidence - the latest FOMC minutes show that the probability of a rate cut in June has risen to 78%, signaling an improvement in global risk asset liquidity.
2. Trump's Crypto Strategic Reserve Plan, Regulatory Sandbox Resolves Compliance Risks
News continues to circulate that President Trump holds over $500 million worth of ETH, and his team's "Crypto Currency Strategic Reserve" policy is upending traditional perceptions. The U.S. Treasury may directly purchase BTC/ETH as foreign exchange reserves, an unprecedented super-bullish move. Meanwhile, multiple countries are relaxing restrictions on cryptocurrencies, meaning the channel for institutional capital to enter is fully open. Combined with regulatory sandboxes in Hong Kong and Singapore, the crypto market is transitioning from a gray area to mainstream financial infrastructure.
IV. Risk Reminder: Three Variables May Overturn the Script
Although multiple evidence points to the establishment of a bottom, investors still need to be wary of the following variables:
- A second dip in U.S. stocks: If the S&P 500 falls below the key 5,000-point support, it may trigger a chain reaction of declines in the crypto market.
- Geopolitical Black Swan: Escalation of tensions in the Middle East or the Taiwan Strait crisis could reverse risk appetite.
- ETF Capital Outflow: If the current U.S. Bitcoin ETFs continue to see net outflows, it may have an impact.
V. Operating Strategies After Bottom Confirmation
For investors of different styles, we recommend:
Short-term traders: Go long when ETH breaks above $2,050 and BTC above $83,500, with a stop loss 3% below the recent lows.
DCA investors: Adopt a "pyramid accumulation" strategy, building positions in 5 batches in the $1,750-$1,900 (ETH) and $76,000-$80,000 (BTC) ranges.
Miners/Long-term Holders: Leverage the current low volatility to buy December call options to hedge risks.
Conclusion: The Bull Market Train is Restarting
From on-chain data to technical patterns, from macro policies to market sentiment, all signals point to the same conclusion: March 11, 2025's $76,600 (BTC) and $1,754 (ETH) are likely to be the final bottoms of this adjustment. Although there may be bumps along the way, from a half-year cycle perspective, the current price levels may be the starting point of the second stage of the bull market. As legendary Wall Street trader Paul Tudor Jones said, "When lightning strikes, you must make sure you are there."


