XRP is accumulating in the $2.27-$2.32 range with a market capitalization of $131 billion, facing strong resistance at $2.40 in the context of weak liquidity.
XRP is in an important accumulation phase as it trades around the $2.30 level, fluctuating within a narrow range from $2.27 to $2.32. With a market capitalization of $131 billion and a 24-hour trading volume of $4.82 billion, this cryptocurrency is showing mixed signals across different time frames, making investors cautious about the short-term outlook.
During the day, the XRP price fluctuated between $2.14 and $2.28, reflecting the strong tug-of-war between buying and selling pressure. Technical indicators are sending inconsistent signals, making it more difficult to predict the next trend, especially in the context of declining trading volume.
Multi-timeframe analysis suggests a risk of correction
On the 1-hour timeframe, XRP is accumulating within the $2.25-$2.30 range, with short-term resistance at $2.30 and nearby support at $2.25. If the price breaks above $2.30, the next target could be $2.40. However, the low trading volume is increasing the risk of a correction to $2.22 before any significant upward move.

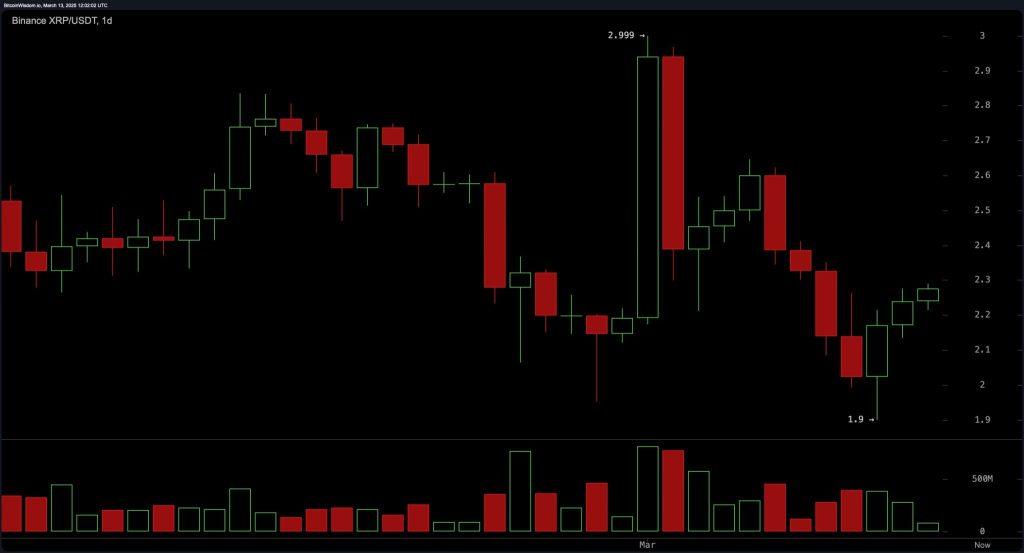
The 4-hour timeframe analysis shows that XRP has recovered well from the $1.90 Dip, but is currently facing a strong resistance zone of $2.35-$2.40. The gradual decline in trading volume from the initial recovery reflects the market's caution. Critical support lies in the $2.15-$2.20 range; if this level is maintained, XRP could target $2.50-$2.55.

In the long term, on the daily timeframe, XRP has failed to sustain the uptrend after reaching the $2.99 level, returning to test the strong support zone at $1.90 before stabilizing around $2.30. The critical resistance still lies in the $2.55-$2.60 range, and without a breakout with significant liquidity, the long-term trend remains uncertain.
The technical indicators are currently showing mixed signals. The RSI is at 46.75 in a neutral state, while the Stochastic is at 29.48, indicating potential for recovery. The CCI at -32.63 and MACD at -0.09279 are reflecting a slight downward trend. The short-term moving averages, such as the EMA 10 (2.27937), suggest a buy signal, while the SMA 10 (2.31070) signals selling pressure. The longer-term moving averages, such as the EMA 200 (1.86573) and SMA 200 (1.63488), still confirm the overall uptrend.
The bullish scenario for XRP depends on its ability to maintain the $2.20 support level and break through the $2.40 resistance zone. If this occurs with significant trading volume, the $2.50-$2.60 target will be within reach. Conversely, if the $2.20 level is not held, selling pressure could pull the price back to the $2.00 or lower.