

The market, project, and cryptocurrency information, opinions and judgments mentioned in this report are for reference only and do not constitute any investment advice.
Written by 0xWeilan
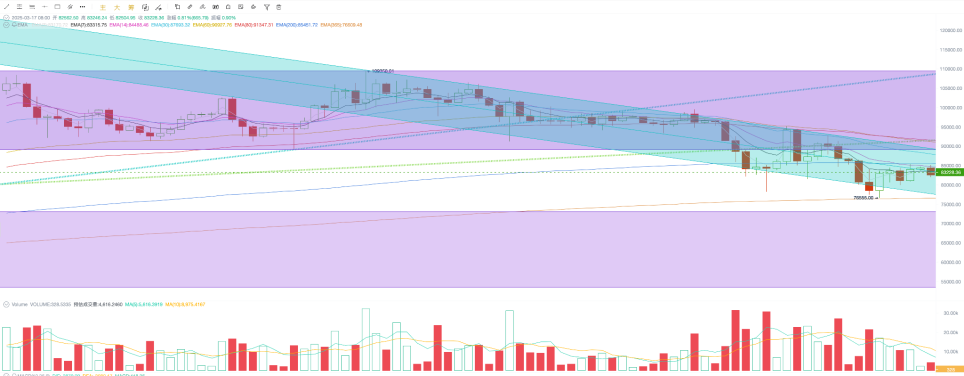
This week, BTC opened at $80,708.21 and closed at $82,562.57, up 2.31% for the week, with a volatility of 10.86%. Trading volume continued to decline compared to the previous week. BTC price fell and ran within a downward channel, with a slight rebound.
The US released slightly higher-than-expected CPI data, and there was further progress in the Russia-Ukraine war, which gave the US stock market and BTC a chance to catch their breath.
However, US valuations are still in a downward spiral, and based on historical data, there is still room for further declines. This is because the driving force behind the valuation decline - the chaos caused by tariffs that may trigger inflation and push the US economy into a "stagflation" state - has not been eliminated, and the chaos creator Trump is not ready to back down, while the Fed chairman is still reducing holdings based on data.
This chaos and deadlock make it difficult to dispel the "stagflation" concerns, and the longer it drags on, the greater the room for valuation adjustments. This is the reason why we are bearish on the BTC rebound in the short term.
Macro Finance and Economic Data
Last week, the US released employment data, with non-farm payrolls slightly lower than expected and the unemployment rate rising slightly, indicating a slowdown in employment, which exacerbated expectations of a US economic recession, causing the market to plummet in panic.
This week, the US released the latest CPI data, with the unadjusted CPI for February up 2.8% year-on-year, slightly lower than the expected 2.9% and the previous 3% increase; the seasonally adjusted CPI for the US in February rose 0.2% month-on-month, less than the expected 0.3% and the previous 0.5% increase. The CPI data came in lower than expected, offsetting the panic caused by last week's employment data, giving the market a temporary respite.
Under the sharp sell-off last week and the positive CPI data this week, the US stock market temporarily turned positive, recouping some of the losses, but remained in a downward trend for the week. The Nasdaq is still below the 250-day moving average, with the weekly decline narrowing to 2.43%; the S&P 500 has rebounded above the 250-day moving average; the Dow Jones fell 3.07%, slightly rebounding to the 250-day moving average.
On the 14th, the University of Michigan released the preliminary March consumer confidence index, which fell to 57.9, far below the market expectation of 63.1 and the previous 64.7, indicating a significant decline. At the same time, the one-year inflation rate expectation rose to 4.9%, exceeding the expected 4.2% and the previous 4.3%, also showing a significant increase. This indicates that US consumers' concerns about the economic outlook have intensified.
The University of Michigan's consumer confidence index is an early indicator of the impact of Trump's chaotic and reckless tariff policies on the confidence of end consumers. What is painful for the market and US businesses is that the US president is still enthusiastically exercising his power, and it may take even worse market feedback and a longer period of uncertainty before he changes course.
On Friday, US, European and even Russian stocks saw a significant rebound, mainly due to the market's "progress in the Russia-Ukraine war" - the two sides are planning a 30-day ceasefire agreement.
Trump's "conspiracy theory" of using government employee layoffs and tariff wars to achieve "economic recession" to force the Fed's hand is gaining more and more traction in the market, at least in terms of the outcome.
These are unconfirmed speculative factors, and a more objective judgment may be that the essence of this round of US stock market adjustment is the valuation adjustment triggered by the pause in interest rate hikes. The S&P 500 Shiller CAPE Ratio peaked at 37.80 in December, approaching the near-high of 38.71 in November 2021 after the pandemic-induced liquidity surge. This high valuation incorporated expectations of the "Trump trade" and the rapid development of the AI industry. Since 2025, DeepSeek has "burst" the growth myth of AI, and Trump's tariff policies and layoffs have shattered economic growth expectations, making the market unable to sustain such high valuations and turning to downward adjustments to seek a new balance.
Currently, the Nasdaq, S&P 500 and Dow Jones have fallen by a maximum of 14.59%, 10.36% and 9.79% respectively, all approaching the 250-day moving average, entering the "market correction" range (10%-20% decline), but this does not mean that the market has completed the clearing. The current S&P 500 Shiller CAPE Ratio is at 34.75, down about 8.07% from the peak, and based on the historical pattern of the past 20 years, if it continues to decline, it will return to 32.89, a further decline of more than 5%, and if it returns to the average of 27.25, there is still room for a further decline of over 21%. Of course, we judge that the probability of such a deep adjustment is extremely low, and it would require the US president and Powell to lose their minds and the US economy to truly enter a recession for this to happen.
In the midst of the chaos, risk aversion sentiment has heated up, pushing gold prices to briefly break through the $3,000 per ounce mark. The US dollar index has risen slightly after hitting a bottom, with the 2-year US bond yield rising 0.7% and the 10-year US bond yield rising 0.37%, indicating that some funds have also started to withdraw from US bonds and buy the dips in the stock market.
In summary, the US stock market has entered a correction phase, but the outlook for inflation and interest rate hikes remains uncertain, especially the impact of Trump's tariffs and layoffs has not yet passed, which means the market still has a high probability of further downward adjustments to resolve the chaotic market background and asset valuations. Linked to the BTC Spot ETF, we maintain our view that BTC will continue to be constrained by the US stock market adjustment, although BTC has rebounded for several consecutive days to return to around $83,000, there is still a possibility of a further decline to $73,000 in the next two months.
Stablecoins and BTC Spot ETF
Compared to the net inflow of $1.282 billion in the two channels last week, this week the two channels saw a net inflow of $237 million, a significant reduction in the inflow scale, specifically with an outflow of $842 million from the BTC Spot ETF and an outflow of $184 million from the ETH Spot ETF, while stablecoins saw an inflow of $1.264 billion.
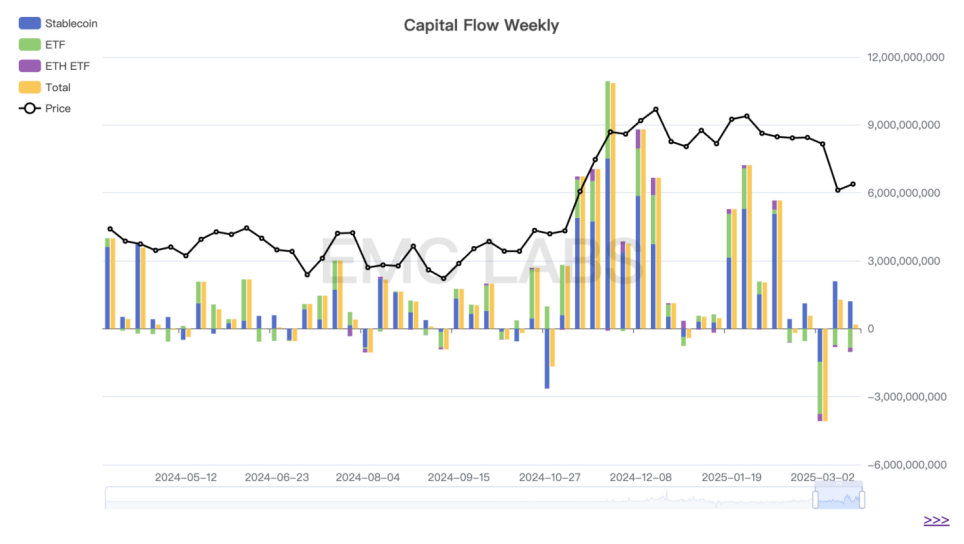
Crypto Market Capital Inflow and Outflow Statistics (eMerge Engine)
Although the scale of stablecoin inflows has decreased and the ETF channel outflows have increased, the existing capital entering the exchanges has been reconverted into buying power, allowing BTC's price to return to around $83,000. Currently, the capital stock in the exchanges has rebounded slightly, but this rebound can only be seen as a small amount of buy the dips behavior and is not enough to become the driving force to turn the market around.
Selling Pressure and Sell-offs
According to eMerge Engine data, the short-selling group continued to liquidate their positions during the sell-off last week, with the largest loss day being March 13, but the scale was lower than March 10.
In terms of unrealized gains and losses, the short-selling group is currently bearing an average loss of 9%, which includes a large number of ETF holders. In this round of decline, the short-selling group has been both a driving force and the main bearer of losses, and they will continue to be under pressure in the market turmoil, and may also be the source of continued selling pressure.
Over the past 3 weeks of decline, the long-position group has shifted from reducing to increasing their positions, adding about 100,000 BTC. Another group worth noting, the whales, have also increased their holdings by nearly 60,000 BTC, with an average cost below $80,000. In the long run, these two groups are the perennial winners and also play a stabilizing role in the market.
Cycle Indicators
According to the eMerge Engine, the EMC BTC Cycle Metrics indicator is 0.375, indicating that the market is in an upward consolidation phase.

EMC Labs (Emergence Labs) was founded in April 2023 by crypto asset investors and data scientists. It focuses on blockchain industry research and Crypto secondary market investment, with industry foresight, insights and data mining as its core competencies, committed to participating in the thriving blockchain industry through research and investment, and promoting blockchain and crypto assets to bring benefits to humanity.
For more information, please visit: https://www.emc.fund


