

Hedera (HBAR) is trading near the important psychological level of 0.20 USD, with technical indicators sending mixed signals. BBTrend has slightly turned positive at 0.97 but is still struggling to cross the price confirmation level of 1, indicating weak momentum.
Meanwhile, RSI has sharply dropped from near overbought to the neutral level of 49.58, reflecting diminished confidence after Bitcoin's recent decline. With HBAR at a critical level, traders are closely monitoring whether support will hold or if a deeper correction will occur.
HBAR BBTrend turns positive, but struggles to confirm upward momentum
The BBTrend (Bollinger Band Trend) indicator measures price trend strength and direction based on price deviation from the moving average in Bollinger Bands.
A positive value indicates upward momentum and buying strength, while a negative value shows downward pressure. The deeper the value, the stronger the trend, helping to detect breakouts or trend reversals.
When BBTrend oscillates near 0, it signals hesitation or consolidation, and values maintained above 1 are typically considered confirmation of a price increase gaining momentum.
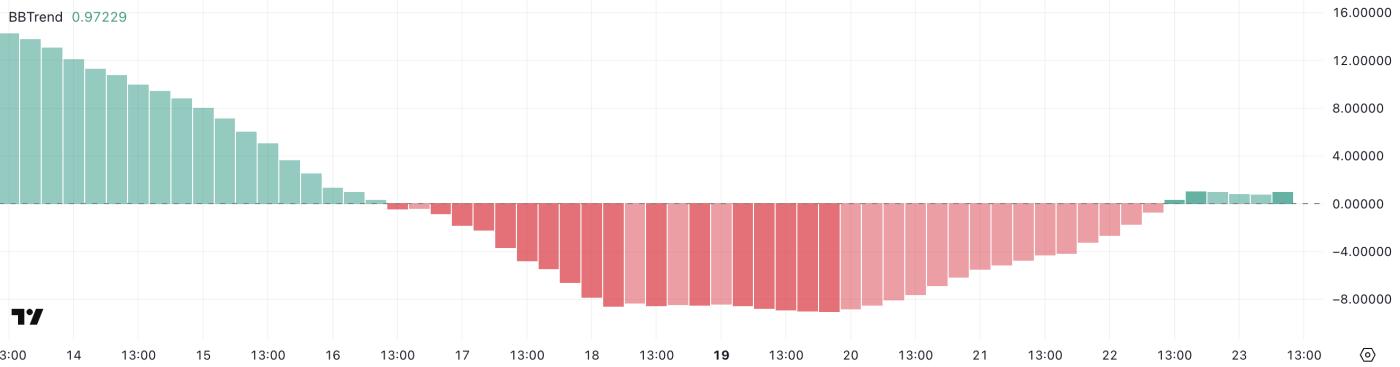 HBAR BBTrend. Source: TradingView.
HBAR's current BBTrend of 0.97 marks a recovery from the recent price decline, when it touched a low of -8.99 on 19/05/2025 and remained negative until 22/05/2025.
This return to the positive zone suggests momentum is trying to become favorable for Hedera, but the inability to maintain above 1 indicates price confidence remains fragile.
Although the indicator reflects an improving trend, it also emphasizes buyer hesitation, suggesting HBAR may remain range-bound unless stronger momentum emerges.
Hedera's RSI drops to neutral zone during BTC-led selloff
Hedera's Relative Strength Index (RSI) has dropped to 49.58, sharply declining from 69.91 just a day earlier.
This sudden change clearly reflects a loss of buying momentum, as broader market sentiment shifted to risk after Bitcoin dropped 3% due to Donald Trump's threat of a 50% tariff on the European Union.
The RSI decline emphasizes how investor confidence in HBAR fades with BTC's correction, pulling the token back to the neutral zone after nearly touching overbought conditions.
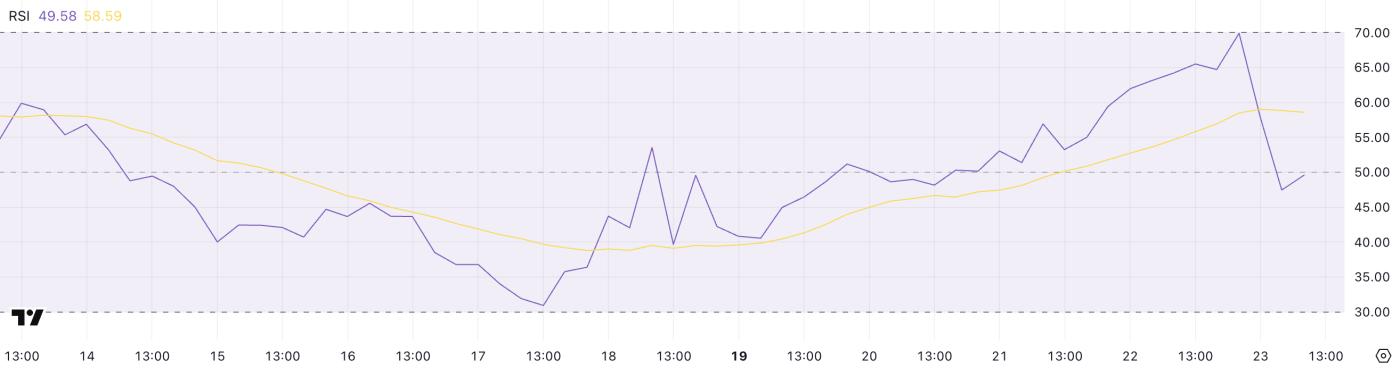 HBAR RSI. Source: TradingView.
RSI is a momentum indicator measuring the magnitude of recent price changes to assess whether an asset is overbought or oversold.
It oscillates from 0 to 100, with levels above 70 typically signaling overbought conditions and potential correction, while values below 30 indicate oversold conditions and potential recovery.
With HBAR's RSI currently near the median, the token lacks a clear trend, showing hesitation among traders. To restore momentum, HBAR needs new optimism or broader market stability – especially from Bitcoin.
HBAR approaches 0.20 USD dip — Important support levels watched
Hedera's price is at a critical technical crossroads, hovering just above the psychological level of 0.20 USD. If downward momentum continues, the token risks breaking below this level and could slide to the next support at 0.192 USD.
A break there would open the possibility of a deeper decline to 0.184 USD, potentially accelerating short-term selling pressure.
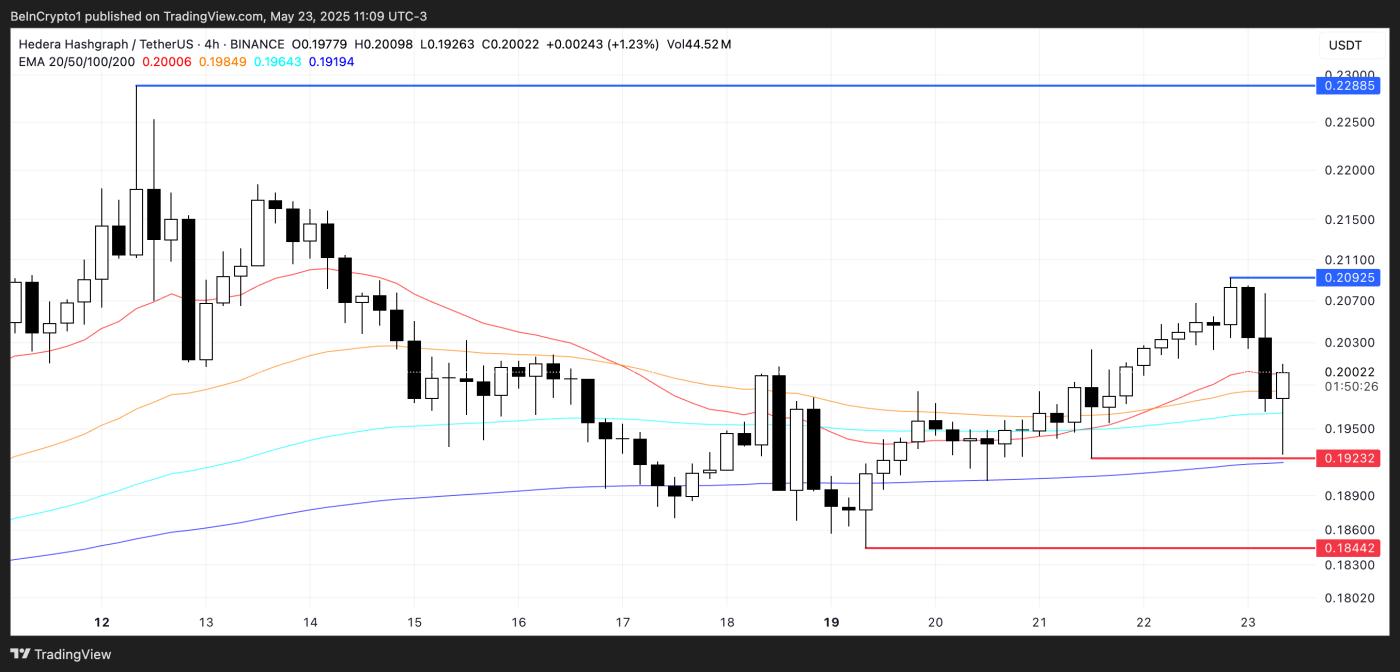 HBAR Price Analysis. Source: TradingView.
This scenario reflects broader weakness in the cryptocurrency market, especially after Bitcoin's recent correction.
However, if sentiment stabilizes and HBAR reverses, the first resistance to watch is 0.209 USD. A successful breakout above this level could open opportunities to move towards 0.228 USD, an area that likely requires strong volume and broader market support to reclaim.


