

Doge price dropped by 2% in the last 24 hours, offsetting weekly gains and negatively impacting 7-day performance. Some on-chain indicators suggest that the Doge downtrend may not be over.
In particular, the analysis of two major groups and supply profit data points to a potential continued decline. If key support levels break, Doge could fall 15% from its current levels.
Two Important Groups Withdrawing
The HODL wave indicator shows that two major Doge holding groups are currently reducing their positions. These groups are:
- 6-12 month holders, decreased from 15.46% to 14.705% over the past two weeks
- 1-3 month holders, sharply dropped from 8.0% to 4.614%
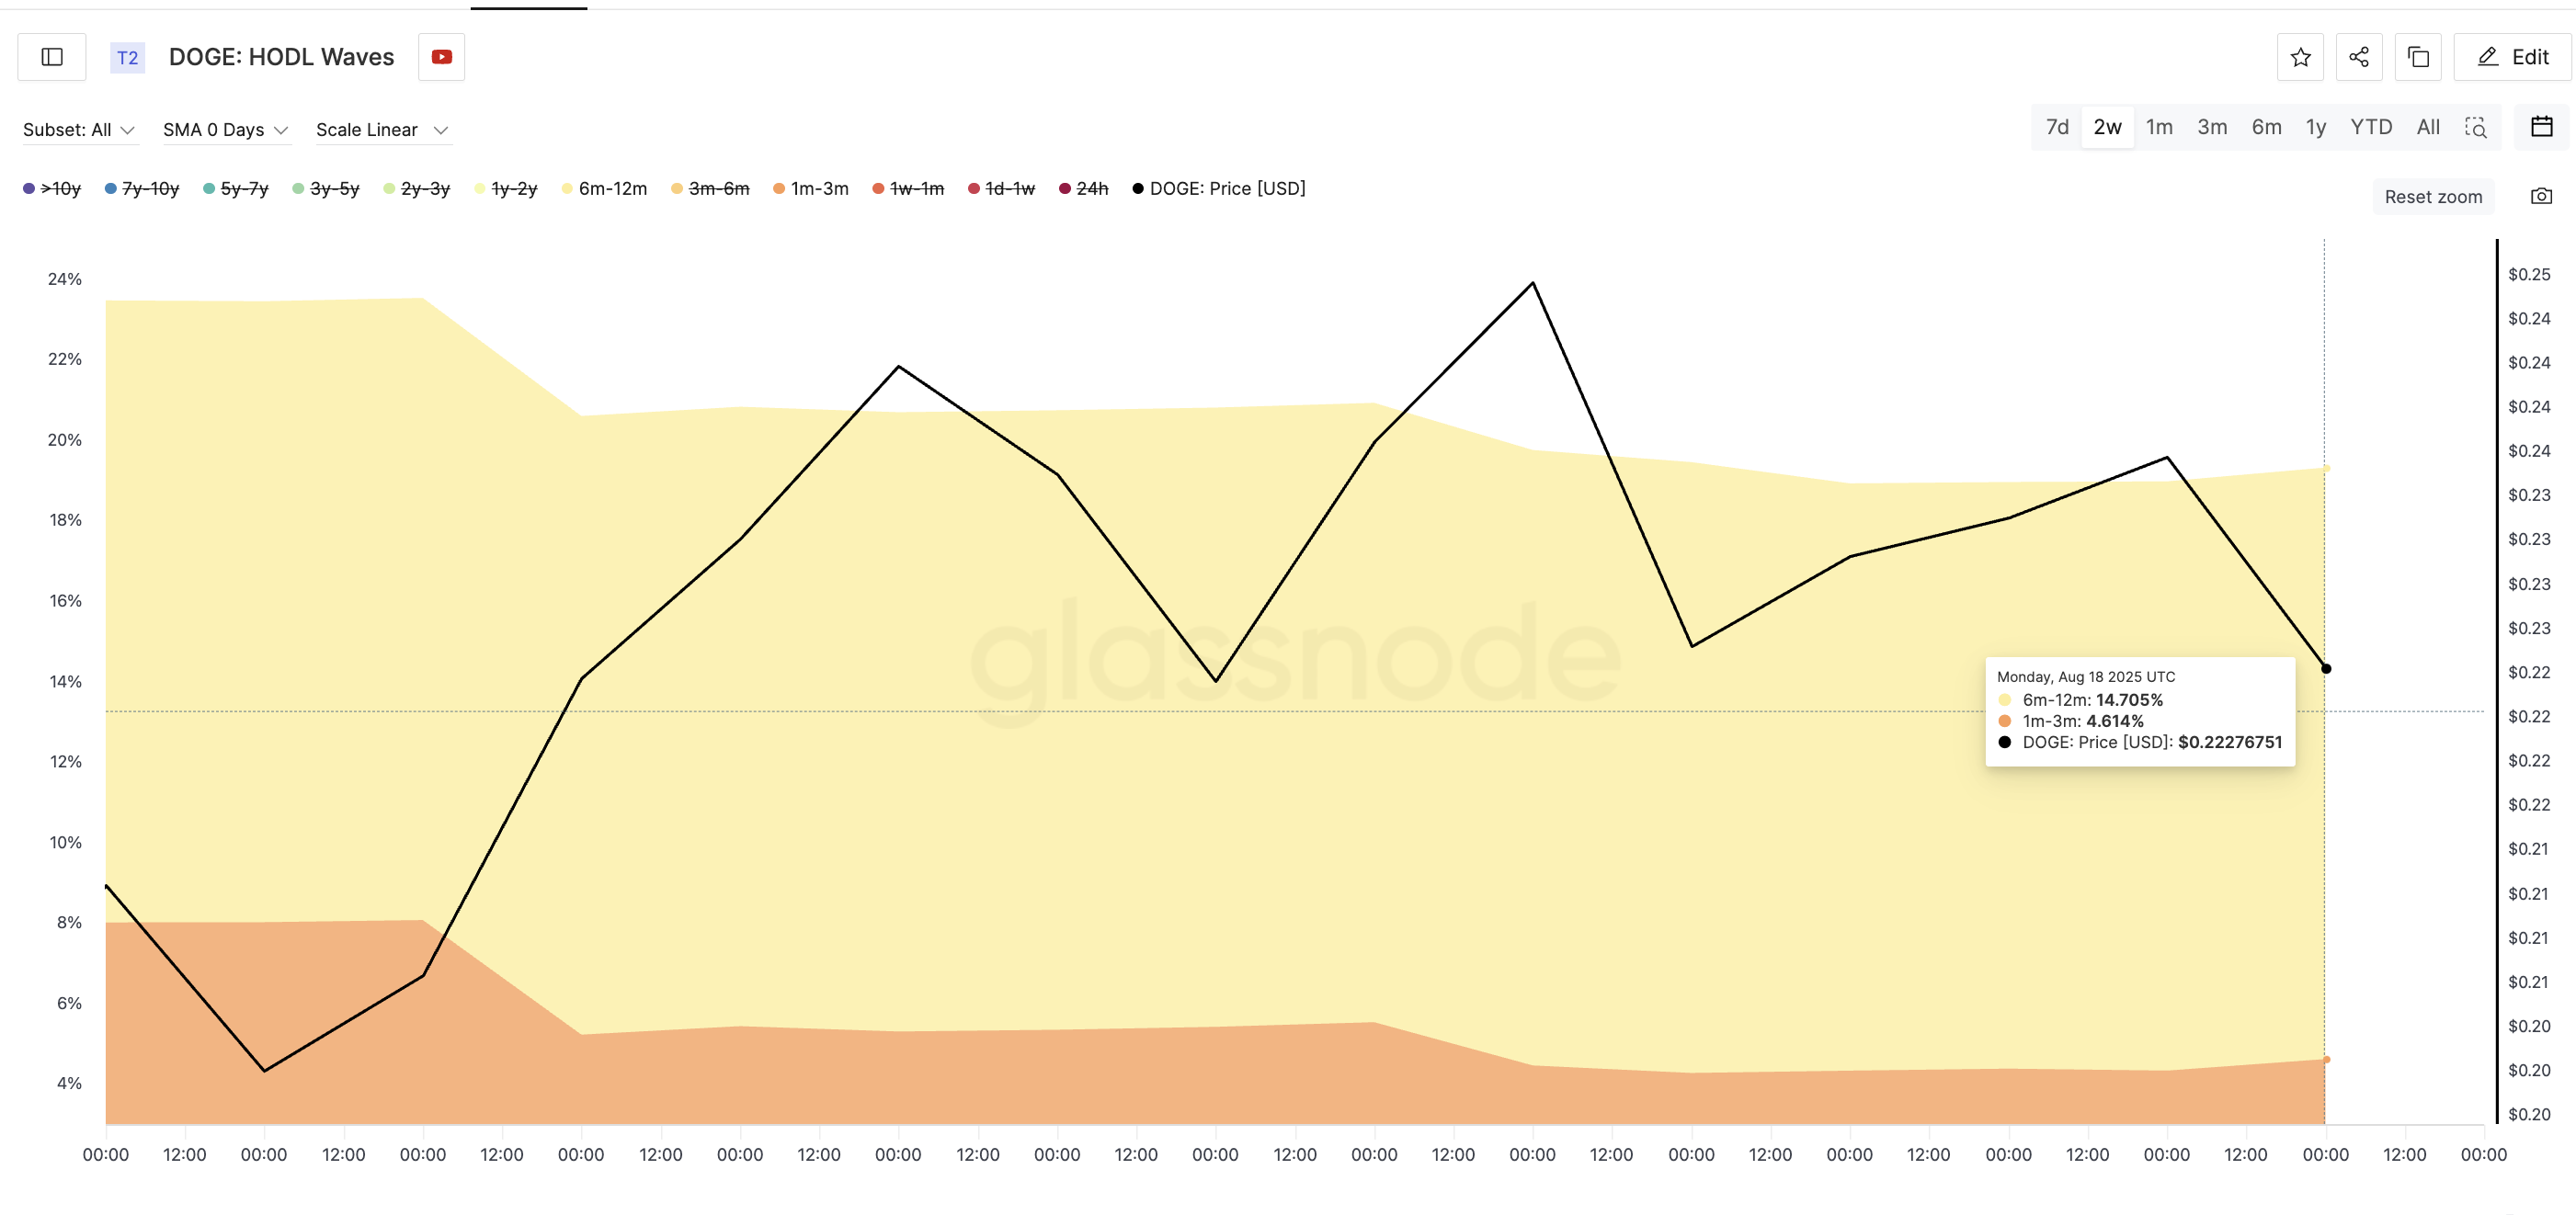
This suggests that medium to long-term believers are selling. These groups often indicate changes in holder sentiment. When both reduce exposure simultaneously, it means reduced confidence in short-term price recovery.
Particularly concerning is that this change occurred during a decline, not after an increase. This means these holders are exiting with losses or minimal gains, potentially indicating fear of deeper decline.
HODL waves show the distribution based on coin age, helping identify how long different holder groups have held tokens before moving them.
Profit-Yielding Supply Still High... A Problem?
Currently, 76.95% of Doge's circulating supply is still in profit. Historically, whenever this number exceeded 73%, a price adjustment followed.
On July 30th, when it was last at this level, Doge was trading around $0.22. Subsequently, the price dropped to $0.19.
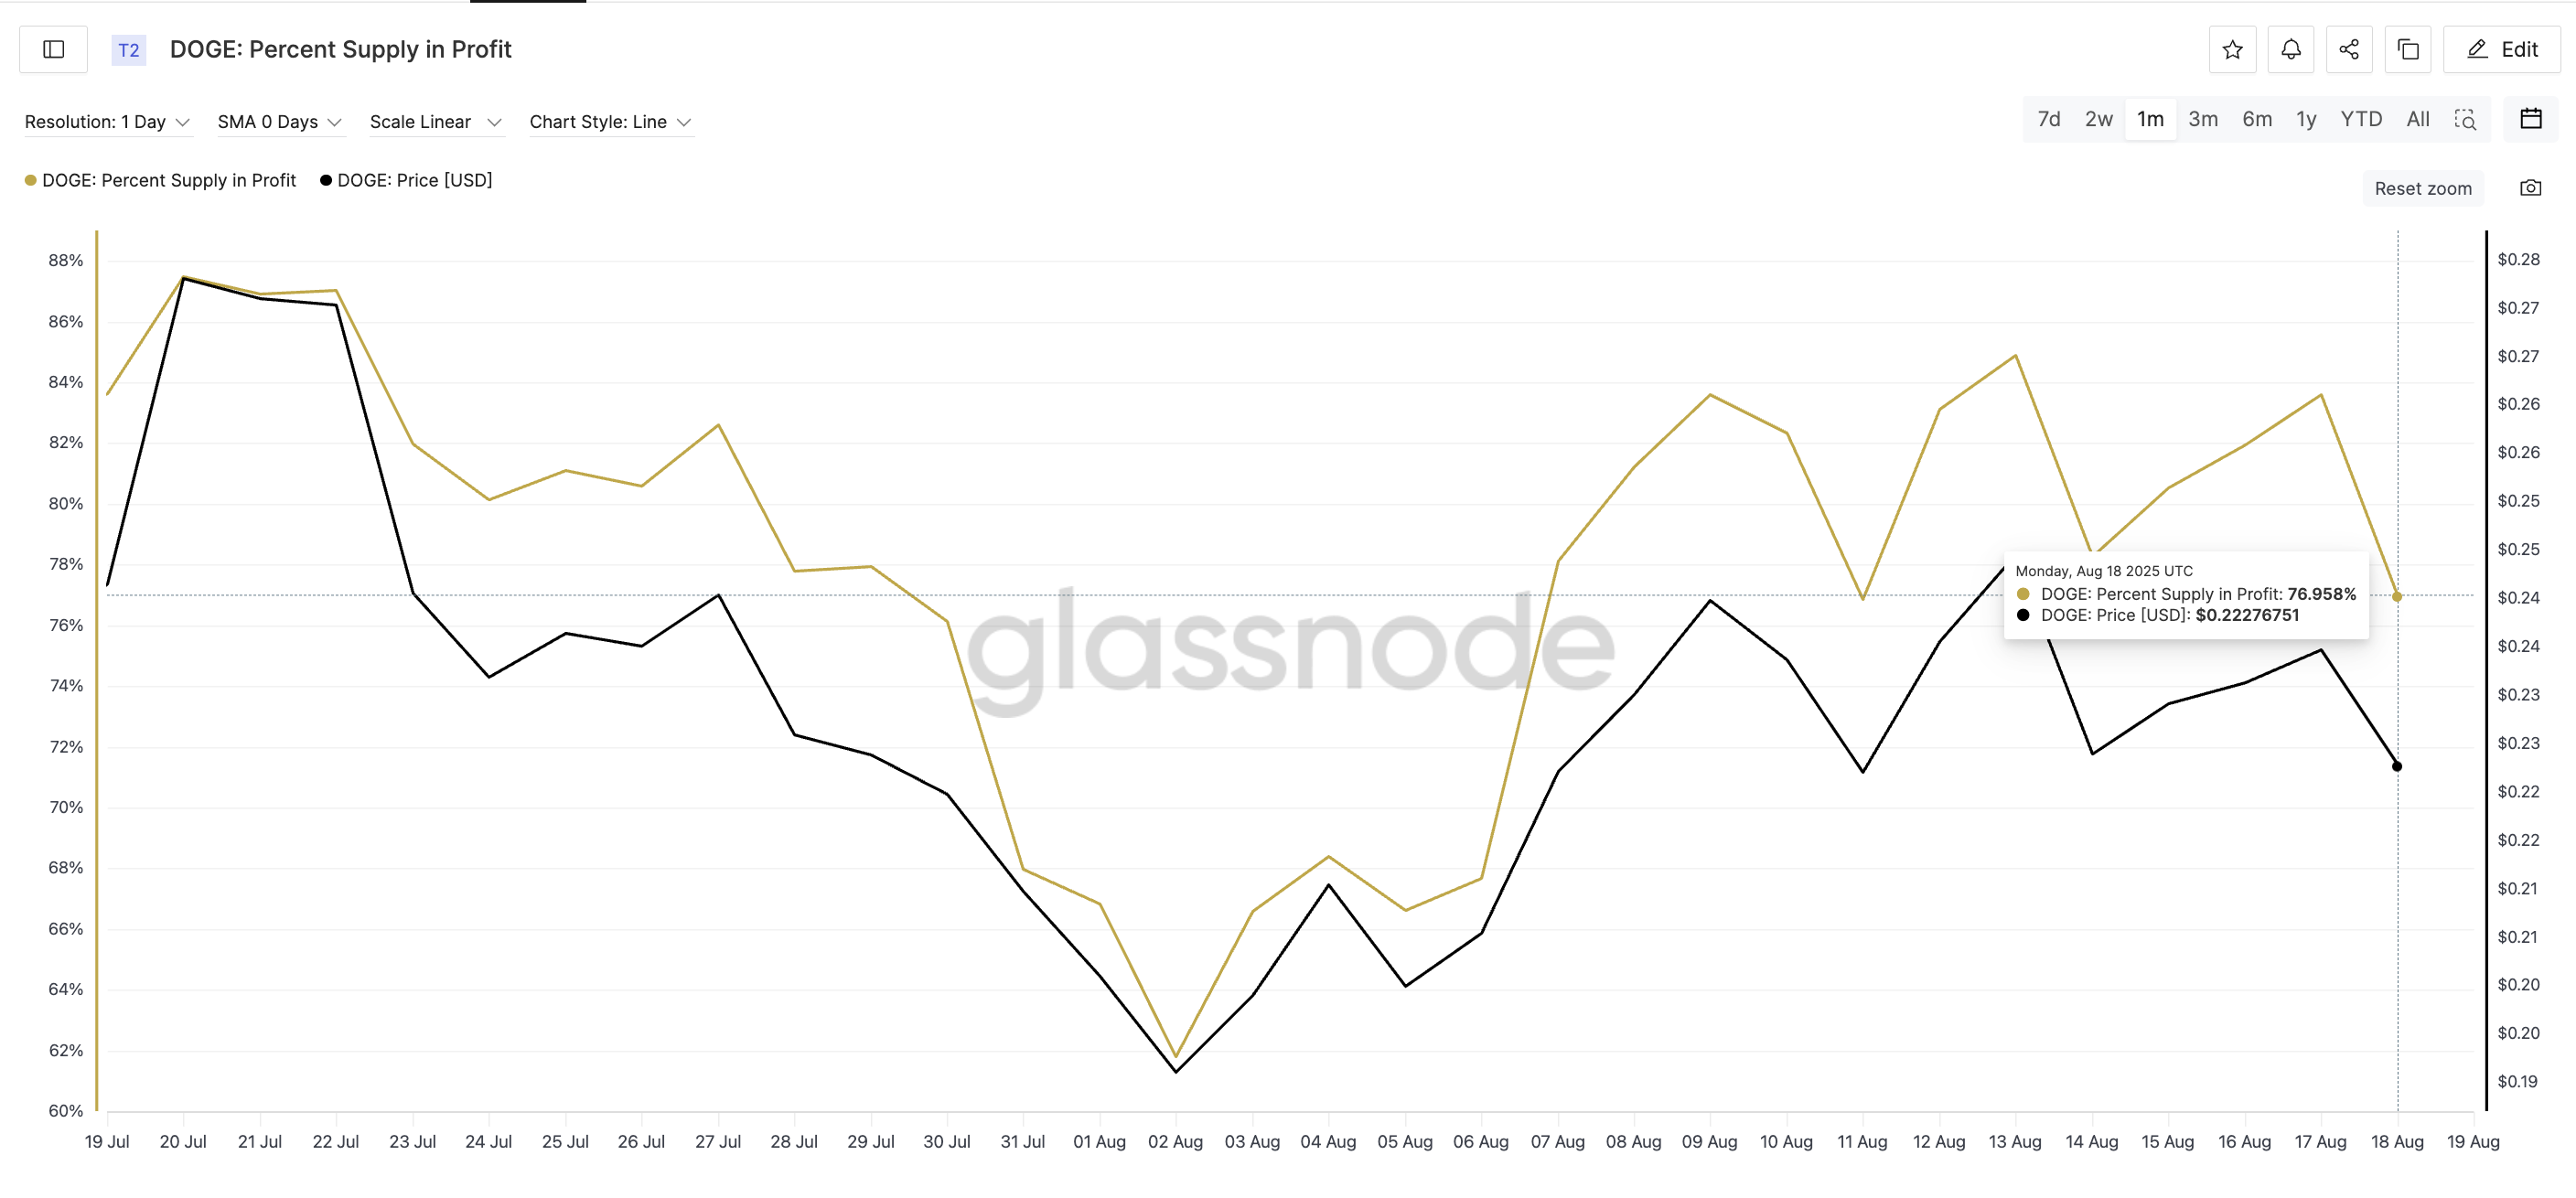
At that time, the profit-yielding supply ratio dropped to 61.79%, after which the Doge price began to rise again. We are currently in the same 76% range, and there's a risk that buyers will return only when the profit-yielding supply decreases. Until then, all increases will face strong selling pressure.
This is also connected to the HODL waves. When profit supply is high and medium to long-term holders start reducing positions, it reflects fear of profit loss or anticipation of deeper decline.
Token Technical Analysis and Market Update: Want more such token insights? Subscribe to the daily crypto newsletter by editor Harsh Notariya here.
Doge Price Chart Confirms Downward Pressure Indicators
Technically, Doge is near the critical support level of $0.21. Falling below this will clearly shift the structure to a downtrend. The next major support level is $0.20, with a broader decline target of $0.18, which represents a 15% drop from current prices.
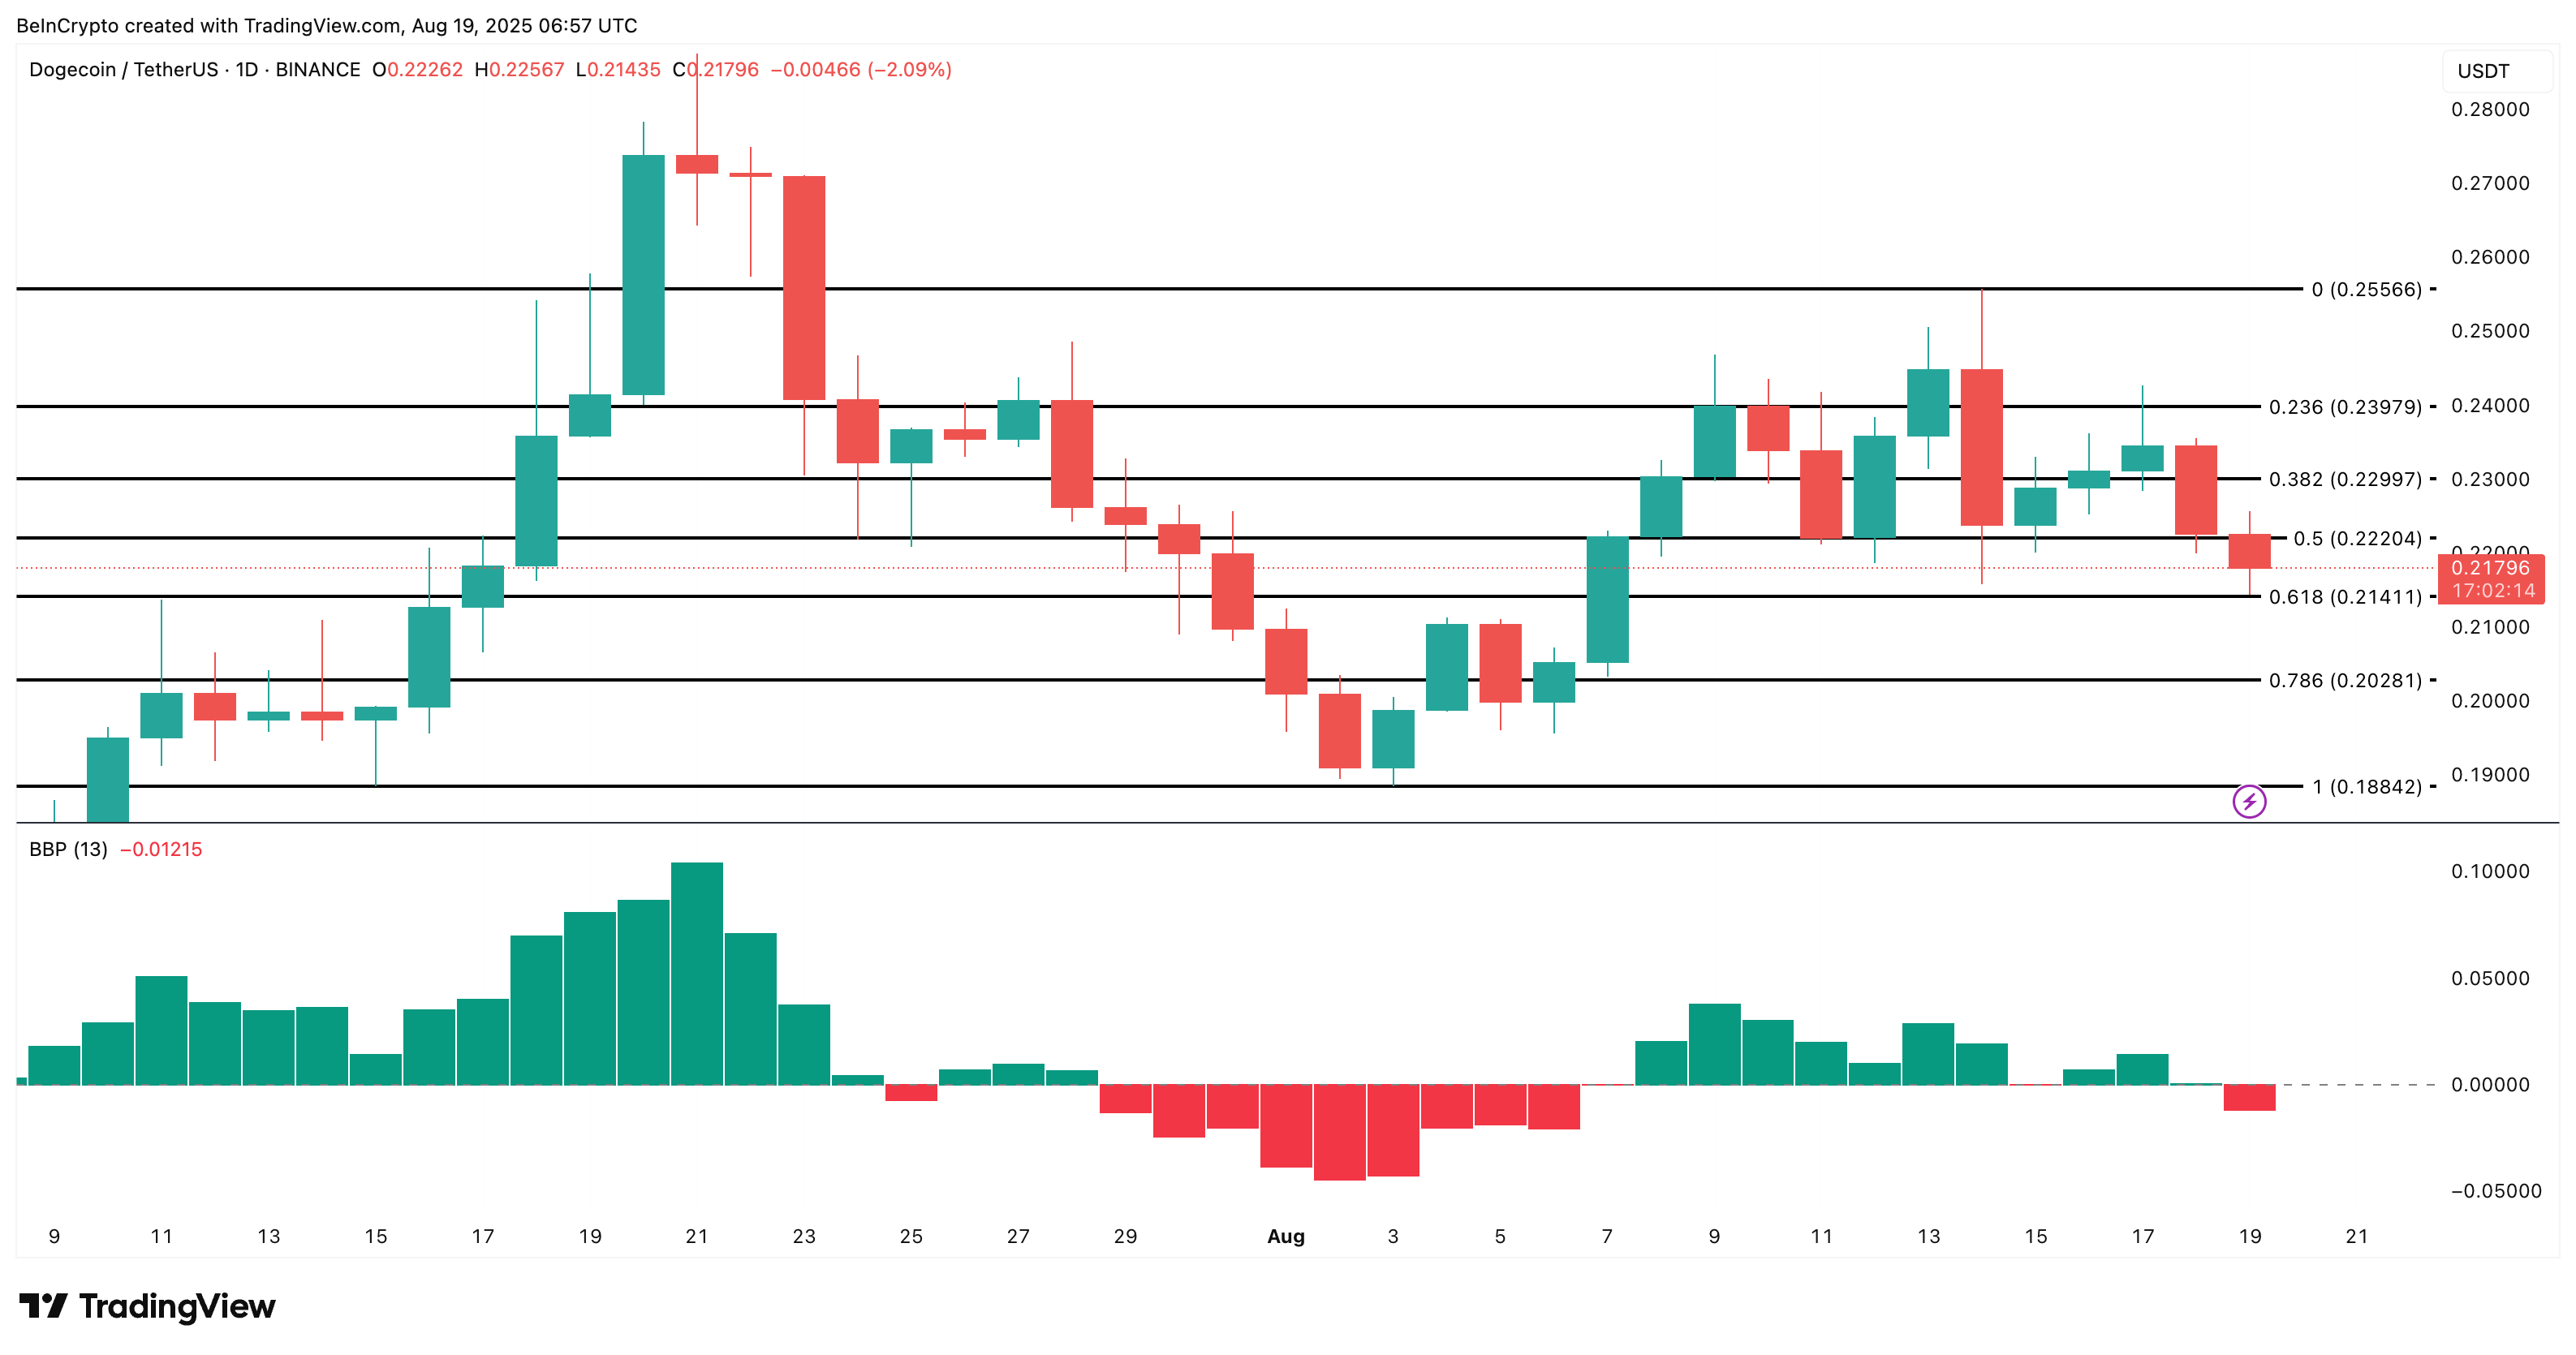
Meanwhile, the Bull and Bear Power (BBP) indicator has turned negative. This means selling strength exceeds buying strength, reinforcing what on-chain data already shows. Retail investors are selling, and buyers are staying away.
Bull-Bear Power (BBP) indicator — also known as Elder Ray Index — calculates the difference between price extremes and moving average to measure buyer (bull) and seller (bear) strength. It helps identify whether an uptrend or downtrend is dominant in the current market.
The momentum change is clear. If the $0.21 level is not maintained, the decline scenario becomes increasingly likely. However, if the Doge price recovers and breaks above $0.23, the decline hypothesis will disappear.


