

This post is an excerpt from our 2025 Geography of Cryptocurrency Report. Reserve your copy now!
We are excited to share the sixth annual Chainalysis Global Crypto Adoption Index. In each year’s report, we look at both on- and off-chain data to determine which countries are leading the world in grassroots crypto adoption. Our research highlights countries where unique cryptocurrency use cases are taking hold, and explores why people in countries around the world are embracing crypto.
Keep reading to learn more about:
- Our methodology for the Global Crypto Adoption Index;
- Changes in this year’s methodology;
- The top 20 countries on our Global Crypto Adoption Index for 2025, and;
- Key takeaways from the index.
Our Global Crypto Adoption Index methodology
The Global Crypto Adoption Index is made up of four sub-indices, each of which is based on countries’ usage of different types of cryptocurrency services. We rank all 151 countries for which we have sufficient data on each sub-index, weight the rankings by characteristics including population size and purchasing power, take the geometric mean of each country’s ranking in all four, and then normalize that final number on a scale of 0 to 1 to give every country a score that determines its overall ranking. The closer the country’s final score is to 1, the higher the rank.
To calculate our sub-indices, we estimate countries’ transaction volumes for different types of cryptocurrency services and protocols based on the web traffic patterns of those services’ and protocols’ websites. We acknowledge that web traffic data are imperfect, as some crypto users likely employ VPNs and other similar tools to hide their true physical locations. However, given that our index accounts for hundreds of millions of cryptocurrency transactions and more than 13 billion web visits, it is likely that any misattributed transaction volume due to VPNs is marginal, given the size of the dataset. We also compare findings with insights from local crypto experts and operators around the world, giving us more confidence in this methodology.
Below are descriptions of the sub-indices and how they are calculated, as well as improvements in our methodology since last year.
Sub-index category 1: on-chain cryptocurrency value received by centralized services, weighted by GDP per capita on a PPP-adjusted basis
We include this sub-index to rank each country by total cryptocurrency value received on centralized services, and weight the rankings to favor countries where that amount is more significant in comparison to the average person’s income in that country. To calculate this, we estimate the total value received on-chain by users of centralized services in each country, and weight that by GDP per capita on a PPP adjusted basis, which measures the country’s income per resident. The higher the ratio of on-chain value received to GDP per capita on a PPP adjusted basis, the higher the ranking. In other words, if two countries received equal amounts of cryptocurrency at centralized services, the country with a lower weighted GDP per capita, on a PPP-adjusted basis, would rank ahead.
Sub-index category 2: on-chain retail cryptocurrency value received by centralized services, weighted by GDP per capita on a PPP adjusted basis
We also estimate the activity of non-professional, individual cryptocurrency users at centralized services, based on the value of crypto they’re transacting compared to the average person’s purchasing power. We do this by estimating the amount of crypto received at centralized services by users in each country — similar to sub-index category 1 — but only counting value received in retail-sized transactions, which we designate as transactions under $10,000 worth of crypto. We then rank each country according to this metric, but weight it to favor countries with a lower GDP per capita on a PPP adjusted basis.
Sub-index category 3: on-chain cryptocurrency value received by DeFi protocols, weighted by GDP per capita on a PPP adjusted basis
We rank countries by their DeFi transaction volume and weight the rankings to favor countries with lower GDP per capita on a PPP adjusted basis.
Sub-index category 4: on-chain institutional cryptocurrency value received by centralized services, weighted by GDP per capita on a PPP adjusted basis
We also estimate the institutional activity of users at centralized services, based on the value of crypto they’re transacting compared to the average person’s purchasing power. We do this by estimating the amount of crypto received at centralized services by users in each country — similar to sub-index category 1 — but only counting value received in retail-sized transactions, which we designate as transactions over $1 million worth of crypto. We then rank each country according to this metric, but weight it to favor countries with a lower GDP per capita on a PPP adjusted basis.
Methodology changes
Methodology change 1: Removing the retail DeFi sub-index
This year, we removed the retail decentralized finance (DeFi) sub-index from our calculation of overall on-chain activity. While DeFi continues to represent a significant portion of total transaction volume globally, our internal analysis revealed that it constitutes a much smaller share of overall user activity — particularly when compared to centralized platforms. Including retail DeFi as a standalone category introduced a disproportionate emphasis on a relatively niche behavior, resulting in a skewed representation of crypto engagement.
To better reflect the actual composition of today’s crypto ecosystem and avoid over-optimizing for high-volume but low-frequency user behavior, we decided to remove this sub-index. This change ensures that the index weights user-level activity more evenly across types of services, leading to a more accurate and representative measure of grassroots adoption.
Methodology change 2: Adding an institutional activity sub-index
In 2025, institutional participation in cryptocurrency has reached new heights. With the approval of multiple spot bitcoin ETFs in the US and expanded regulatory clarity in major markets, traditional financial institutions have increasingly entered the space — not only as investors but as infrastructure providers and liquidity sources.
To reflect this growing influence, we introduced a new institutional activity sub-index, which captures the total value transferred by large-scale entities and smart contract addresses estimated to belong to professional investors, hedge funds, custodians, and other institutional players based on the transfer size. Any transfer greater than $1 million is placed in this category. By adding this component, the index now offers a fuller view of global crypto engagement, capturing both bottom-up (retail) and top-down (institutional) activity.
While our index still focuses primarily on grassroots adoption, incorporating institutional flows provides valuable insights into how mainstream the crypto ecosystem has become, especially in developed markets where these institutional transactions are often now conducted on behalf of end retail customers.
The 2025 Global Crypto Adoption Index Top 20
In 2025, APAC furthered its status as the global hub of grassroots crypto activity, led by India, Pakistan, and Vietnam, whose populations drove widespread adoption across both centralized and decentralized services. At the same time, North America climbed to the second-highest regional position in the presence of regulatory momentum, including the approval of spot bitcoin ETFs and clearer institutional frameworks, that helped legitimize and accelerate crypto participation across traditional financial channels.
| Country | Overall index ranking | Retail centralized service value received ranking | Centralized service value received ranking | DeFi value received ranking | Institutional centralized service value received ranking |
| India | 1 | 1 | 1 | 1 | 1 |
| United States | 2 | 10 | 2 | 2 | 2 |
| Pakistan | 3 | 2 | 3 | 10 | 3 |
| Vietnam | 4 | 3 | 4 | 6 | 4 |
| Brazil | 5 | 5 | 5 | 5 | 5 |
| Nigeria | 6 | 7 | 8 | 3 | 8 |
| Indonesia | 7 | 9 | 7 | 4 | 7 |
| Ukraine | 8 | 4 | 6 | 8 | 6 |
| Philippines | 9 | 6 | 9 | 13 | 10 |
| Russian Federation | 10 | 8 | 10 | 9 | 11 |
| United Kingdom | 11 | 27 | 12 | 12 | 9 |
| Ethiopia | 12 | 16 | 19 | 7 | 20 |
| Bangladesh | 13 | 14 | 15 | 14 | 14 |
| Turkiye | 14 | 11 | 13 | 22 | 12 |
| Korea, Rep. | 15 | 12 | 11 | 24 | 13 |
| Yemen, Rep. | 16 | 15 | 16 | 21 | 16 |
| Thailand | 17 | 21 | 17 | 15 | 17 |
| Venezuela, RB | 18 | 13 | 14 | 37 | 15 |
| Japan | 19 | 17 | 20 | 16 | 27 |
| Argentina | 20 | 18 | 18 | 29 | 19 |
APAC is the fastest growing region
In the 12 months ending June 2025, APAC emerged as the fastest-growing region for on-chain crypto activity, with a 69% year-over-year increase in value received. Total crypto transaction volume in APAC grew from $1.4 trillion to $2.36 trillion, driven by robust engagement across major markets like India, Vietnam, and Pakistan.
Close behind, Latin America’s crypto adoption grew by 63%, reflecting rising adoption across both retail and institutional segments. In comparison, Sub-Saharan Africa’s adoption grew by 52%, indicating the region’s continued reliance on crypto for remittances and everyday payments. These figures underscore a broad shift in crypto momentum toward the Global South, where on-the-ground utility is increasingly fueling adoption.
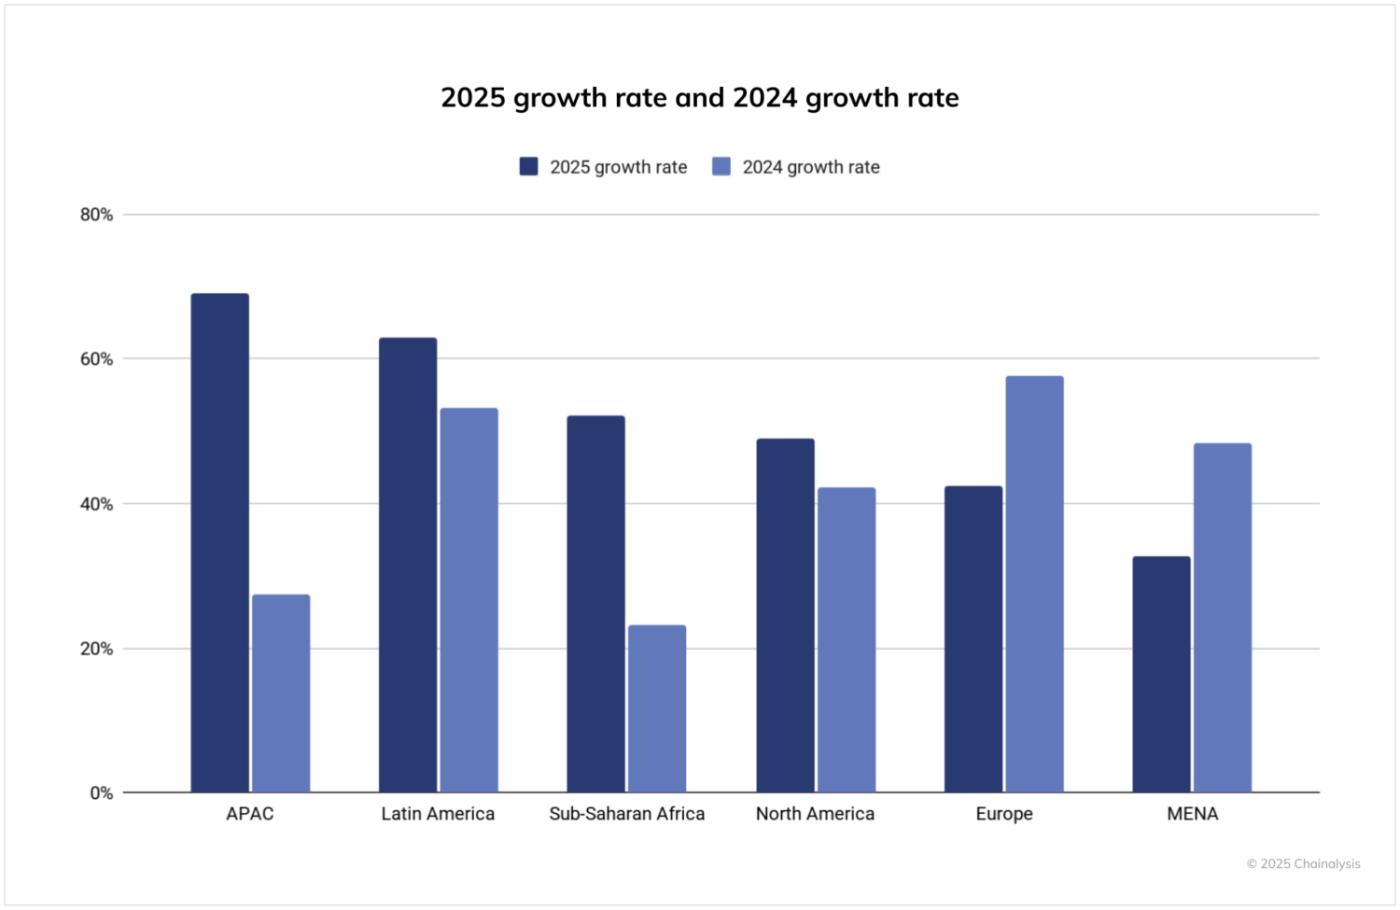
At the same time, North America and Europe continue to dominate in absolute terms, receiving over $2.2 trillion and $2.6 trillion, respectively, in the past year. North America’s 49% growth reflects a year of renewed institutional interest, bolstered by the launch of spot bitcoin ETFs and increased regulatory clarity. Europe’s 42% gain, while lower than other regions, still represents a substantial increase, given its already high base, highlighting the continent’s sustained institutional activity and expanding user base. Meanwhile, MENA saw a more modest 33% growth, suggesting a slower pace of adoption relative to other emerging markets, though total volume still exceeded half a trillion dollars.
Compared to the previous year, this cycle saw accelerated growth across nearly every region, with particularly sharp increases in APAC and Latin America. Last year, APAC grew by just 27%, but that number more than doubled to 69% in the most recent period. Similarly, Latin America jumped from 53% to 63% year-over-year, reinforcing the region’s trajectory as one of crypto’s fastest-growing hubs. Europe, MENA, and Sub-Saharan Africa also saw fast growth, suggesting a broad global expansion. Interestingly, North America’s growth rate also increased from 42% to 49%, further signaling that 2025’s regulatory clarity and institutional inflows are beginning to show up in transaction-level data.
Adjusting for population paints a new picture: A dominant Eastern Europe
Our index has traditionally focused on total activity adjusted for GDP per capita, an approach that worked best when crypto was niche and concentrated among high-volume users. But as adoption broadens, population-adjusted metrics offer a clearer view of where crypto is gaining real grassroots traction.
When we adjust our index for population, we uncover a very different set of leading countries. Countries in Eastern Europe, including Ukraine, Moldova and Georgia, top the list, reflecting high levels of crypto activity relative to the size of their populations. A combination of economic uncertainty, distrust in traditional financial institutions, and strong technical literacy across the region might drive adoption in Eastern Europe. These factors make crypto an appealing alternative for both wealth preservation and cross-border transactions, especially in countries facing inflation, war, or banking restrictions.
The 2025 Global Crypto Adoption Index Top 20, adjusted by population
| Country | Overall index ranking | Retail centralized service value received ranking | Centralized service value received ranking | DeFi value received ranking | Institutional centralized service value received ranking |
| Ukraine | 1 | 1 | 1 | 4 | 1 |
| Moldova | 2 | 2 | 2 | 14 | 2 |
| Georgia | 3 | 4 | 5 | 5 | 8 |
| Jordan | 4 | 10 | 16 | 1 | 24 |
| Hong Kong SAR, China | 5 | 17 | 9 | 6 | 9 |
| Vietnam | 6 | 7 | 6 | 10 | 7 |
| Latvia | 7 | 16 | 12 | 7 | 10 |
| Montenegro | 8 | 8 | 22 | 3 | 33 |
| Venezuela, RB | 9 | 3 | 3 | 52 | 4 |
| Slovenia | 10 | 25 | 7 | 16 | 5 |
| Estonia | 11 | 29 | 13 | 11 | 6 |
| Yemen, Rep. | 12 | 12 | 14 | 29 | 14 |
| Cambodia | 13 | 11 | 10 | 46 | 11 |
| Armenia | 14 | 6 | 8 | 56 | 12 |
| Singapore | 15 | 42 | 20 | 13 | 16 |
| Finland | 16 | 51 | 29 | 8 | 23 |
| Belarus | 17 | 9 | 17 | 39 | 27 |
| Korea, Rep. | 18 | 14 | 11 | 48 | 19 |
| Kyrgyz Republic | 19 | 20 | 15 | 47 | 15 |
| Portugal | 20 | 47 | 33 | 9 | 29 |
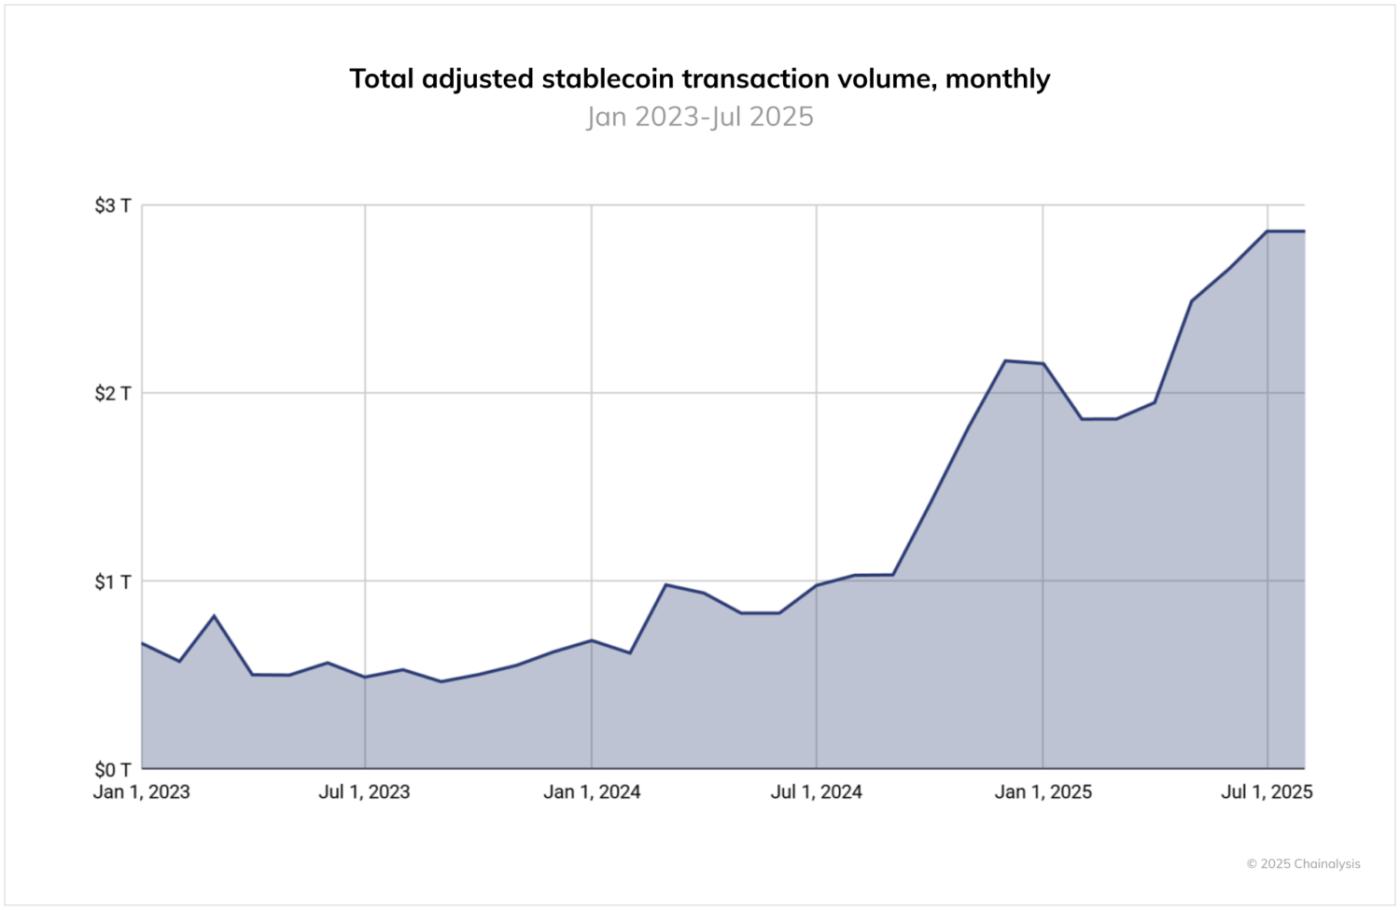
Stablecoins surge globally for a variety of use cases
The stablecoin regulatory landscape has evolved significantly over the past 12 months. While the GENIUS Act in the U.S. has not yet taken effect, its passage has driven strong institutional interest, while in the EU, the MiCA stablecoin regime has paved the way for the launch of licensed euro-referenced stablecoins like EURC.
Still, when we look at on-chain data, stablecoin transaction volume remains dominated by USDT (Tether) and USDC, which consistently dwarf other stablecoins in scale. Between June 2024 and June 2025, USDT processed over $1 trillion per month, peaking at $1.14T in January 2025. USDC, meanwhile, ranged from $1.24T to $3.29T monthly, with particularly high activity in October 2024. These volumes highlight the continued centrality of Tether and USDC in crypto market infrastructure, especially for cross-border payments and institutional activity.
However, looking at growth trends reveals a different dynamic. While Tether and USDC saw fluctuations with some volatility, smaller stablecoins like EURC, PYUSD, and DAI experienced rapid growth. For example, EURC grew nearly 89% month-over-month on average, with monthly volume rising from approximately $47 million in June 2024 to over $7.5 billion by June 2025. PYUSD also showed sustained acceleration, rising from around $783 million to $3.95 billion in the same period.
These shifts coincide with a rise in institutional activity around stablecoins. Stripe, Mastercard, and Visa have all launched products enabling users to spend stablecoins via traditional rails, while platforms like MetaMask, Kraken, and Crypto.com have introduced card-linked stablecoin payments. On the merchant side, partnerships between Circle, Paxos, and companies like Nuvei aim to streamline settlement in stablecoins. At the same time, traditional financial institutions such as Citi and Bank of America have announced their intentions to explore expanding their offerings and hinting at even launching their own stablecoins.
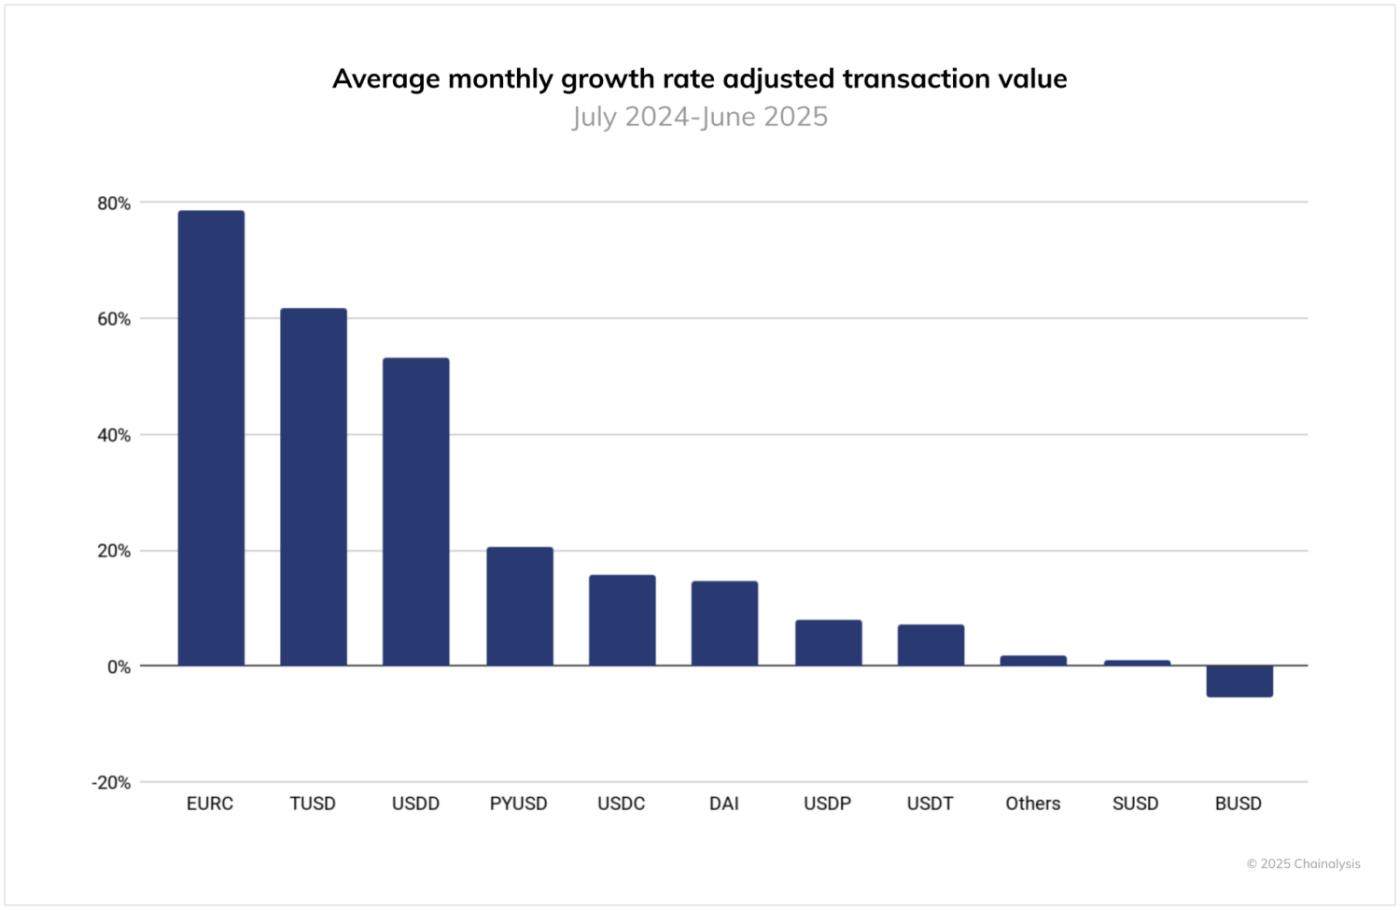
Regionally, this divergence may signal a shift in how stablecoins are being used. USDC’s growth appears closely linked to U.S.-based institutional rails and regulated corridors, while EURC’s rise suggests growing interest in euro-denominated digital assets, possibly driven by MiCA-compliant platforms and European fintech adoption. PYUSD’s growth could point to a broader appetite for alternative, highly regulated stablecoins in retail and payment contexts. These developments suggest a fragmenting but expanding stablecoin landscape, where local use cases increasingly shape global volumes.
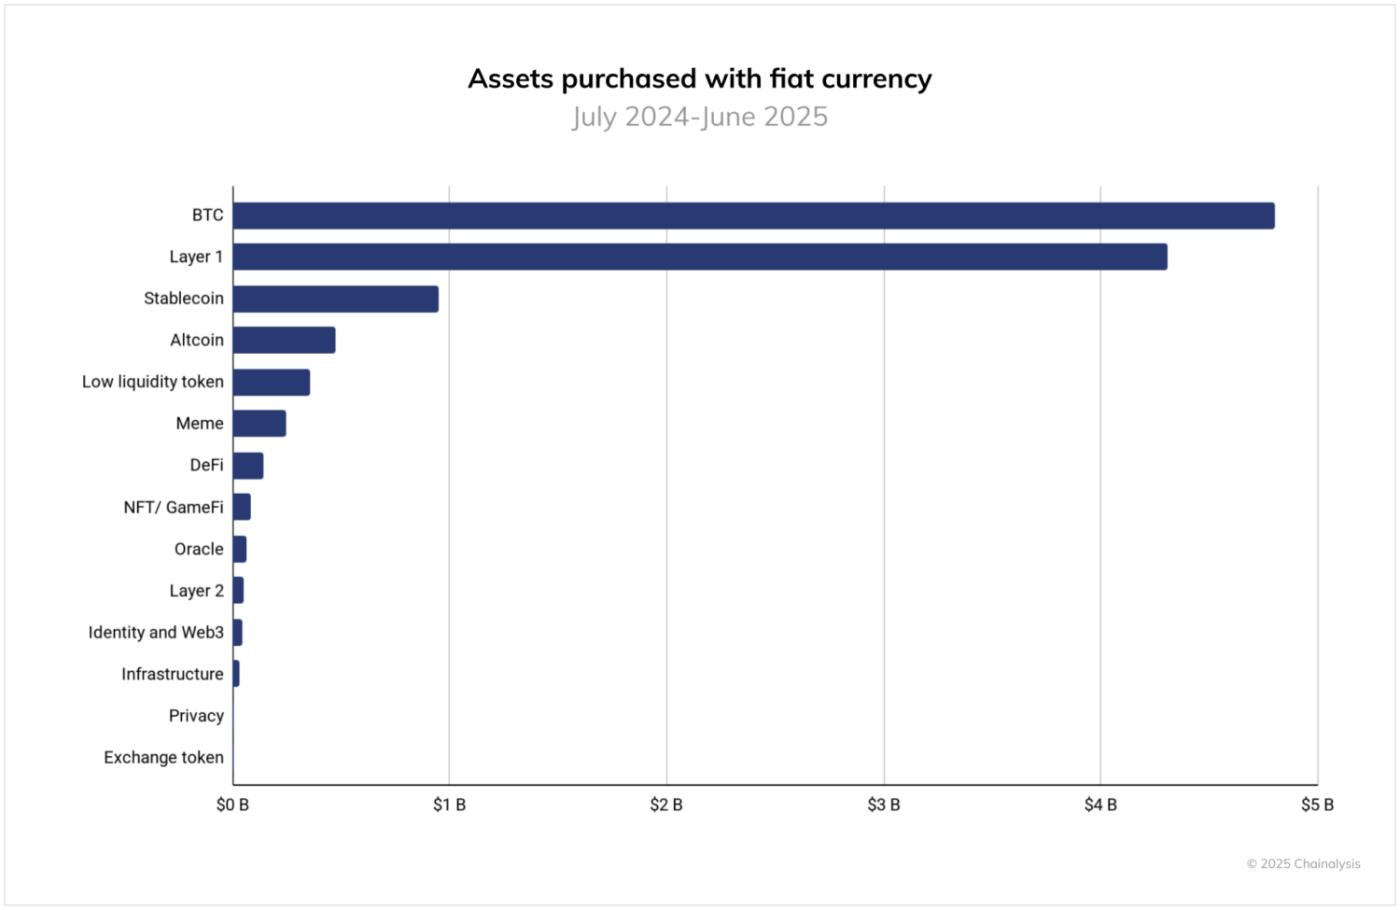
Fiat on-ramping: bitcoin remains the primary entry point
To assess fiat on-ramping behavior, we examined purchases made on centralized exchanges between July 2024 and June 2025, where users acquired cryptocurrencies using fiat trading pairs. Each transaction was categorized by the higher-order classification of the purchased asset, allowing us to evaluate which types of tokens serve as the primary gateway into the crypto economy.
Bitcoin leads by a wide margin, accounting for over $4.6 trillion in fiat inflows during the period. That’s more than double the next-highest category, Layer 1 tokens (excluding BTC and ETH), which saw roughly $3.8 trillion in volume. Stablecoins ranked third at $1.3 trillion, while altcoins followed at approximately $540 billion. Other categories, including low-liquidity tokens, meme coins, and DeFi, each received less than $300 billion in fiat inflows.
Geographically, the United States remains the world’s largest fiat on-ramp, with over $4.2 trillion in total volume — more than four times the next-highest country. South Korea followed with over $1 trillion, and the European Union registered just under $500 billion. Bitcoin dominance — the percentage of total fiat purchases allocated to BTC – was especially high in the United Kingdom and European Union, at approximately 47% and 45%, respectively. In contrast, South Korea showed a more diversified onramp profile, with BTC accounting for a lower share of volume. These variations reflect differences in investor behavior, exchange preferences, and access to alternative cryptoassets at the point of fiat entry.
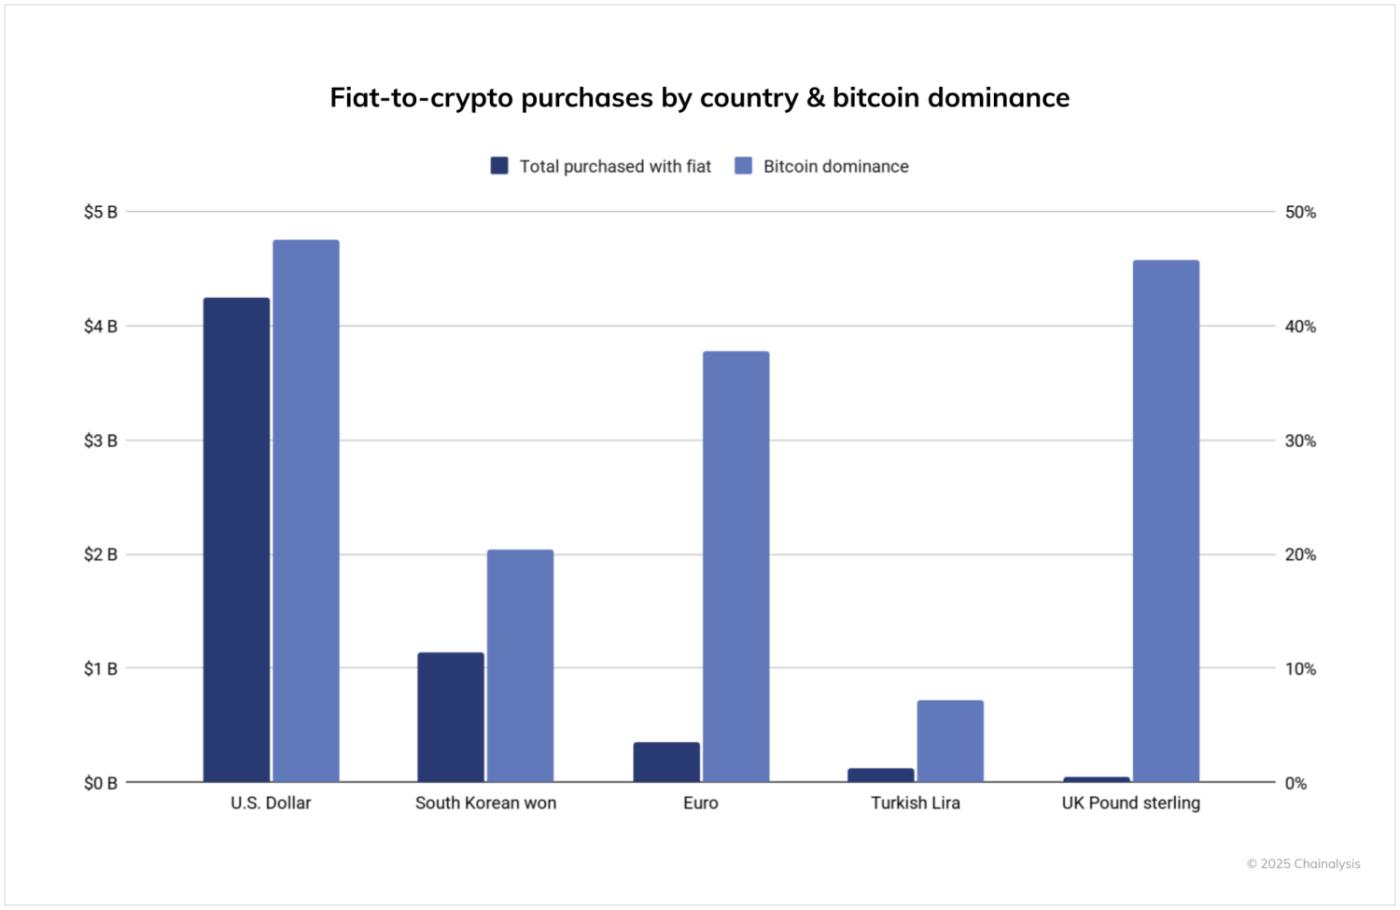
It’s important to note that this analysis only includes fiat onramping on tracked centralized exchanges and does not capture activity through OTC desks, informal markets like hawalas, or cash-based crypto shops, all of which may play a meaningful role in certain regions.
Adoption is spread across almost all income brackets
If we break the Global Adoption Index into a quarterly time series and segment it by World Bank income brackets, a clear picture emerges: high-, upper-middle-, and lower-middle-income cohorts crest together in this report. That synchronicity suggests the current wave of crypto adoption is broad-based rather than isolated – benefiting mature markets with clearer rules and institutional rails, as well as emerging markets where remittances, dollar access via stablecoins, and mobile-first finance continue to accelerate adoption. In other words, crypto adoption is truly global.
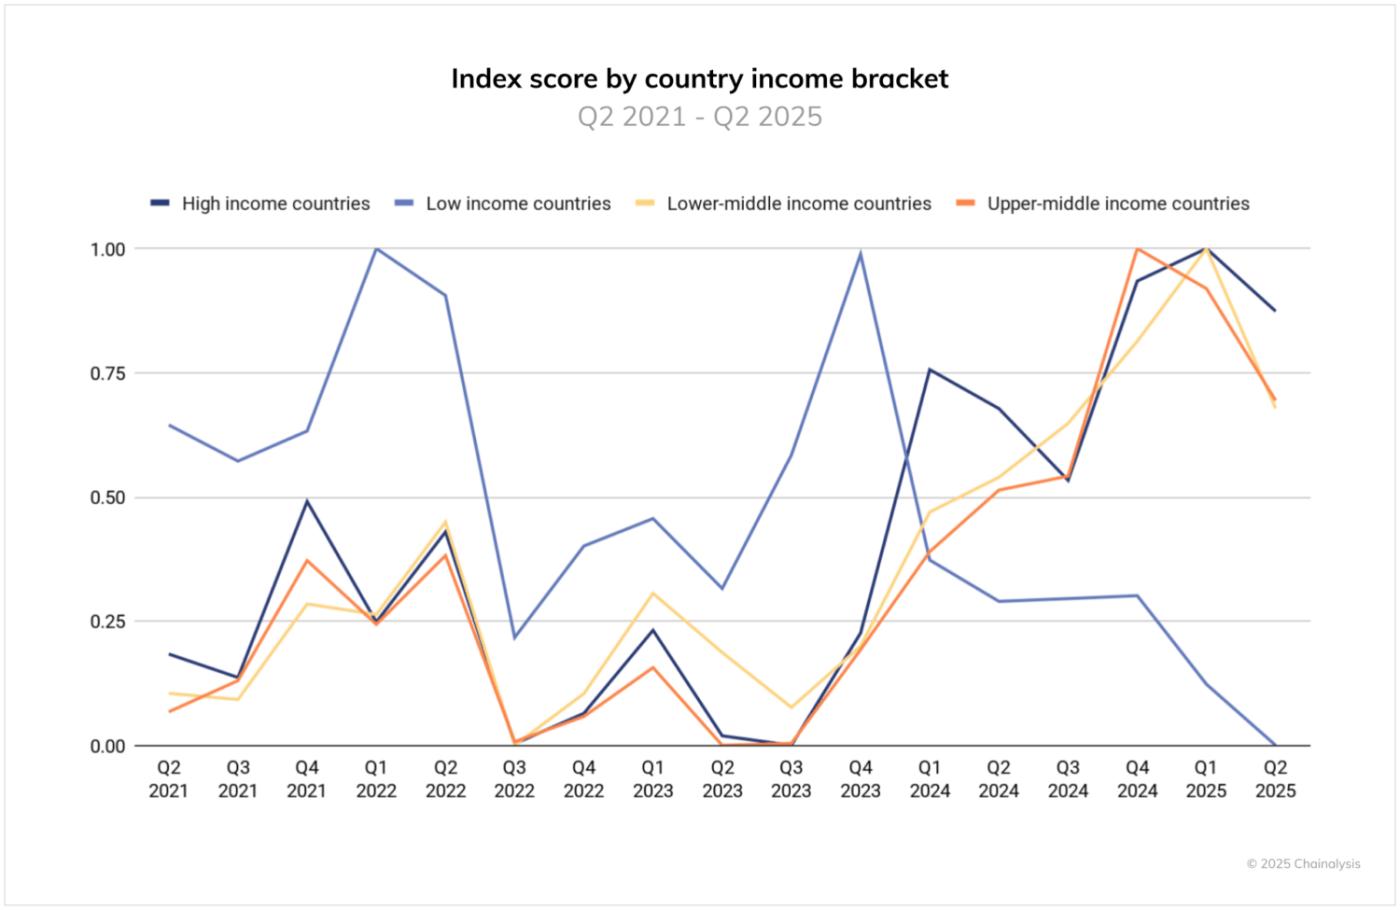
There’s an important caveat in the low-income country cohort (LIC). This basket includes several countries you wouldn’t ordinarily expect to sustain robust crypto usage, and that composition produces more volatility – brief surges followed by retracement – driven by factors such as policy shocks, connectivity and liquidity constraints, and conflict-related disruptions. Afghanistan, for example, is a LIC that Chainalysis identified as temporarily losing all crypto activity following the US withdrawal in 2021. The global peak signal is real, but LIC trends are more fragile and episodic; durable gains there will hinge on improving on-ramps, regulatory clarity, and basic financial and digital infrastructure.
This website contains links to third-party sites that are not under the control of Chainalysis, Inc. or its affiliates (collectively “Chainalysis”). Access to such information does not imply association with, endorsement of, approval of, or recommendation by Chainalysis of the site or its operators, and Chainalysis is not responsible for the products, services, or other content hosted therein.
This material is for informational purposes only, and is not intended to provide legal, tax, financial, or investment advice. Recipients should consult their own advisors before making these types of decisions. Chainalysis has no responsibility or liability for any decision made or any other acts or omissions in connection with Recipient’s use of this material.
Chainalysis does not guarantee or warrant the accuracy, completeness, timeliness, suitability or validity of the information in this report and will not be responsible for any claim attributable to errors, omissions, or other inaccuracies of any part of such material.
The post The 2025 Global Adoption Index: India and the United States Lead Cryptocurrency Adoption appeared first on Chainalysis.


