

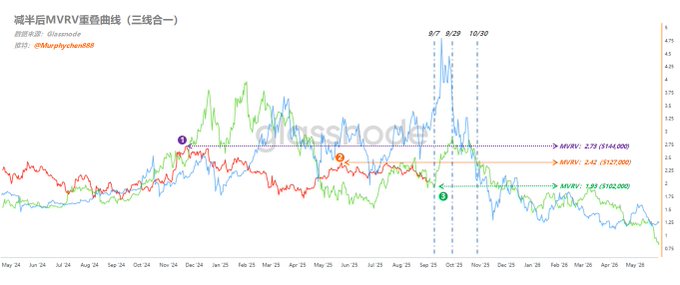
The indicator I get nagged about the most is, surprisingly, a mystical one—the “Three Lines Converge.” On September 5th at 20:30, the US unemployment rate and non-farm payroll data for August will drop. This is another major macro event that could heavily impact whether the Fed cuts rates in September and what the rate cut path looks like going forward. I checked out some analyses from macro experts. The TL;DR: if the jobs data is too strong, rate cut expectations drop—bearish. If the data is too weak, people worry about recession or stagflation—also bearish. Not sure if I’m getting this totally right, but my takeaway is: no matter if the data is good or bad, what really matters is how the market interprets it. What will the market do at that moment? For a macro noob like me, it all just feels... kinda mystical. As the saying goes: “Whoever tied the bell should untie it.” Maybe to solve the mysteries, you need to look for answers in the mystical. So, here I am, stargazing again at night... (Pic 1) Let’s recap the last time I watched the “Three Lines Converge”: from Aug 22 to Sept 7, the blue and green lines were moving at different frequencies. Based on past experience, I thought the red line would most likely move in the middle, with a low chance of following the green line down. But surprise! After BTC bounced for a day on Aug 22, it actually went straight down along the “worst-case scenario”—as the saying goes: before Sept 7, the red line followed the green line all the way down... The lowest point was at MVRV = 1.93, which mapped to BTC at $101,000. We’re not at $101,000 yet, but honestly, that’s not the point. What matters is, my mystical indicator now says that in a few days, the blue and green lines will start moving up in sync. If the red line joins in, then the market reversal should happen around 9/7 to 9/9. The jobs data drops on 9/5, and 9/6-9/7 is the weekend when US stocks are closed. The real market reaction will happen on Monday, from the night of 9/8 to early 9/9. That lines up perfectly with the mystical indicator’s timing—maybe there really is something written in the stars? Also, this upward blue-green trend should last until around 9/29, possibly extending to 10/30 above the yellow dashed line (MVRV: 2.42). Simply put, during this period, the blue and green lines will be higher than the current red line, so theoretically, the red line can keep trending up until 10/30 at the latest. If the red line goes the other way (down), that would be the second time this mystical indicator failed since March this year. In the end, we’ll just have to wait and see. ------------------------------------------------- This thread was born out of constant requests from you guys. Initially, I just wanted to write one sentence: Mysticism tells us a big move is coming... But I figured if I didn’t explain, there’d be even more questions, so here I am rambling away. For those who only care about the conclusion, sorry for messing up your reading experience again. One last reminder: don’t ever use mysticism as your only basis for judgment—it really is pretty “mystical.” 👇 👇 ‼️ My posts are for learning and discussion only, not financial advice! ‼️ ------------------------------------------------- Sponsored by #Bitget | @Bitget_zh
This article is machine translated
Show original

Murphy
@Murphychen888
08-21
知道小伙伴这段时间很煎熬,所以昨晚我夜观星象窥得天机...... x.com/Murphychen888/…
Sector:
From Twitter
Disclaimer: The content above is only the author's opinion which does not represent any position of Followin, and is not intended as, and shall not be understood or construed as, investment advice from Followin.
Like
Add to Favorites
Comments
Share
Relevant content


