

This report is written by Tiger Research and forecasts Bitcoin at $200,000 for Q4 2025. Institutions keep buying through volatility, the Fed cuts rates, and the October crash confirmed institutions now dominate the market.
Key Takeaways
Institutions keep accumulating through volatility - Q3 ETF net inflows maintained, MSTR adds 388 BTC in October alone confirming long-term investment conviction
Overheating but not extreme - MVRV-Z at 2.31 shows elevated but not extreme valuations, leverage flush-out clears short-term traders and creates room for next leg higher
Global liquidity environment stays favorable - M2 money supply breaks through $96 trillion hitting historic highs, Fed implements rate cut with 1-2 additional cuts expected this year
Institutions Buy Through U.S.-China Trade Uncertainty
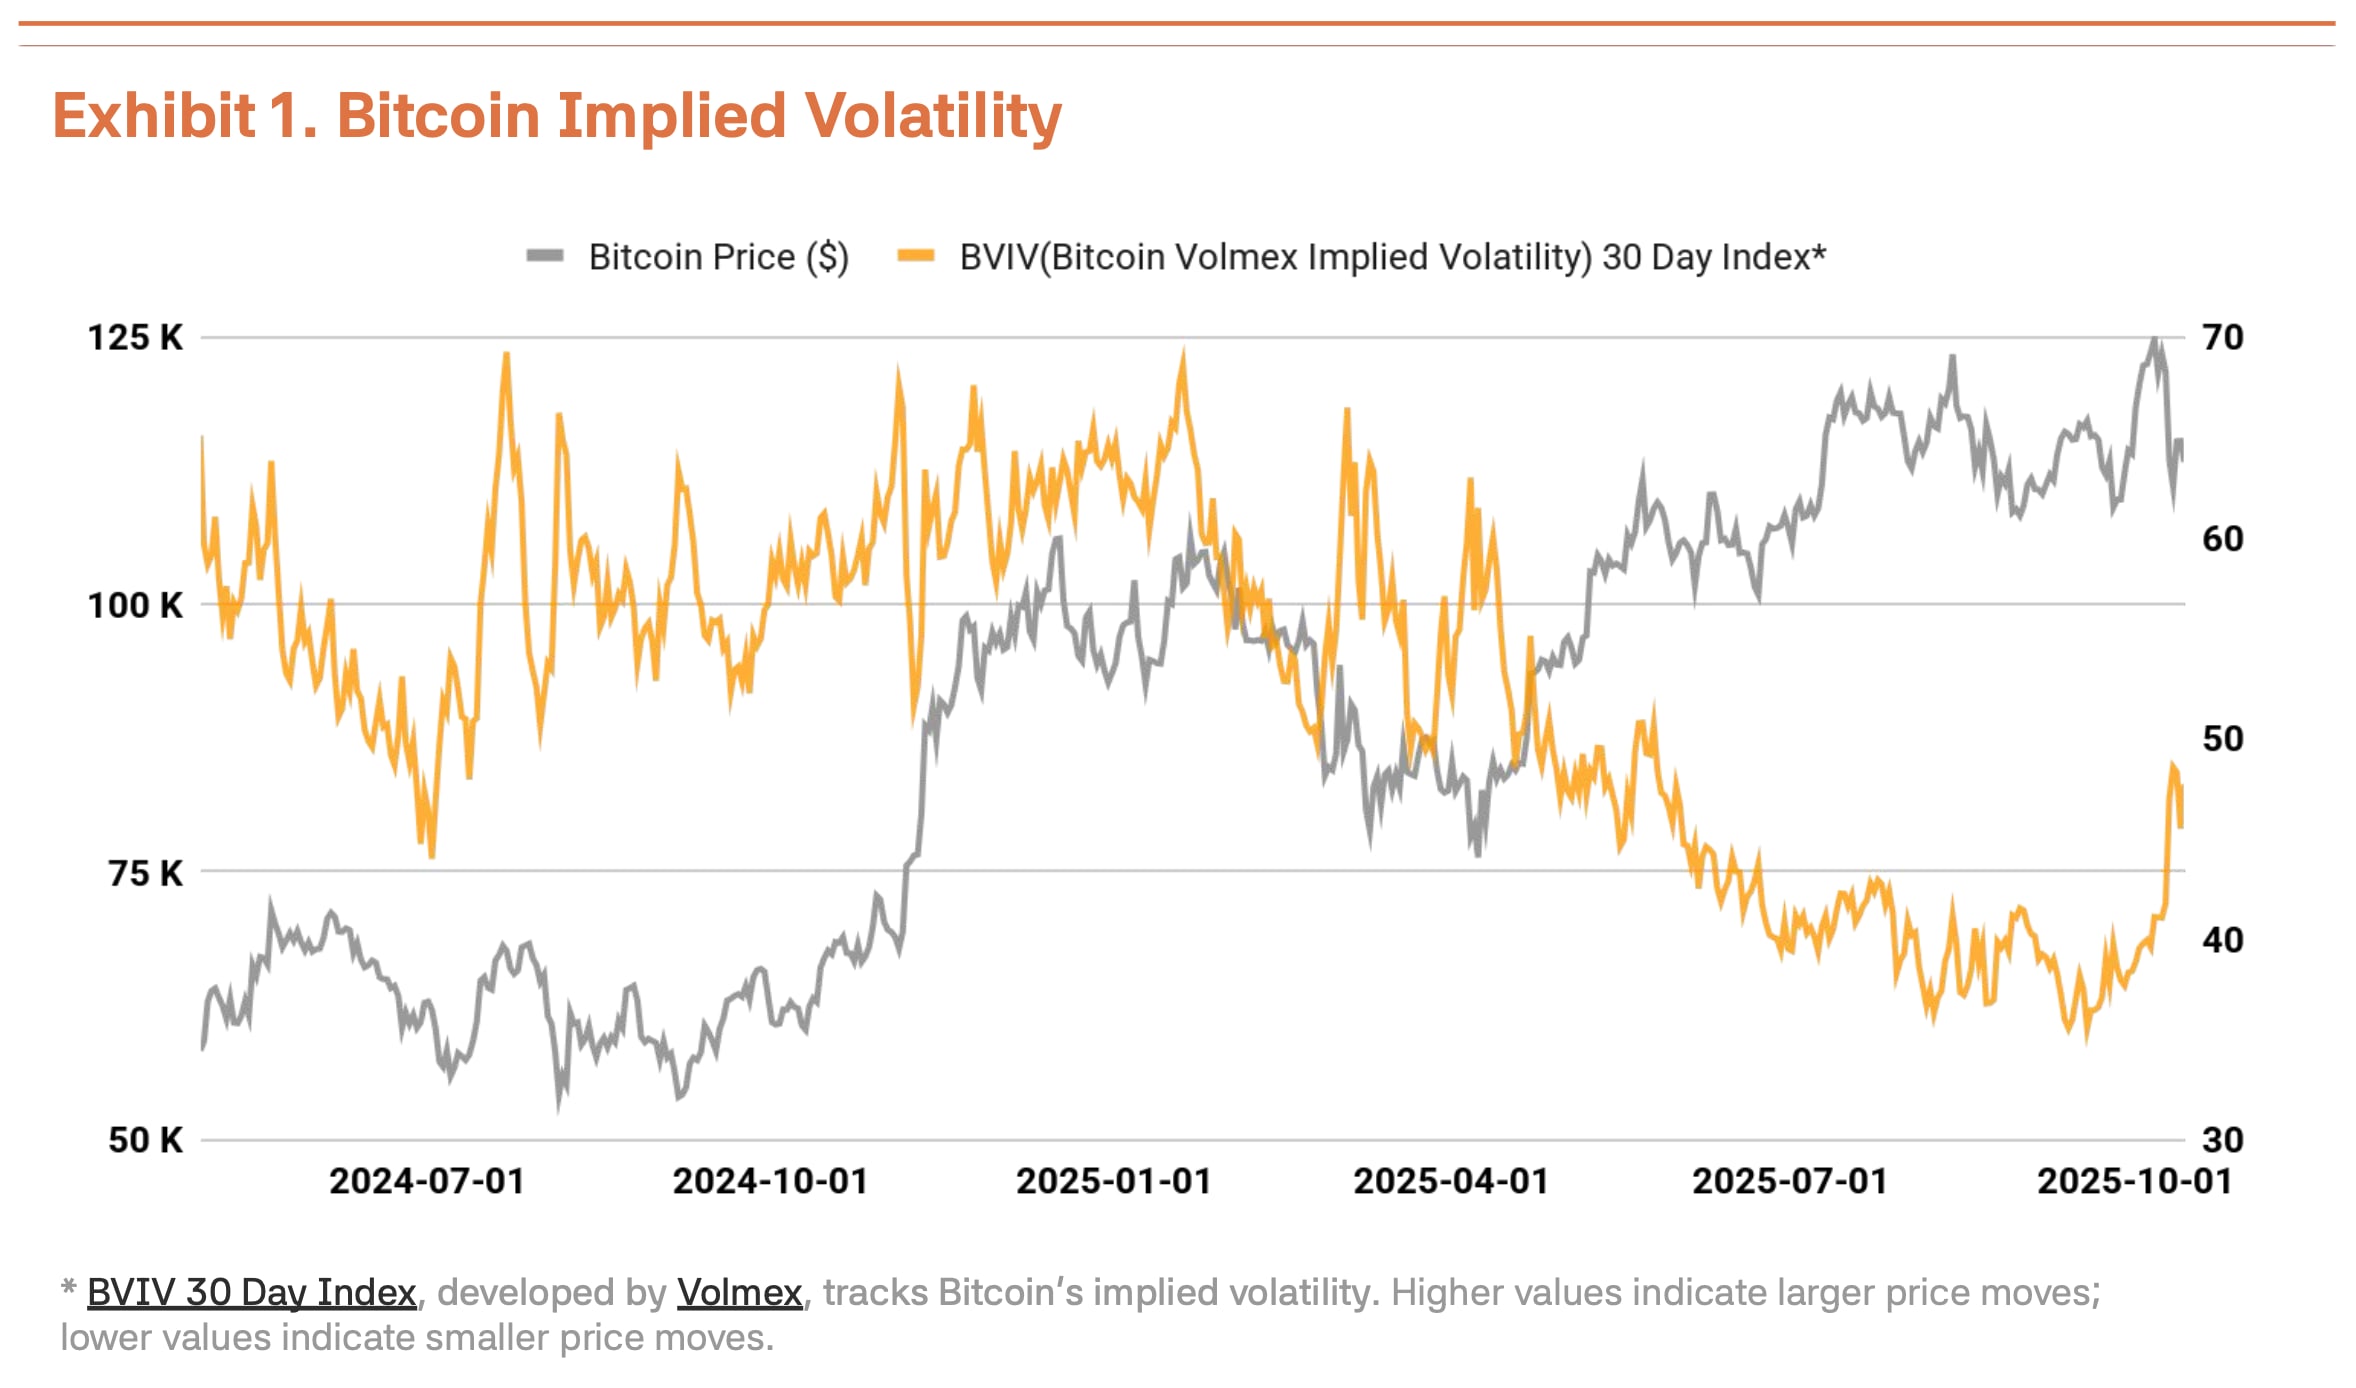
Bitcoin’s Q3 2025 market saw Q2’s powerful momentum (+28% QoQ) slow into a volatile sideways phase (+1% QoQ). Bitcoin hit an all-time high of $126,210 on October 6, but the Trump administration’s renewed China trade pressure triggered an 18% correction to $104,000, showing significant volatility. According to Volmex Finance’s Bitcoin Volatility Index (BVIV), volatility compressed from March through September as institutions accumulated steadily, then spiked 41% after September, amplifying market uncertainty (Exhibit 1).
This correction looks temporary, driven by resurfacing U.S.-China trade conflicts and President Trump’s tough rhetoric. Strategic accumulation by institutions led by Strategy Inc. (MSTR) actually accelerates. The macro environment helps too. Global M2 money supply broke through $96 trillion to historic highs, while the Fed cut rates 25bp on September 17 to 4.00%-4.25%. The Fed signals 1-2 more cuts this year, and stable labor markets plus economic recovery create favorable conditions for risk assets.
Institutional money flows stayed robust. Q3 Bitcoin spot ETF net inflows reached $7.8 billion. Though down from Q2’s $12.4 billion, maintaining net inflows throughout Q3 confirms steady institutional buying. This momentum carried into Q4—October’s first week alone recorded $3.2 billion, marking 2025’s largest weekly inflow. This shows institutions using price corrections as strategic entry opportunities. Strategy Inc. (MSTR) kept buying despite market corrections, adding 220 BTC on October 13 and 168 BTC on October 20, accumulating 388 BTC within a week. This demonstrates institutions’ firm belief in long-term value regardless of short-term volatility.
Dive deep into Asia's Web3 market with Tiger Research. Be among the 18,000+ pioneers who receive exclusive market insights.
On-Chain Data Signal Overheating, Fundamentals Unchanged
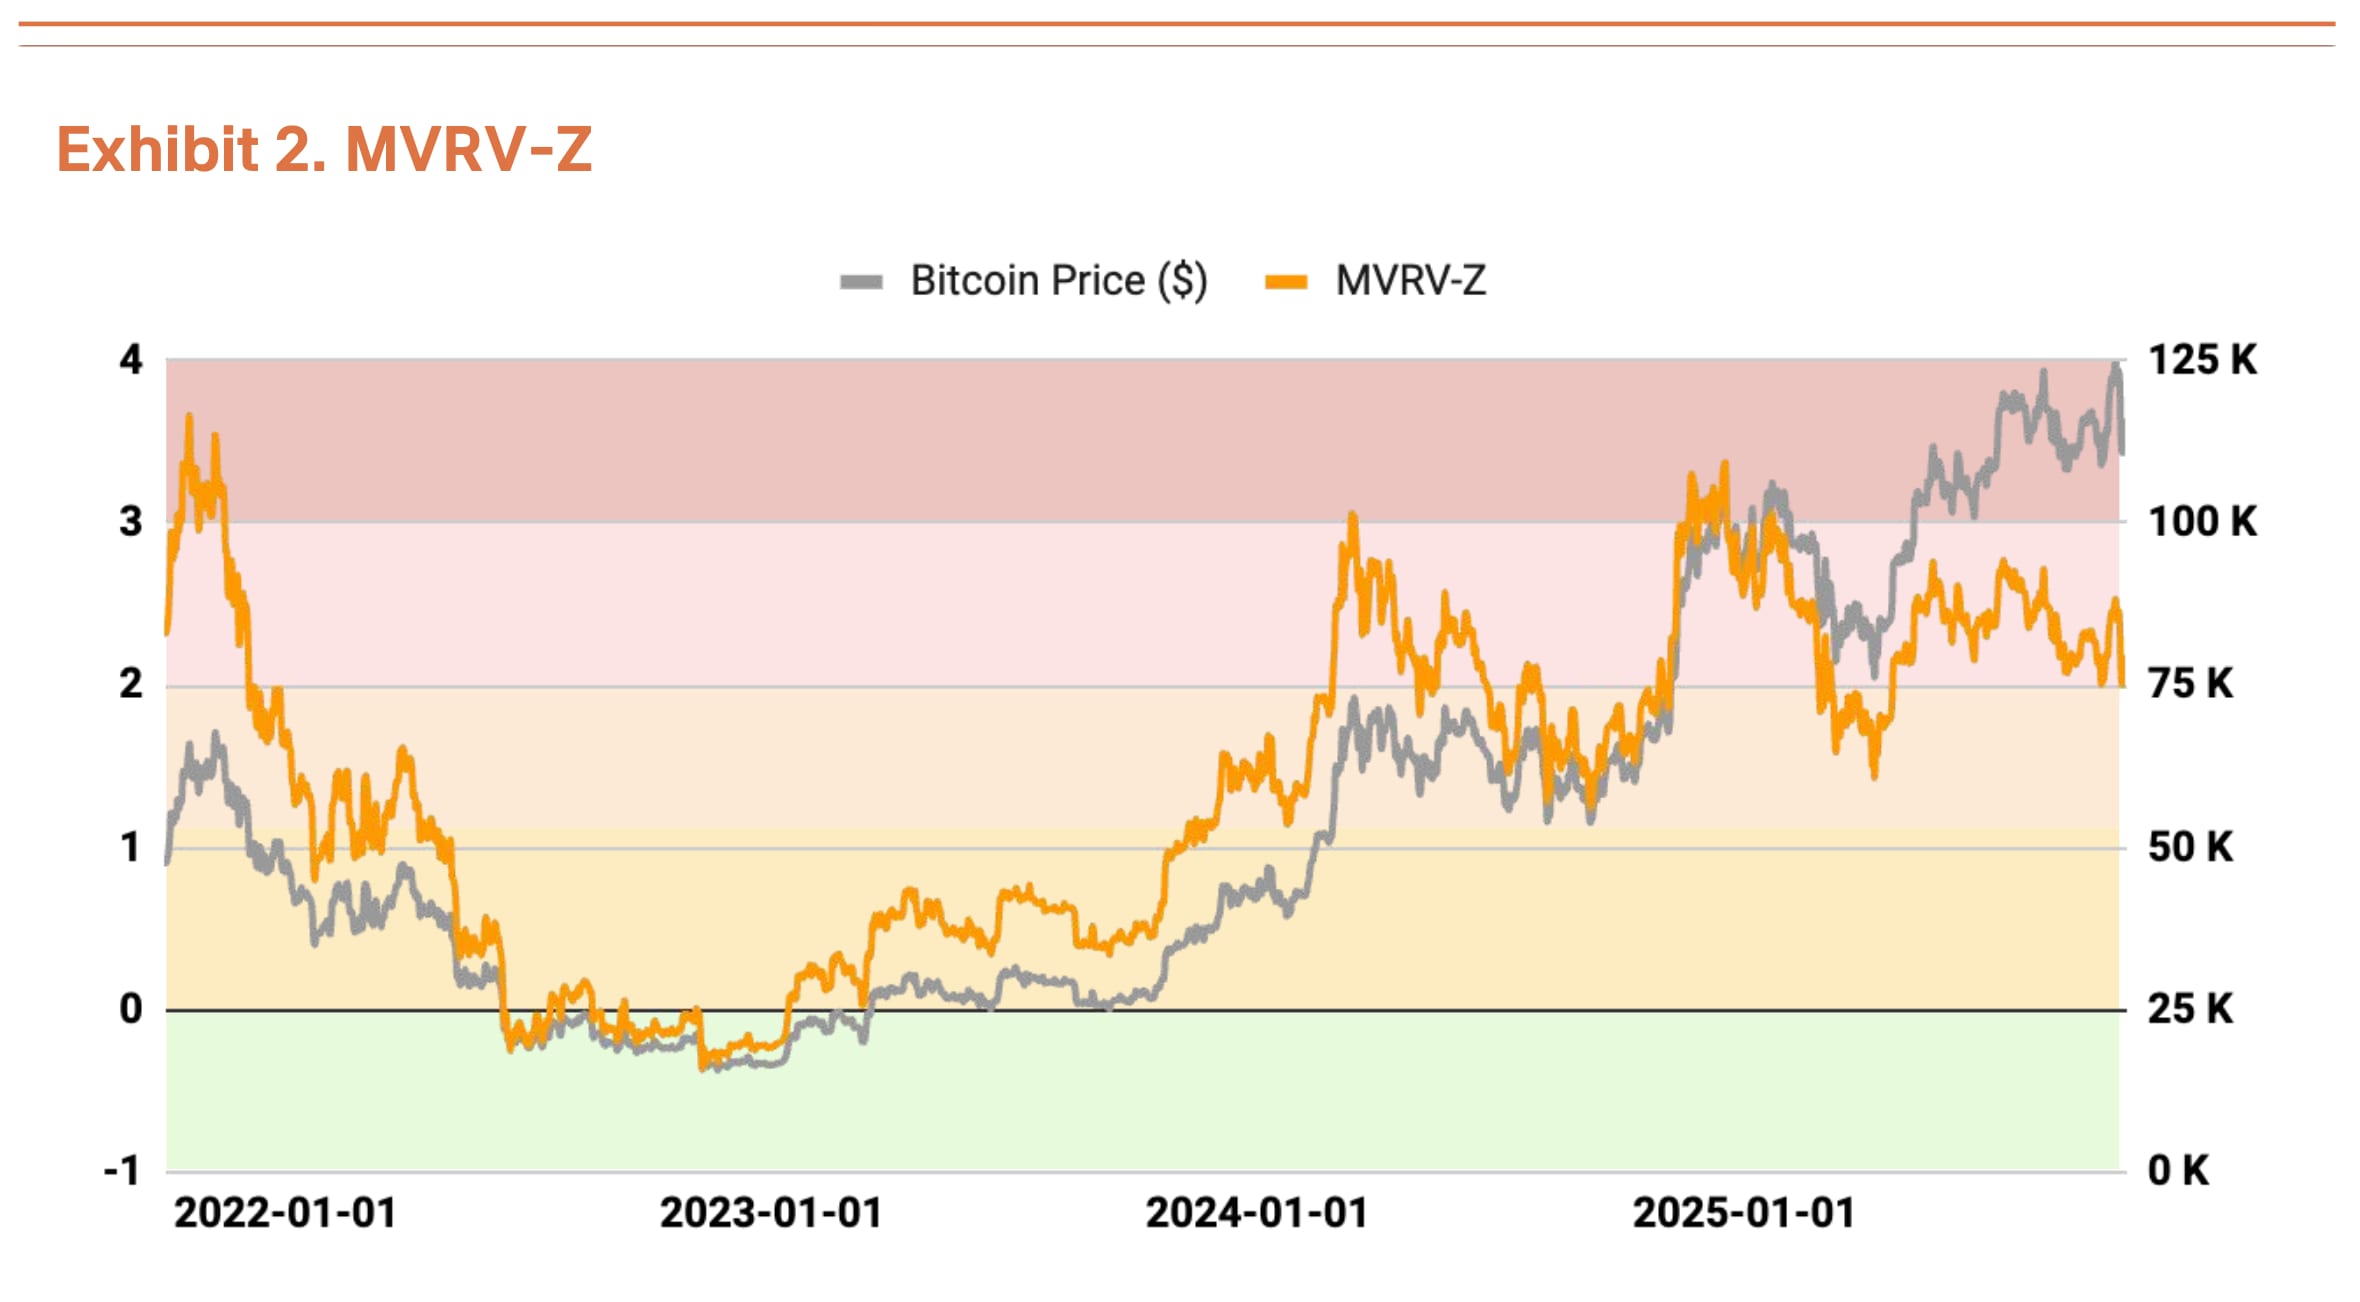
On-chain analysis reveals some overheating signs, though valuations aren’t concerning yet. The MVRV-Z indicator (Market Value to Realized Value ratio) sits at 2.31 in overheated territory, but has stabilized versus the extreme valuation zones approached in July-August (Exhibit 2).
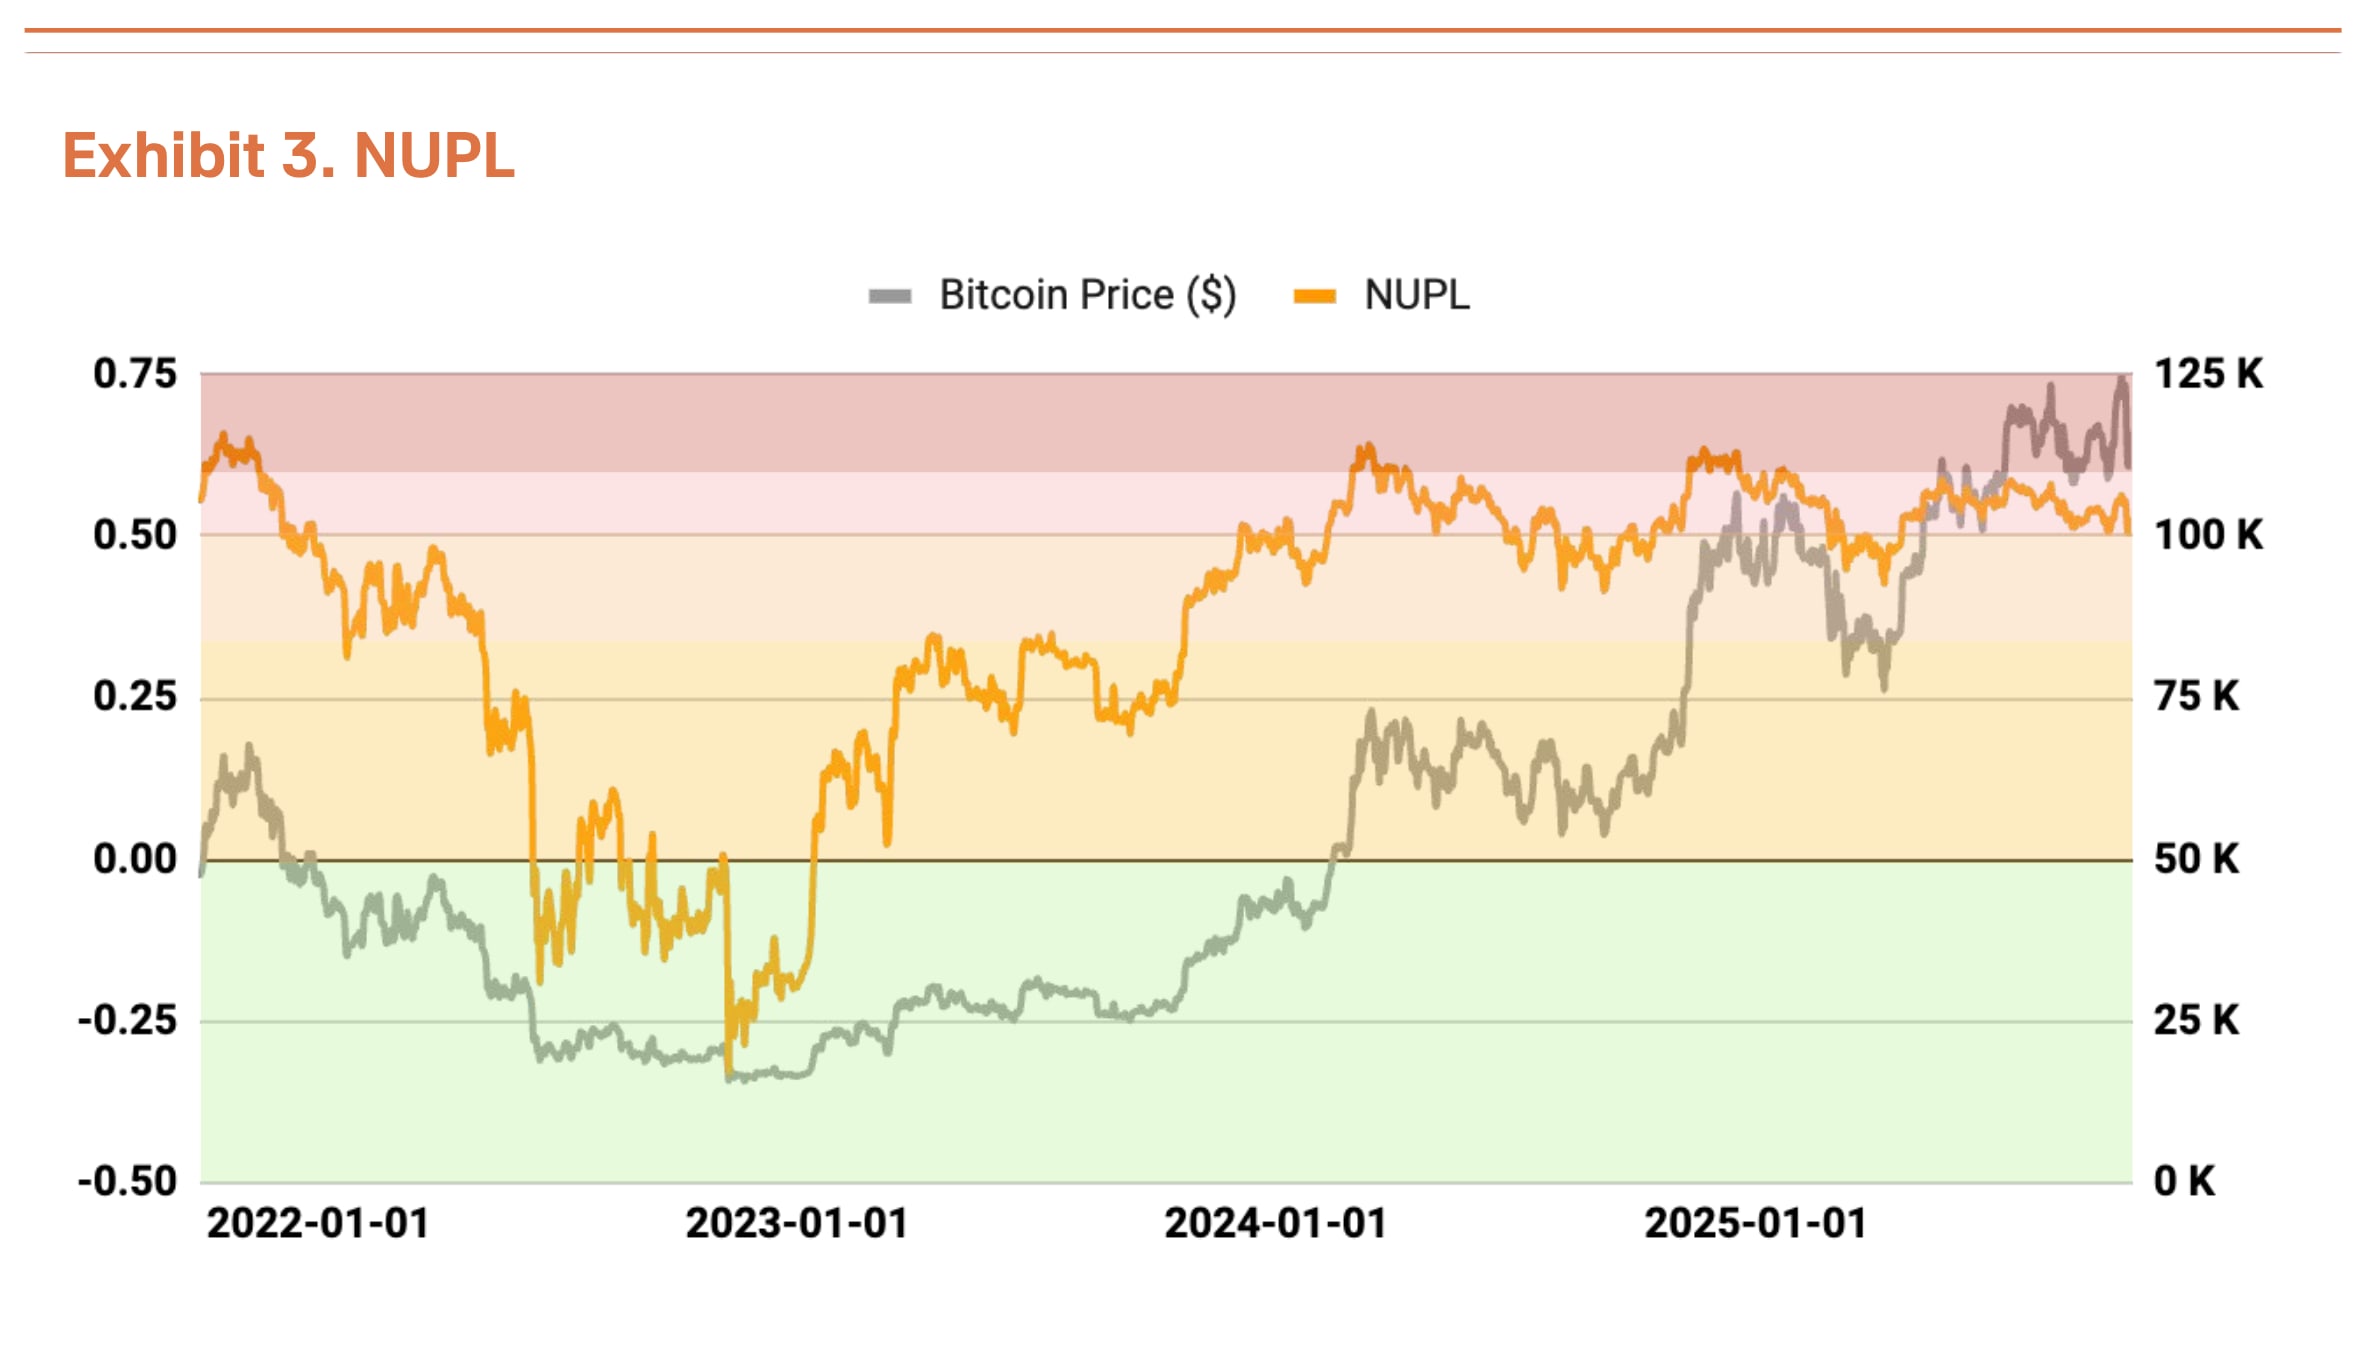
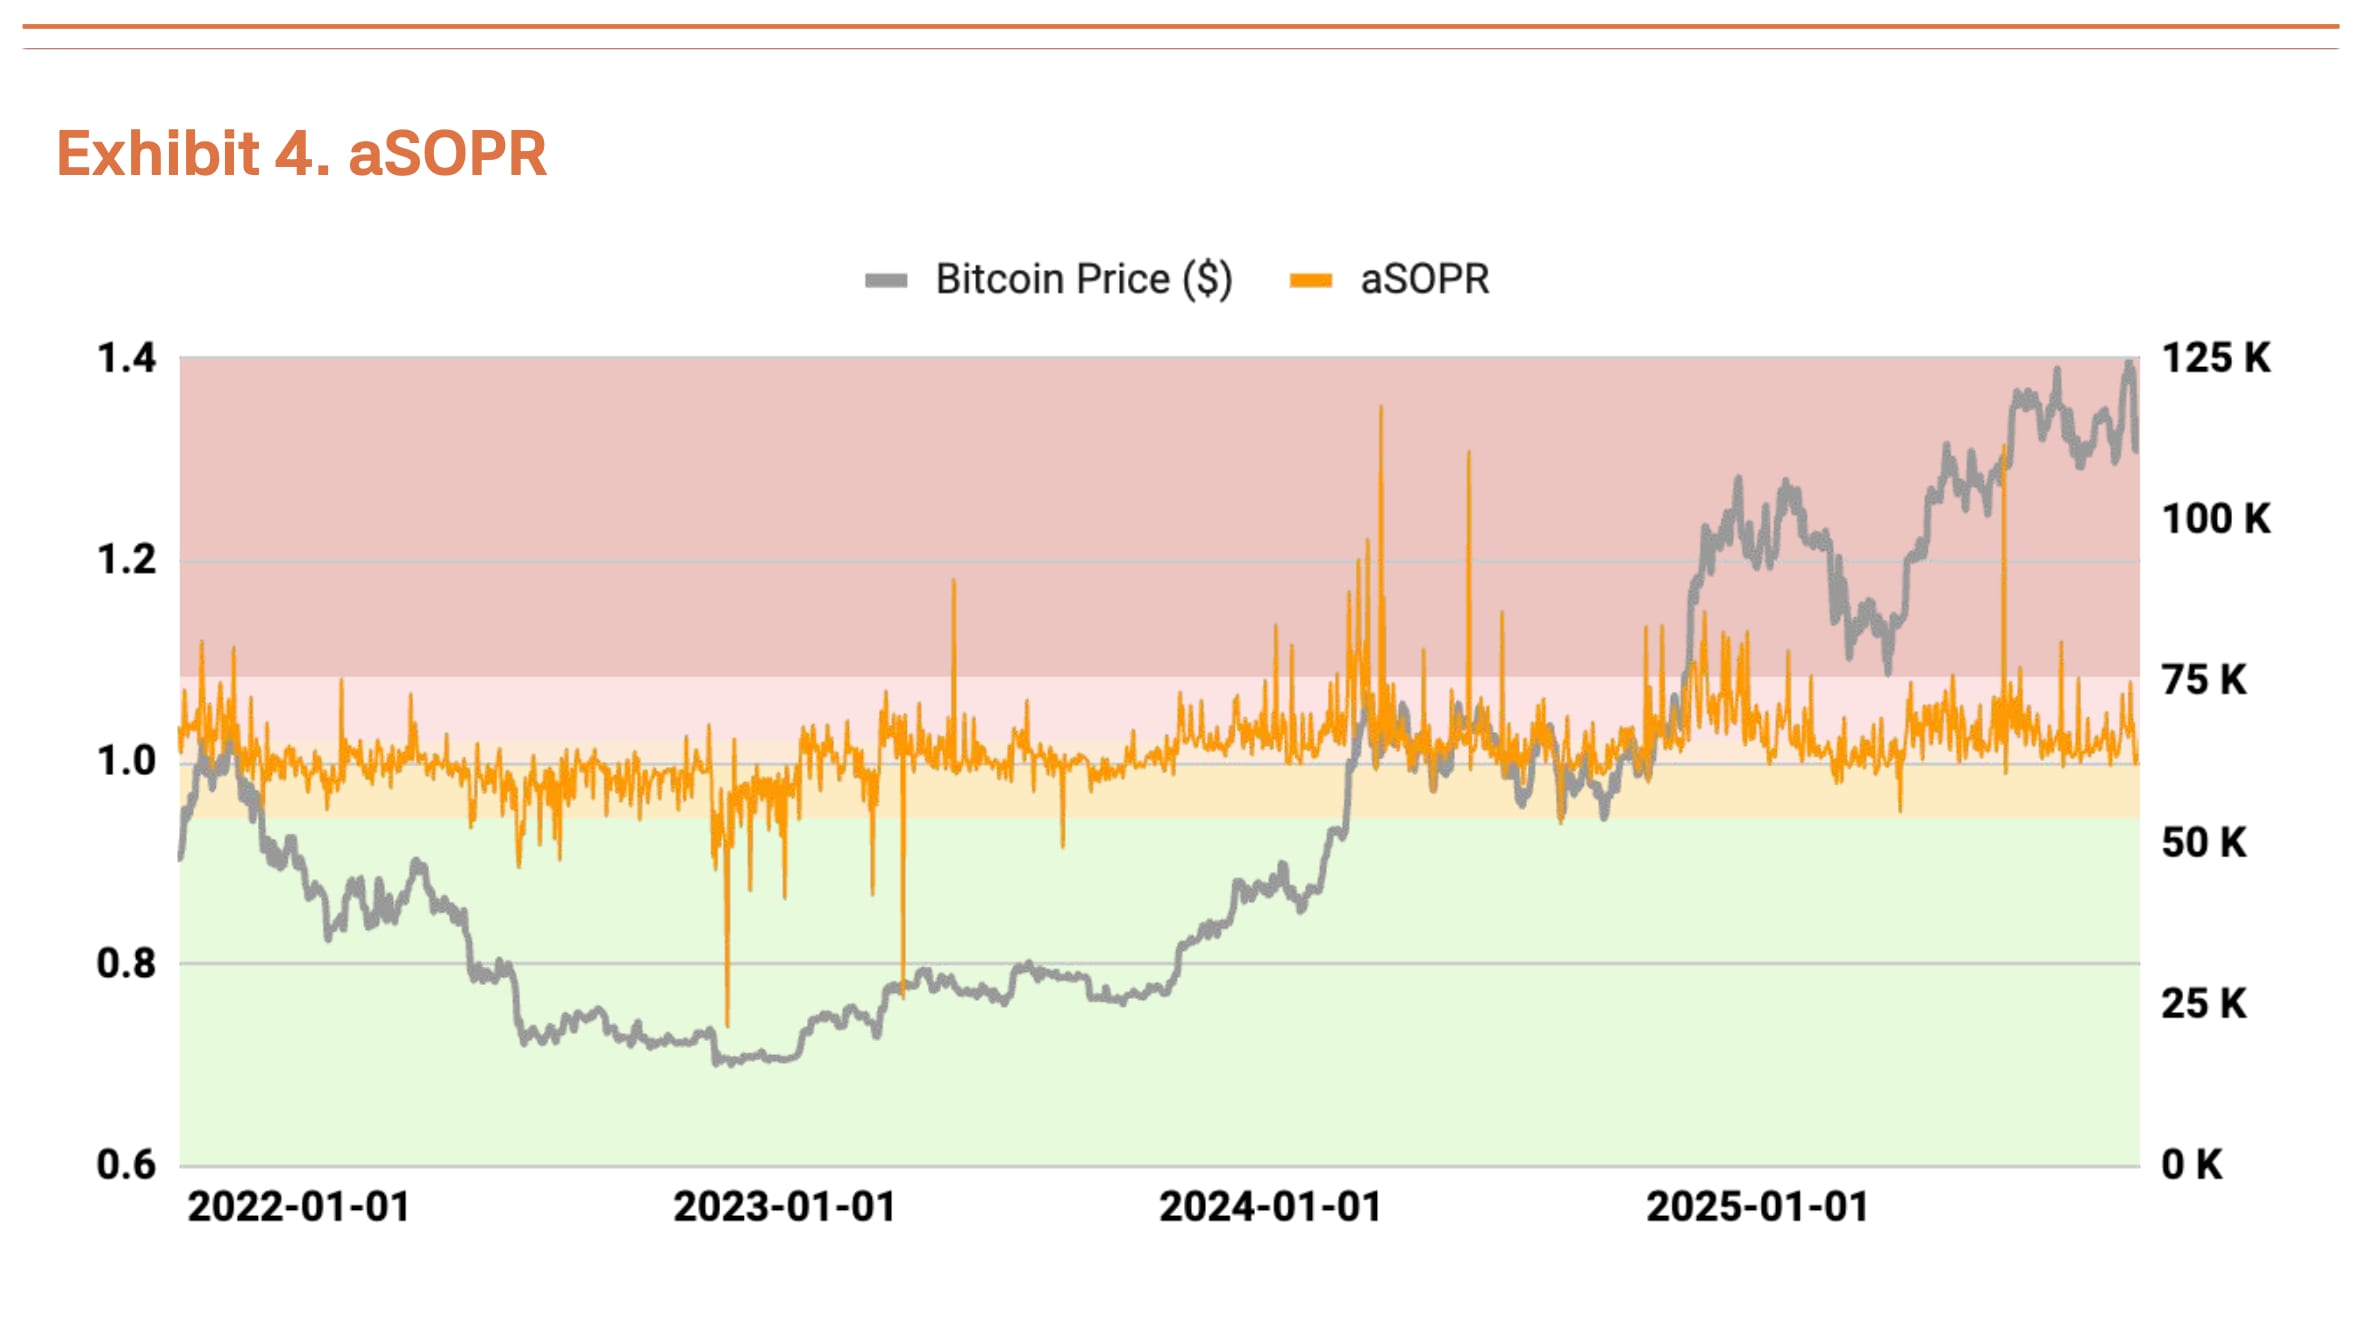
NUPL (Net Unrealized Profit/Loss ratio) also shows overheating territory, though moderated from Q2’s high unrealized profit situation (Exhibit 3). The aSOPR (adjusted Spent Output Profit Ratio), showing investors’ realized profit/loss, stays very close to equilibrium at 1.03, indicating no cause for concern (Exhibit 4).
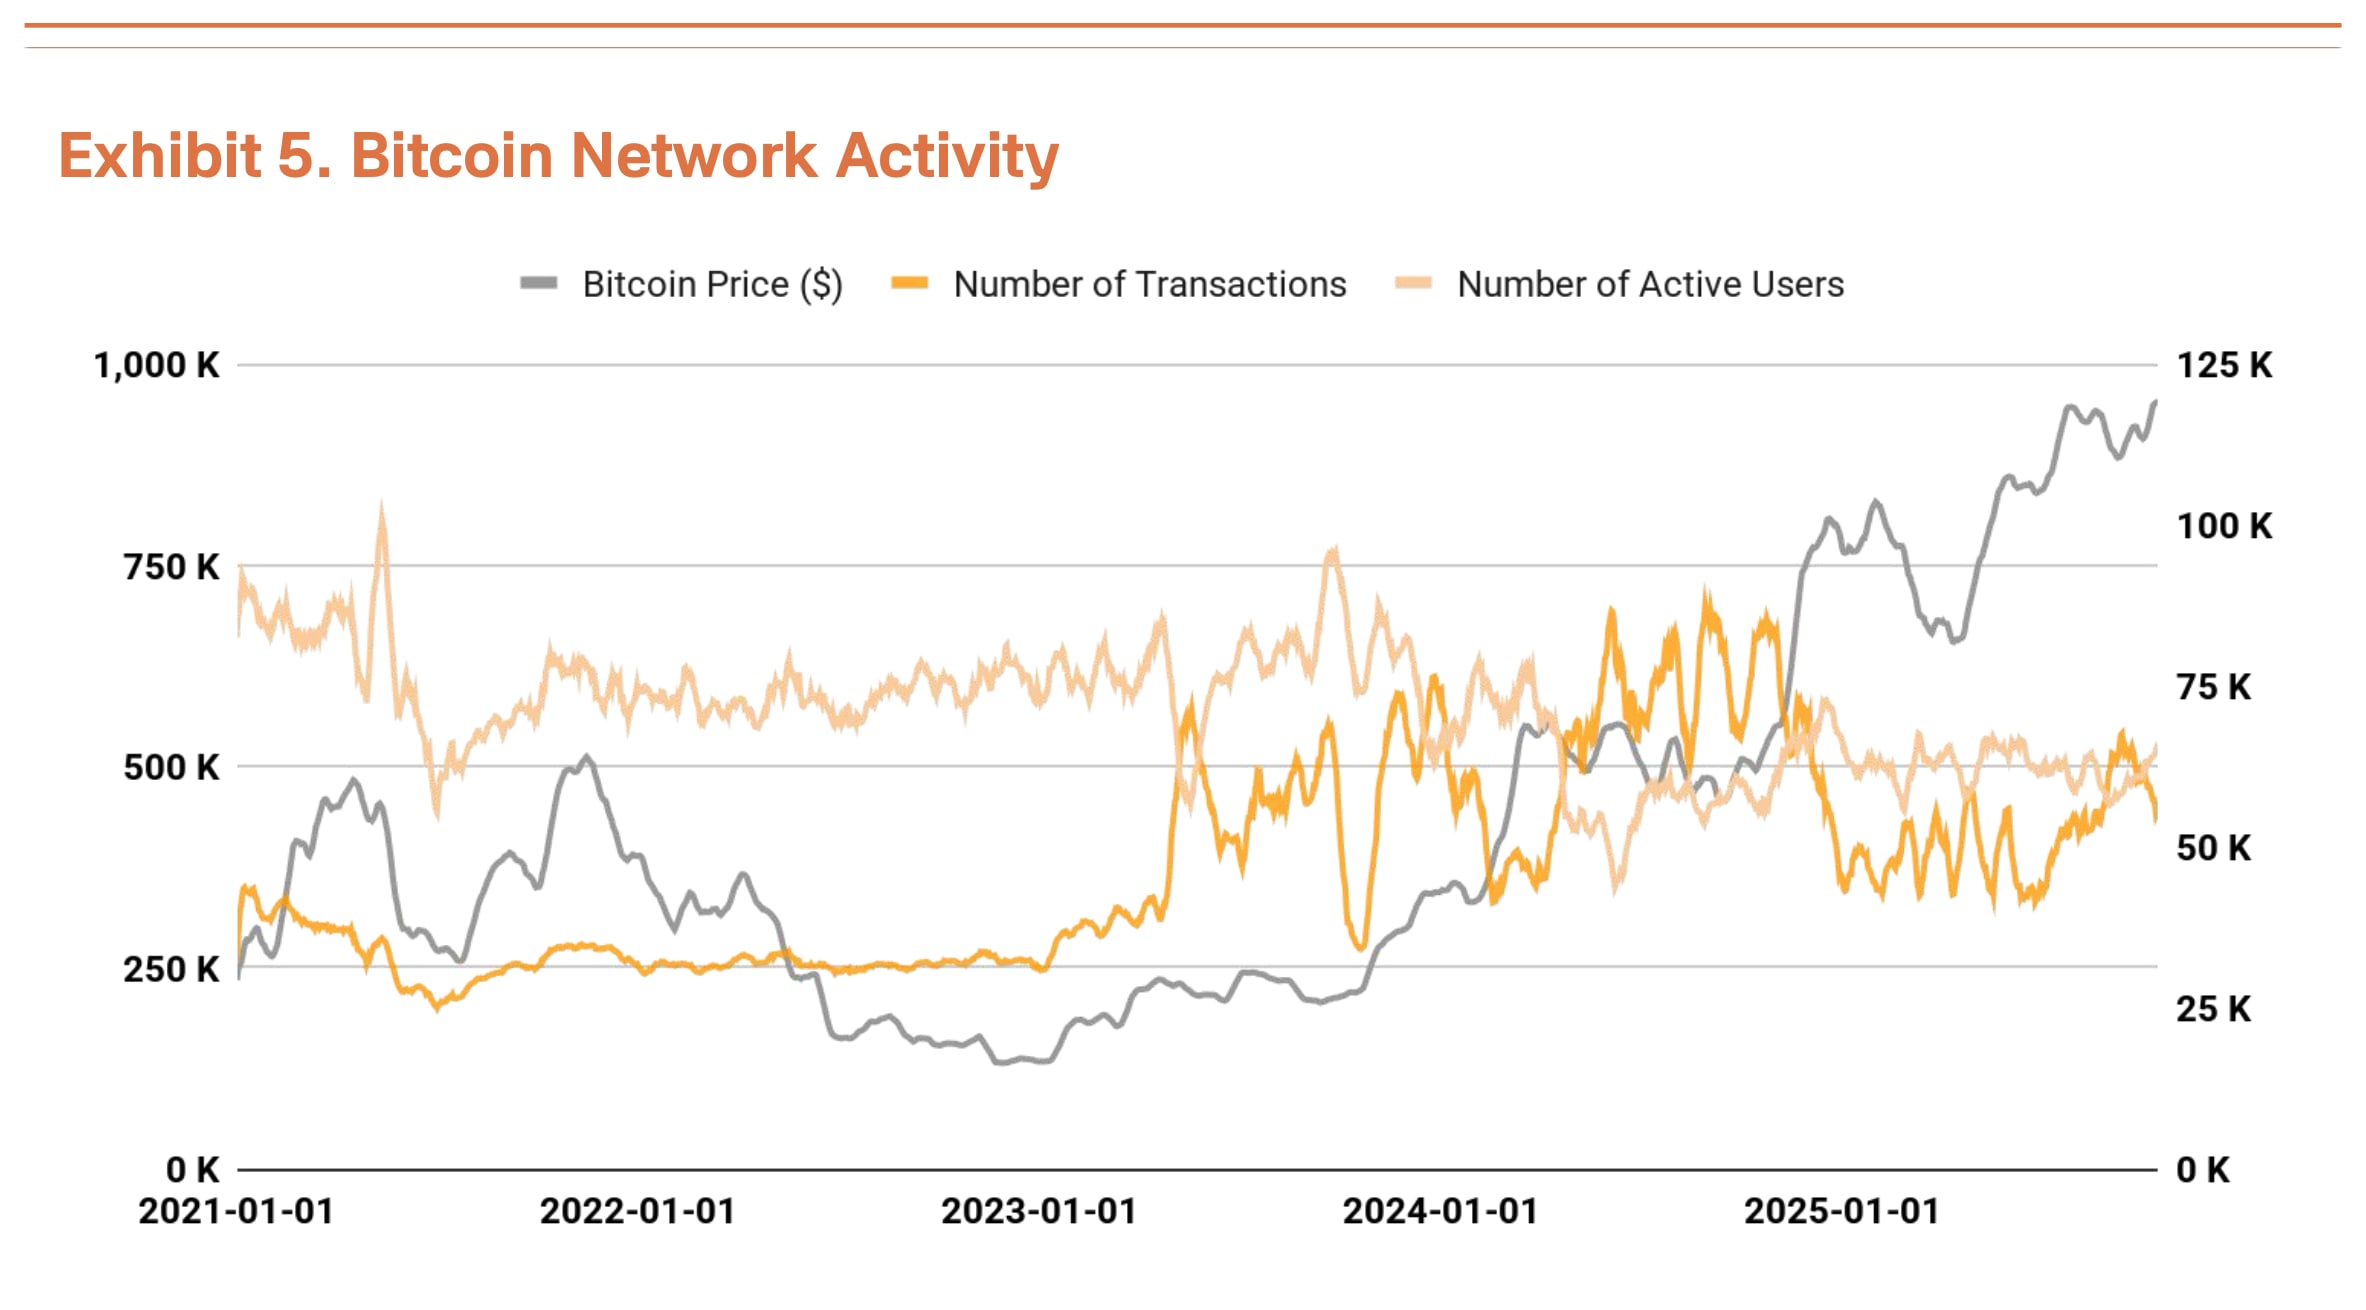
Bitcoin’s transaction count and active users maintained similar levels to last quarter, suggesting network growth momentum has temporarily slowed (Exhibit 5). Meanwhile, total transaction volume turned upward. Fewer transactions but higher volume means larger amounts move in fewer transactions, signaling increased large-scale capital movements.
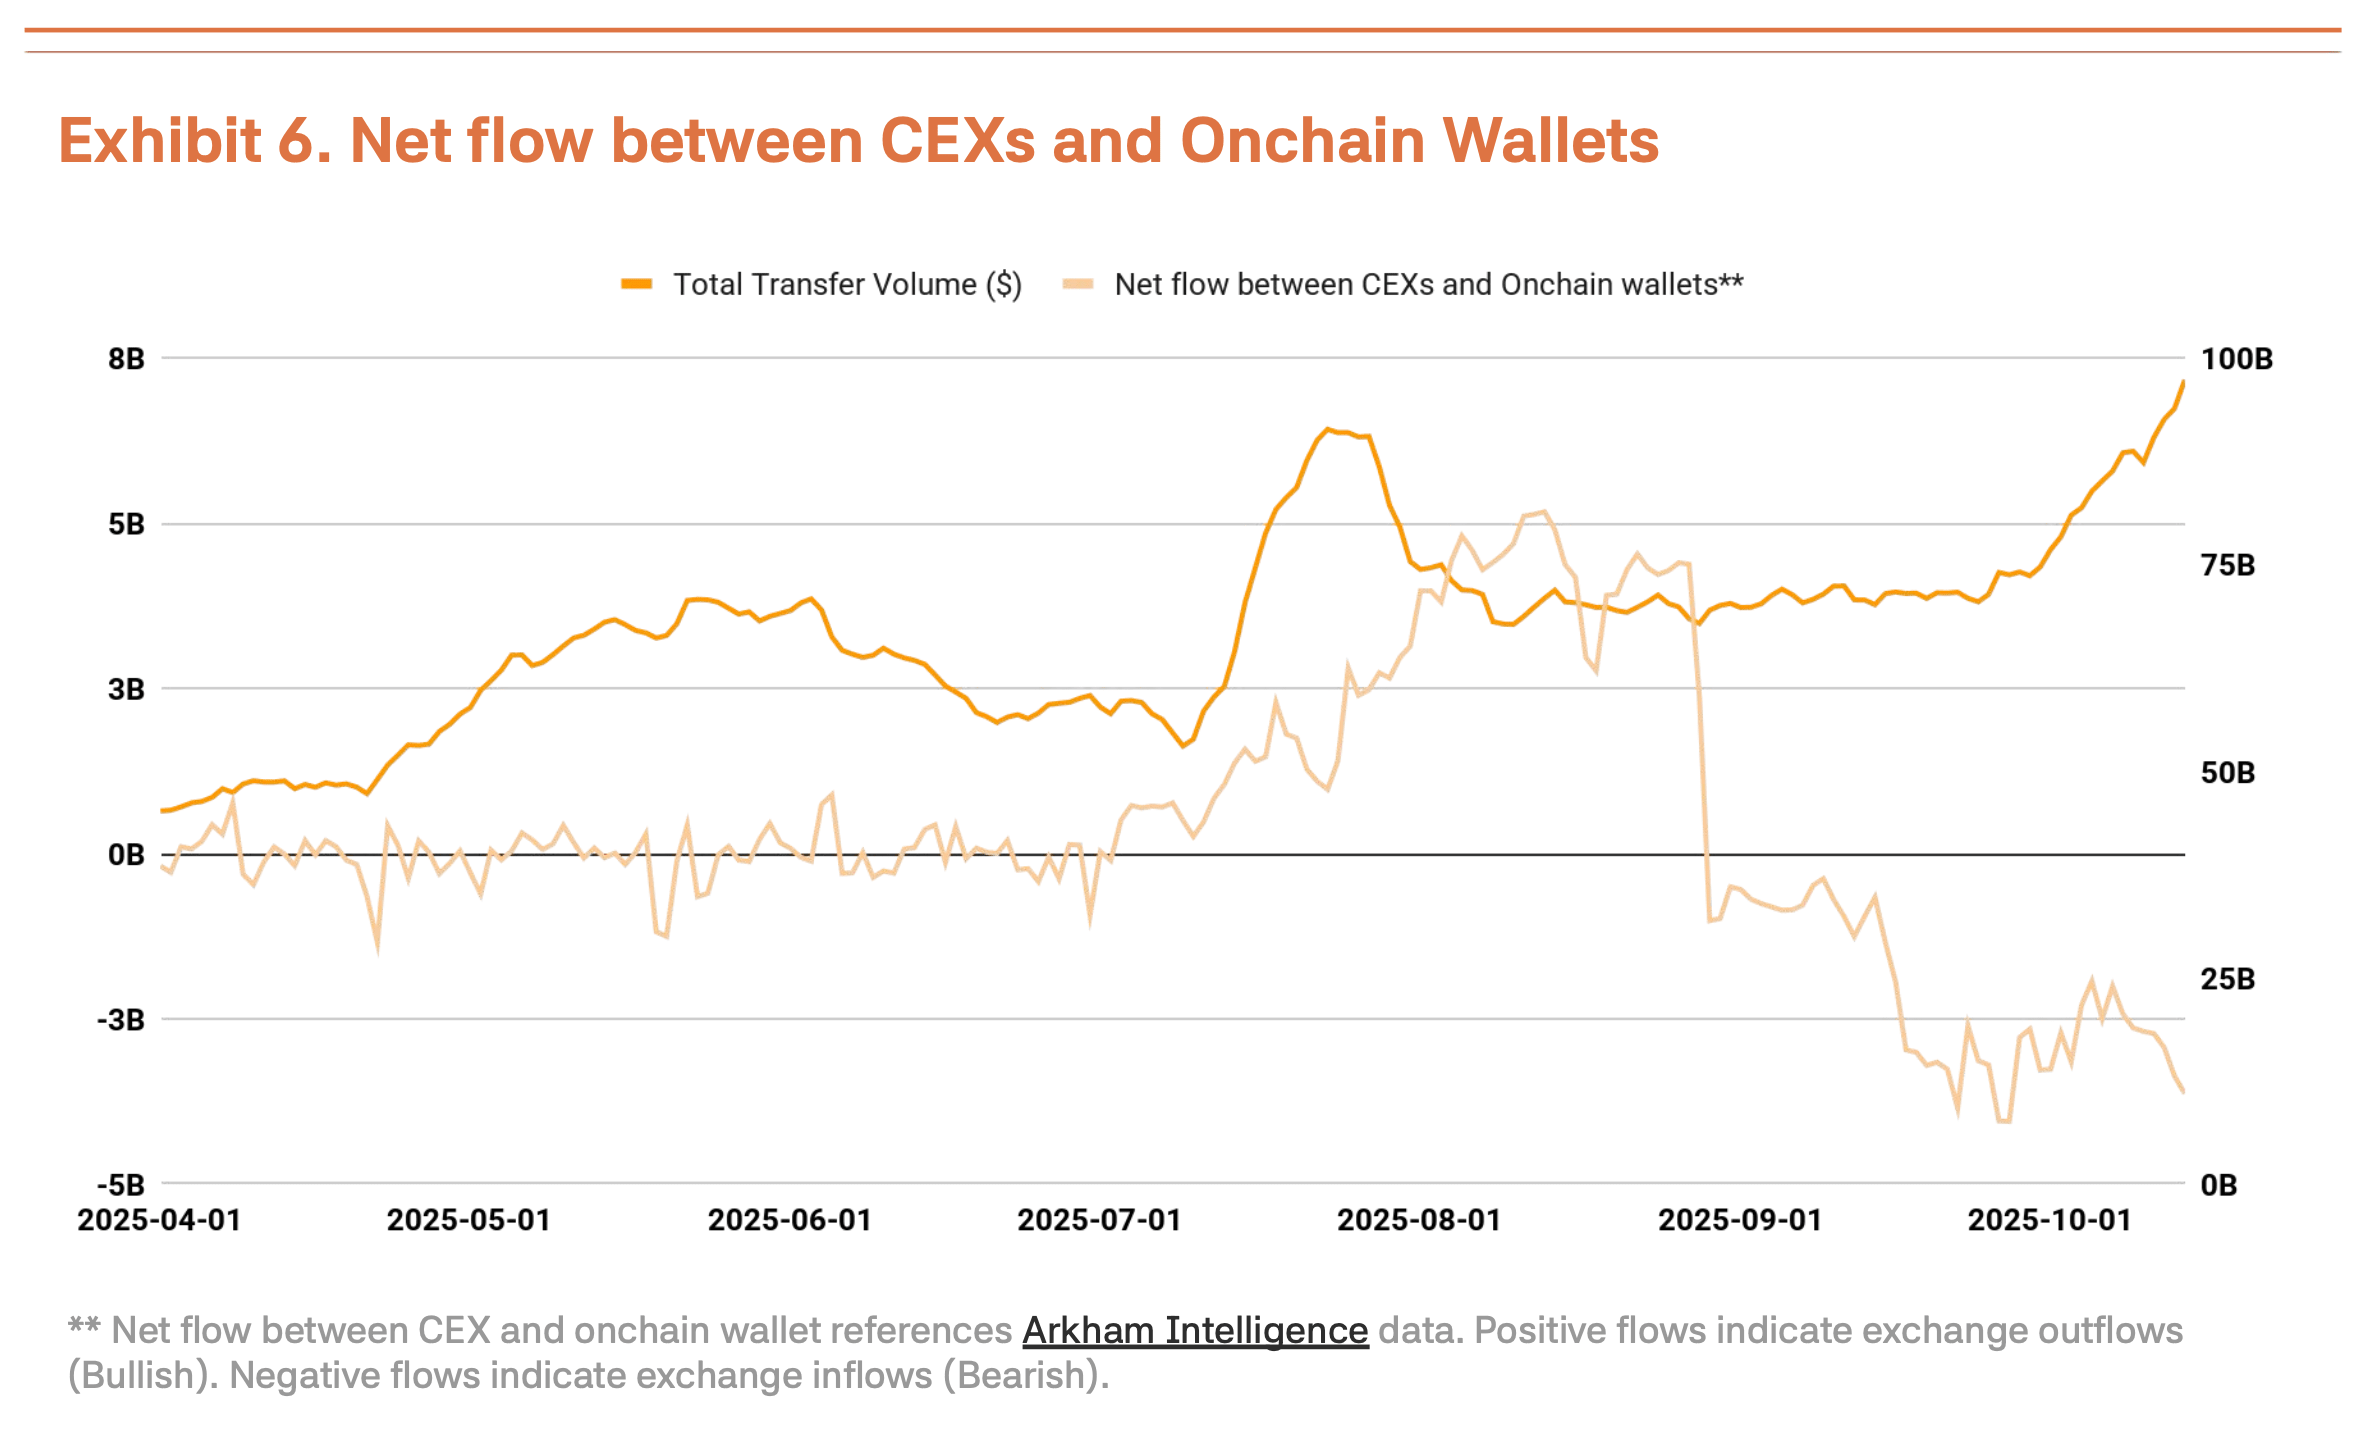
However, we can’t interpret this transaction volume expansion purely positively. Money flowing into centralized exchanges has increased recently, typically signaling holders preparing to sell (Exhibit 6). Without improvement in fundamental indicators (transaction count, active users), rising transaction volume alone suggests short-term capital movements and selling pressure amid high volatility rather than real demand expansion.
October 10 Crash Proves Institutional Market Shift
The October 10 crash on centralized exchanges (14% drop) proved Bitcoin’s market has structurally shifted from retail to institutional dominance.
The key point: markets reacted completely differently than before. In similar late-2021 conditions, the retail-dominated market saw fear spread with immediate collapse following. This time, corrections stayed limited. Institutions kept buying right after the cascade liquidation, proving institutional investors firmly defend the downside. Plus, institutions seem to view this as healthy consolidation that clears overheated speculative demand.
Short-term, cascade liquidations lower retail investors’ average entry price and increase psychological pressure, potentially expanding volatility through weakened sentiment. But if institutions keep entering during this sideways market, this correction likely forms the foundation for the next move up.
Target Price Raised to $200,000
Q3 analysis using our TVM methodology yields a neutral base price of $154,000, up 14% from Q2’s $135,000. Here we apply a -2% fundamental adjustment and +35% macro adjustment, producing a $200,000 target price.
The -2% fundamental adjustment reflects temporary network activity slowdown and increased centralized exchange deposits showing short-term weakness. The macro adjustment stays at 35%. Global liquidity expansion and institutional inflows continue, and the Fed’s rate-cutting stance provides powerful catalysts for Q4 gains.
Near-term corrections may occur from overheating signs, but these represent healthy consolidation rather than trend or perception shifts. The base price keeps rising, showing Bitcoin’s intrinsic value steadily increases. Despite temporary weakness, medium to long-term upside prospects remain intact.
Dive deep into Asia's Web3 market with Tiger Research. Be among the 18,000+ pioneers who receive exclusive market insights.
🐯 More from Tiger Research
Read more reports related to this research.Disclaimer
The Bitcoin valuation methodology presented in this document (hereinafter referred to as the “Methodology”) is intended solely for educational and academic research purposes. It does not constitute investment advice, a solicitation to buy or sell, or a recommendation to engage in any form of trading activity. The fair prices derived from this Methodology are theoretical outputs based on objective data and mathematical models. They should not be interpreted as guidance or endorsement for any specific investment action, including buying, selling, or holding Bitcoin.
This Methodology is designed as a research framework to offer one perspective on Bitcoin valuation. It is not intended to be used as the basis for actual investment decisions. The Methodology has been carefully reviewed to ensure it does not constitute any form of market manipulation, fraudulent trading, or other unfair trading practices as defined under Article 10 of the “Act on the Protection of Virtual Asset Users” (the “Virtual Asset User Protection Act”). All analysis uses only publicly available information, including on-chain blockchain data and officially released economic indicators. No material non-public or insider information has been used. All valuation outputs, including target prices, are based on reasonable assumptions and presented without misrepresentation or omission of material facts.
The authors and distributors of this Methodology fully comply with the conflict of interest disclosure requirements set forth in Article 10, Paragraph 4, Item 2 of the Virtual Asset User Protection Act. If the authors hold or intend to trade the relevant virtual asset (Bitcoin) at the time of writing or distribution, such interests will be transparently disclosed.
The indicators used in this Methodology—such as Base Price, Fundamental Indicator, and Macro Indicator—are derived from approaches the authors consider reasonable. However, they do not represent absolute truths or definitive answers. The Bitcoin market is highly volatile, operates 24/7, spans global jurisdictions, and is subject to significant regulatory uncertainty. As a result, there may be substantial and prolonged deviations between the valuation results of this Methodology and actual market prices.
This Methodology is based on historical data and information available at the time of writing. It does not guarantee or predict future performance. Past patterns or correlations may not persist, and unexpected market shocks, regulatory shifts, technical failures, or macroeconomic events could significantly undermine the predictive validity of this framework. Given the relatively short history and evolving nature of the crypto market, there are inherent limitations to the reliability of past data and its applicability to future projections.
All investment decisions should be made independently and under the investor’s sole responsibility. This Methodology should not serve as the sole or primary basis for any investment decision. Investors must carefully consider their financial situation, investment objectives, risk tolerance, and experience, and should seek independent financial or investment advice as needed. The authors, distributors, and any related parties bear no responsibility for any direct, indirect, consequential, special, or punitive losses or damages arising from investment decisions made with reference to this Methodology.
Terms of Usage
Tiger Research allows the fair use of its reports. ‘Fair use’ is a principle that broadly permits the use of specific content for public interest purposes, as long as it doesn't harm the commercial value of the material. If the use aligns with the purpose of fair use, the reports can be utilized without prior permission. However, when citing Tiger Research's reports, it is mandatory to 1) clearly state 'Tiger Research' as the source, 2) include the Tiger Research logo. If the material is to be restructured and published, separate negotiations are required. Unauthorized use of the reports may result in legal action.


