


Get the best data-driven crypto insights and analysis every week:
Scaling For the Next Wave of Demand: Ethereum, Solana and Beyond
Thanks for reading Coin Metrics State of the Network! Subscribe for free to receive new posts and support our work.
Key Takeaways:
Ethereum is progressively scaling across mainnet and Layer-2 rollups. From early NFT and DeFi congestion to recent market volatility, gas-limit increases and upgrades like Dencun and Pectra have expanded capacity, while blob transactions have sharply reduced data costs.
Layer-2s are helping distribute Ethereum’s growing demand and improve throughput efficiency. Events like the April 2024 “blobscriptions” surge and October 2025 liquidations highlight both their resilience under stress and their continued dependence on mainnet capacity.
Solana’s high-throughput design localizes congestion without reliance on external scaling layers. During the January 2025 TRUMP token launch, average fees rose to $0.37 while median fees stayed below $0.003, highlighting how local fee markets isolate congestion without raising network-wide costs.
New networks are emerging across the blockchain tradeoff space, specializing for targeted use cases as demand grows in volume and diversity.
Introduction
Periods of elevated onchain activity or network congestion, much like the traffic of rush hour that tests a city’s highways, reveal the importance of scalability as blockchains mature for broader adoption. Token launches, airdrops, and market volatility can all trigger bursts of demand that exceed capacity, driving up fees and exposing the limits of infrastructure.
From Ethereum’s Layer-2 rollup scaling and mainnet capacity increases to Solana’s integrated, high-throughput approach, blockchains are steadily maturing to meet rising activity. Past congestion events have served as valuable stress tests, revealing how networks are evolving and where challenges remain as adoption accelerates.
In this issue of Coin Metrics’ State of the Network, we explore how scalability is taking shape across Ethereum, its Layer-2 ecosystem, and Solana. By looking at transaction activity, fee dynamics, and network capacity, we assess how networks are adapting to growing demand and what that signals for the next phase of on-chain growth.
Ethereum Layer-1: The Main Road
Ethereum’s scaling journey reflects the challenge of growing transaction throughput and speed for mass adoption without sacrificing decentralization or security, a balance that remains central to its roadmap.
In its earlier years, users faced several instances where limited network capacity, combined with surging demand, drove up the cost of using the network and highlighted the need for scaling solutions. Ethereum’s capacity is defined by the block gas limit, which sets how much computation can fit into each block. Each transaction consumes gas based on its complexity, and users pay fees in ETH (denominated in Gwei) to have their transactions processed. When demand for transaction inclusion exceeds available blockspace, gas prices rise, reflecting competition for limited network capacity.
The chart below visualizes Ethereum’s gas price across four major congestion events, each illustrating how pricing dynamics evolved as the network scales:
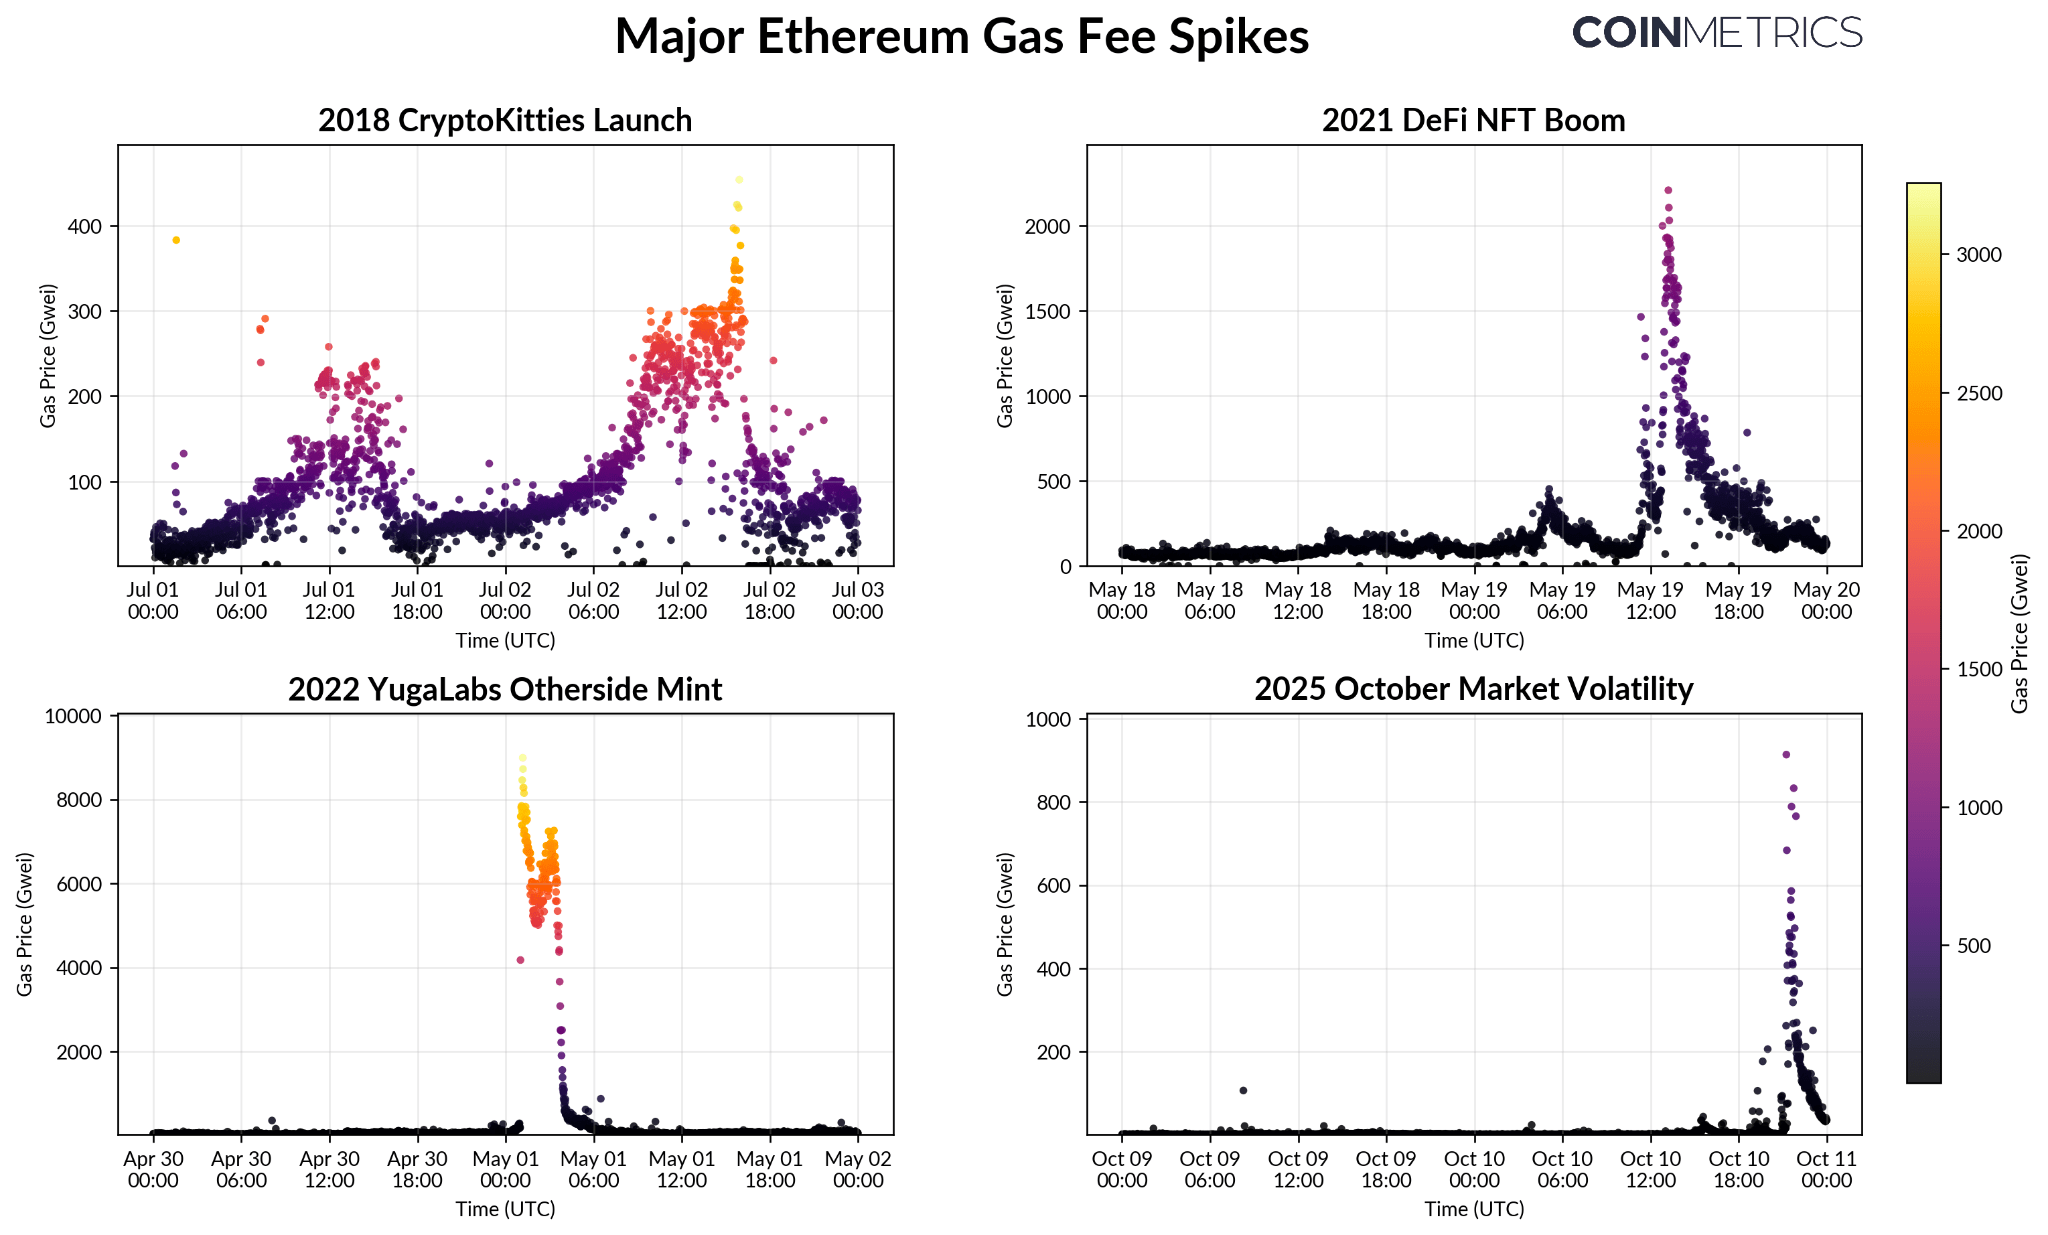
Source: Coin Metrics Network Data Pro
2018 CryptoKitties Launch: One of Ethereum’s first congestion shocks, when a single NFT game consumed a majority of available blockspace. Gas fees exceeded 450 Gwei (~$596 USD) as users competed for inclusion in blocks. Back then, fees were set by open auction, meaning in demand apps could crowd out the chain when demand surged.
2021 DeFi & NFT Boom: Explosive growth in DeFi and NFTs drove fees above 2,000 Gwei, revealing the limits of Ethereum’s fee market under more complex smart contract applications. This led to the introduction of EIP-1559, which replaced the auction system with a dynamic base fee that adjusts to demand and burns a portion of transaction costs to make pricing more predictable.
2022 Yuga Labs Otherside Mint: Despite EIP-1559, a highly anticipated “Otherside” metaverse land sale briefly sent gas above 8,000 Gwei, the highest on record. This showed that fee market reforms alone couldn’t absorb extreme surges. The event accelerated development of Layer-2 rollups and app-specific chains to offload activity from mainnet.
2025 October Market Liquidations: While spikes have also occurred on more recent occasions, such as the WLFI token launch and October 10th liquidations, they have been far more contained. Fees rarely exceeded 1,000 Gwei and normalized quickly, reflecting the impact of L2s, and ongoing Layer-1 capacity increases.
Together, these episodes show Ethereum’s progression in scalability. EIP-1559 improved fee efficiency, while Layer-2 rollups now absorb much of the activity once confined to mainnet. Meanwhile, incremental increases in block gas limits continue to expand the amount of computation per block, effectively widening Ethereum’s throughput “highway.”
Daily transactions on Ethereum have crossed 1.8M in 2025, while average transaction fees are at multi-year lows. As shown below, the gas limit was recently raised to 45 million, with plans to reach 100 million and beyond to support higher transaction volumes as activity scales.
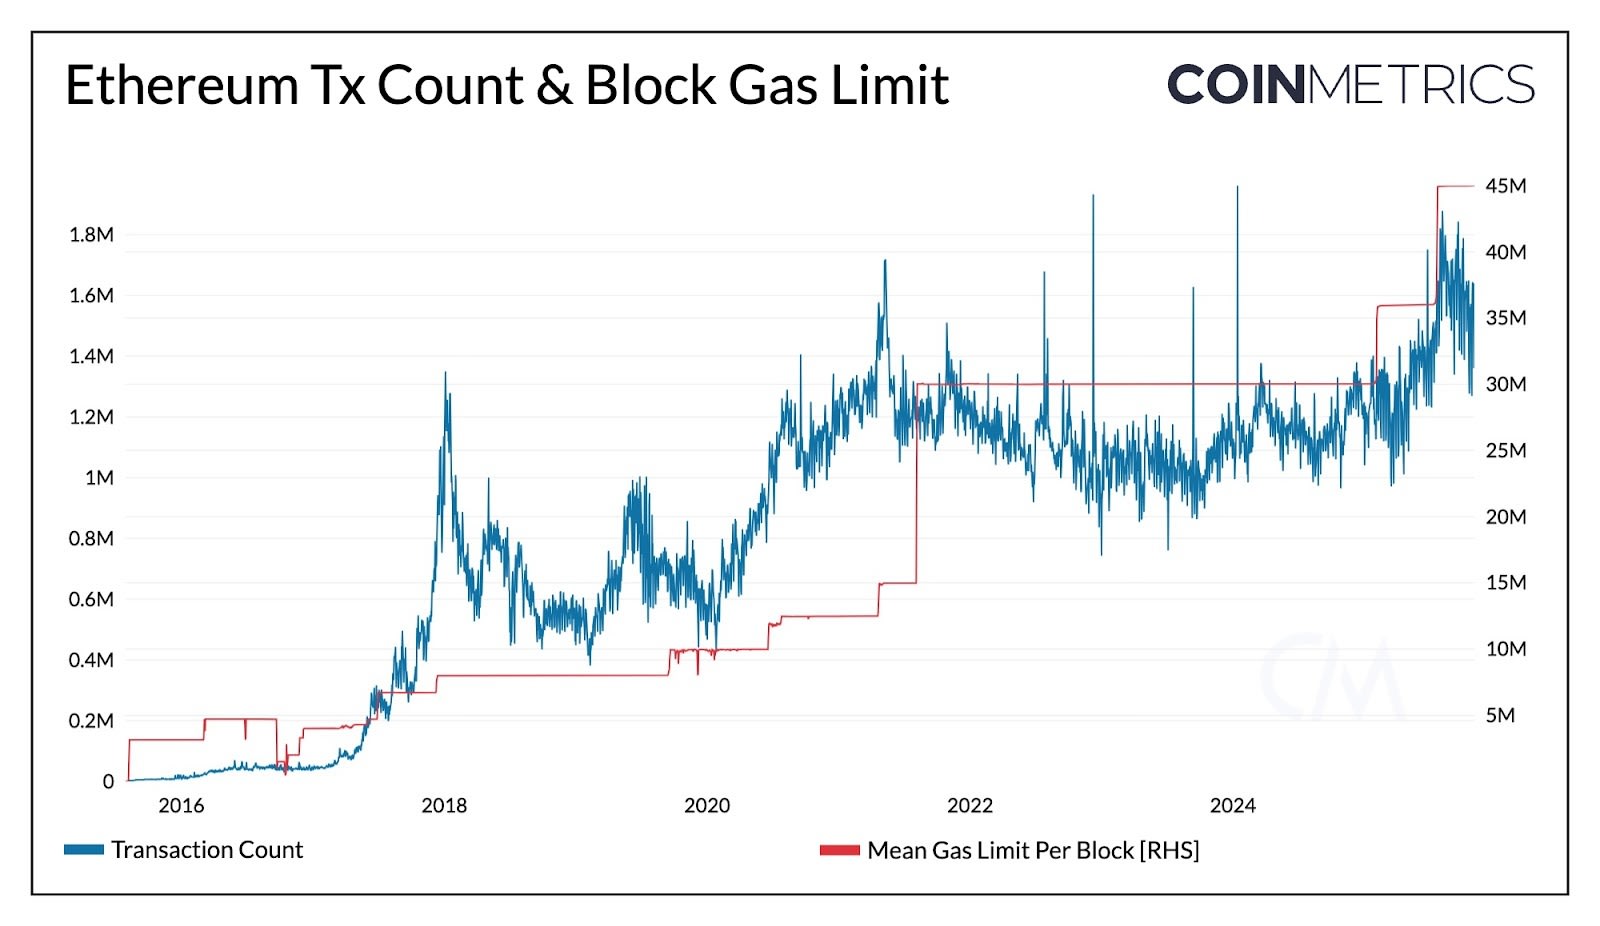
Source: Coin Metrics Network Data Pro
Layer-2 Networks (L2s): The Scaling Express Lanes
Layer-2s extend Ethereum’s capacity by adding new lanes of throughput, absorbing rising demand while keeping fees low. L2s like Base and Optimism have seen an influx in activity as they process transactions in a cost-efficient manner before batching and settling them to Ethereum.
Transaction fees on L2s can be viewed as revenue, earned from user demand to transact. These include both base and priority fees paid by users. In contrast, blob fees represent a cost for rollups, paid to Ethereum when posting transaction data to mainnet. The chart below shows total transaction fees (blue) and average transaction fees (red) on Coinbase’s Layer-2, Base, illustrating how user costs and network revenue behaved under congestion.
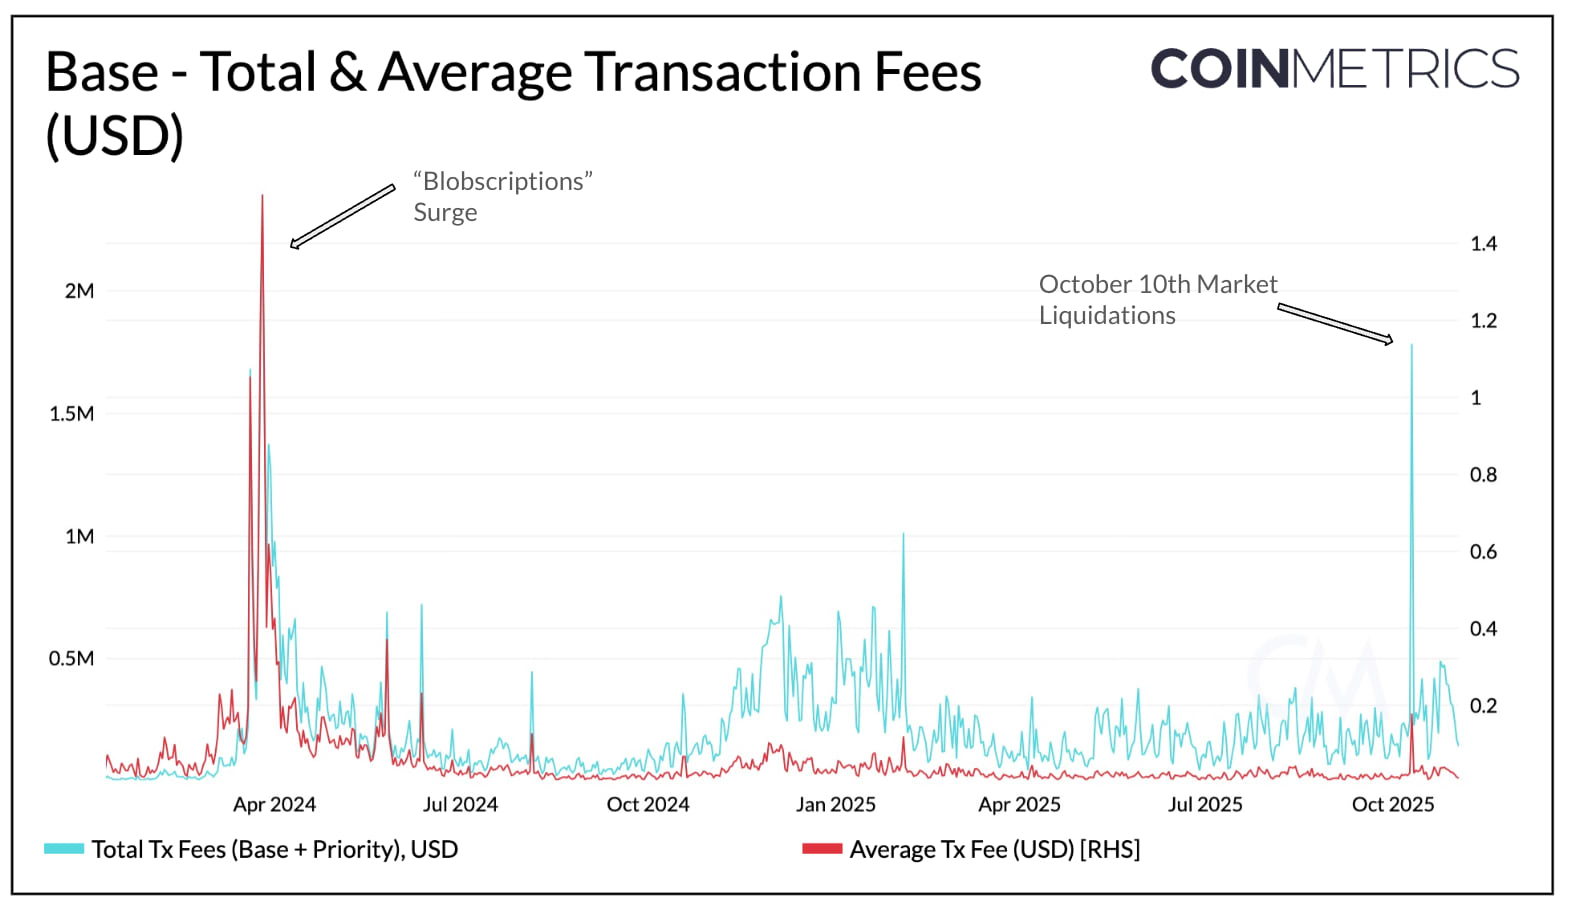
Source: Coin Metrics Network Data Pro
April 2024 Blobscriptions: Shortly after Ethereum’s Dencun upgrade, “blobscriptions” (NFT-like data inscriptions written into blob space)flooded Layer-2s with activity. With blobspace still scarce, blob fees surged, raising blob fees pushing Base’s average transaction fee above $1.40 as users competed for inclusion.
October 2025 Market Liquidations: During the October 10th market volatility, Base generated nearly $1.8M in total transaction fees as liquidation activity surged. Yet, average transaction costs remained below $0.20. With the Pectra upgrade doubling blob capacity earlier that year, blob fees stayed low, allowing Base to process high volume without raising user costs.
Source: Coin Metrics Network Data Pro
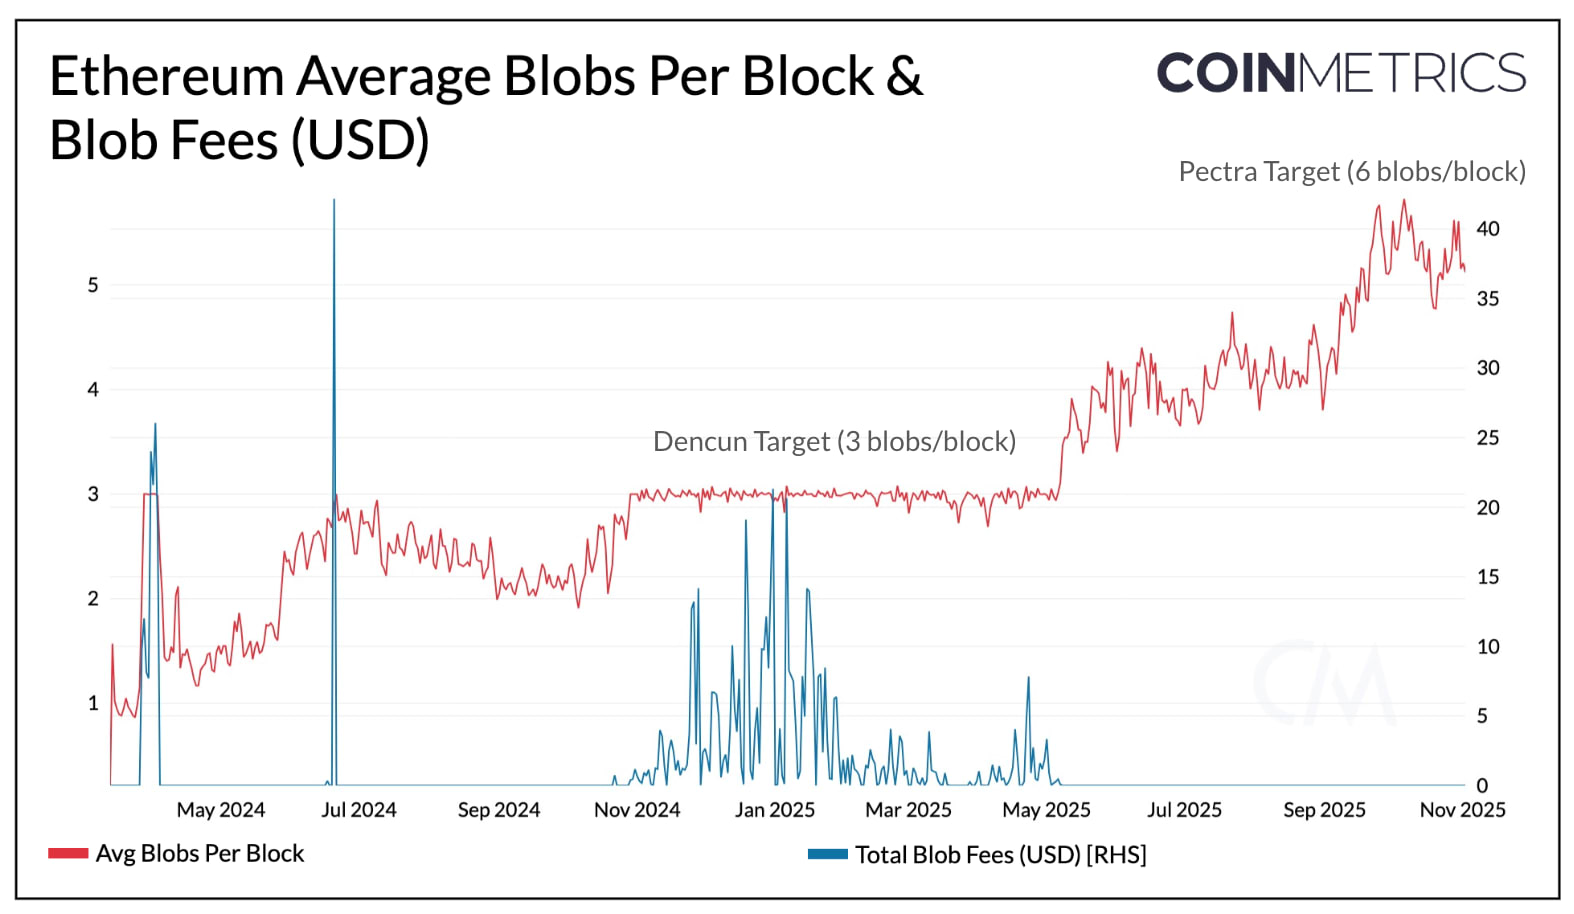
Blobspace, introduced with EIP-4844 in Dencun and expanded through Pectra, has become central to Ethereum’s scaling. As shown above, the number of blobs posted per block has continued to rise with capacity increases, now approaching the new target of six blobs per block. At the same time, blob fees have remained near zero, keeping costs minimal for Layer-2s and end users.
Spikes in blob fees, such as those seen in April 2024, and early periods of 2025 occurred as demand overwhelmed initial capacity when blob space was first introduced. Subsequent upgrades, including Pectra and the upcoming Fusaka, have since stabilized blob pricing and created a more flexible data layer for continued L2 growth.
Solana: The High Throughput Highway
Solana optimizes for high-performance and extremely low transaction costs, taking a different approach to blockchain scalability. Rather than offloading traffic to external scaling layers, it handles execution, consensus, and settlement within a single chain. This allows for higher throughput, while increasing validator hardware requirements.
The chart below shows Solana’s non-vote transaction activity (blue) alongside transaction fees and out-of-protocol MEV tips (yellow and purple). Together, they illustrate how transaction demand and network revenue have evolved with shifts in user activity and market conditions over time.
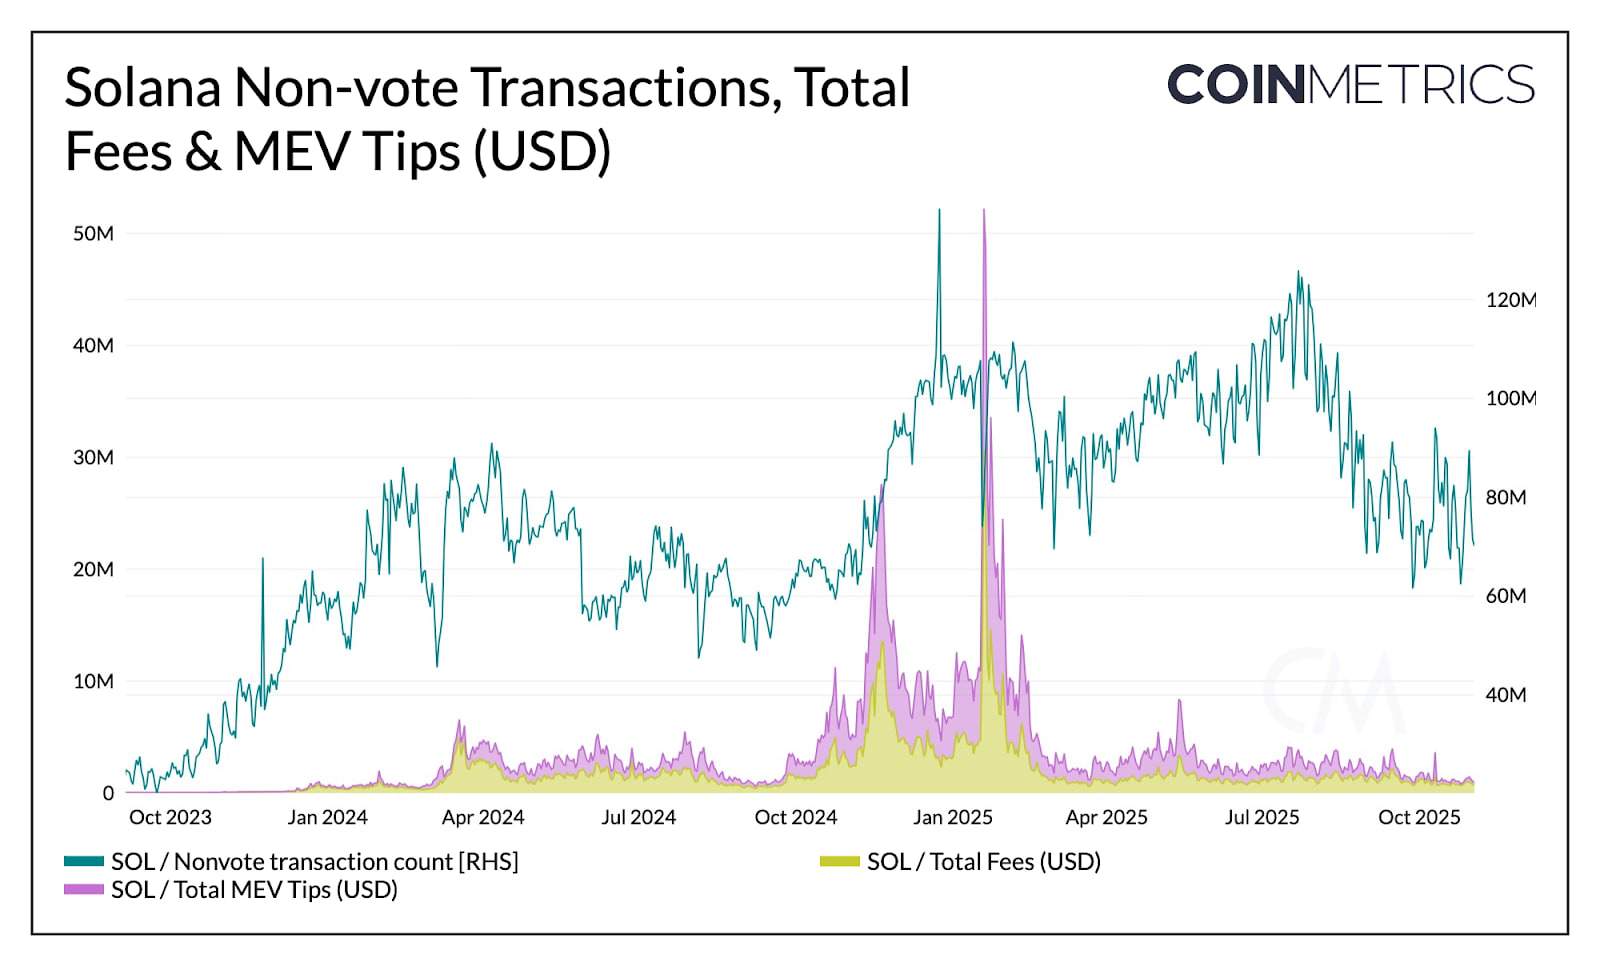
Source: Coin Metrics Network Data Pro
Memecoin Surge & TRUMP Token Launch:
Towards the end of 2024, Solana saw an explosion in memecoin trading, culminating in the January 2025 launch of the TRUMP token. Non-vote transactions surged to record highs as users competed for blockspace. During this period:
Total network fees rose to $30.6 million, with priority fees accounting for roughly 98% of total transaction fees as users bid for faster inclusion.
Out of protocol MEV tips, off-chain payments used to incentivize transaction inclusion by validators, also spiked to $21.5M.
Average fees rose roughly 825 % to $0.37, while median fees stayed below $0.003.
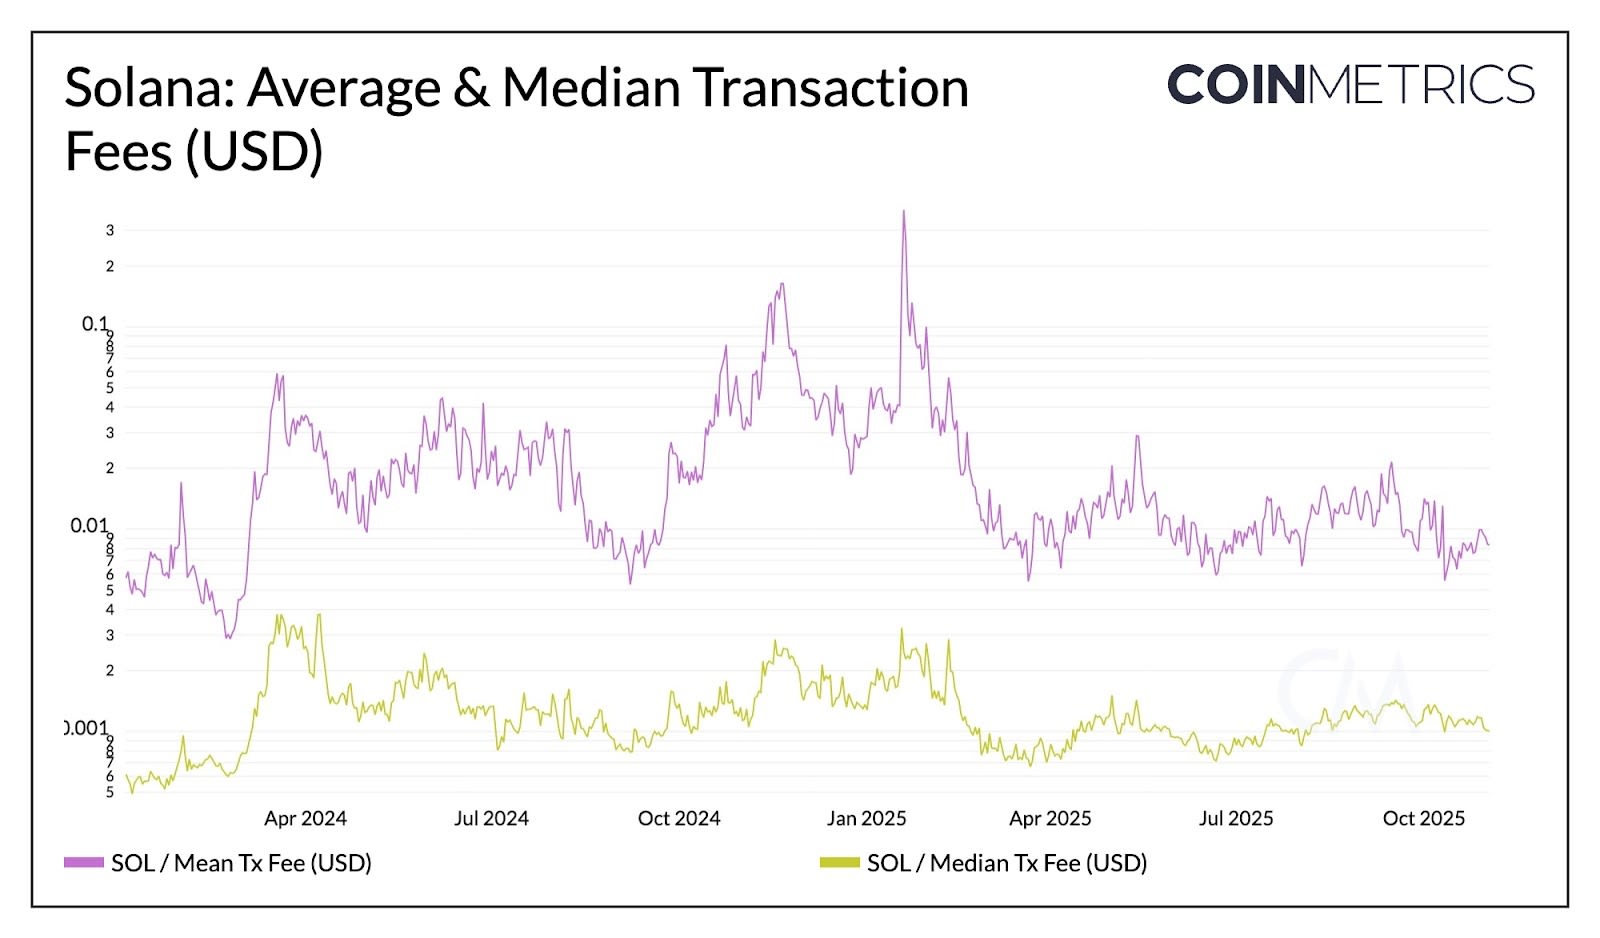
Source: Coin Metrics Network Data Pro
This illustrates Solana’s local fee market design, where congestion in one hotspot doesn’t raise costs network-wide. Each transaction includes a fixed base fee and an optional priority fee based on requested compute units (CUs). Therefore, users interacting with highly contested applications or tokens may face higher priority fees, but most users continue to transact at low costs.
Future upgrades such as Alpenglow, which aims to reduce finality to 100–150 milliseconds, and Firedancer, a validator client designed for higher throughput and resilience, will continue to support Solana’s vertically integrated scaling path.
Looking Ahead
Scalability is emerging as one of the key pillars for mainstream blockchain adoption. As demand for blockspace grows in both volume and diversity, networks continue to navigate the tradeoff space to support a widening range of user activity, from DeFi transactions, high velocity trading or agentic AI payments to stablecoin issuance, tokenized assets, and institutional settlement.
As we saw in our lookback, the past few years of congestion stress tests have shown meaningful progress. Ethereum is incrementally scaling through Layer-2 blob capacity and L1 gas limit increases, while Solana’s vertically integrated design continues to push the limits of single-chain performance. Each demonstrates a distinct but complementary path toward more efficient blockspace and lower user costs.
At the same time, new networks are emerging to push the boundaries of this tradeoff space. Chains like Hyperliquid, Tempo, Arc, and Canton are optimizing for specific verticals such as trading, payments, and regulated finance, while general-purpose entrants like Monad and MegaETH aim to deliver higher throughput within familiar EVM environments. Together, these developments suggest a future shaped by more specialization, as networks evolve around distinct purposes and performance goals, while the balance between fragmentation and interoperability continue to unfold.
Coin Metrics Updates
Follow Coin Metrics’ State of the Market newsletter which contextualizes the week’s crypto market movements with concise commentary, rich visuals, and timely data.
As always, if you have any feedback or requests please let us know here.
Subscribe and Past Issues
Coin Metrics’ State of the Network, is an unbiased, weekly view of the crypto market informed by our own network (on-chain) and market data.
If you’d like to get State of the Network in your inbox, please subscribe here. You can see previous issues of State of the Network here.
© 2025 Coin Metrics Inc. All rights reserved. Redistribution is not permitted without consent. This newsletter does not constitute investment advice and is for informational purposes only and you should not make an investment decision on the basis of this information. The newsletter is provided “as is” and Coin Metrics will not be liable for any loss or damage resulting from information obtained from the newsletter.
Thanks for reading Coin Metrics State of the Network! Subscribe for free to receive new posts and support our work.


