

The meme coin space got off to a rough start in November, with a 17.7% drop over the past week being one of the biggest declines among cryptocurrencies. However, even amid this correction, some meme coins are showing early signs of recovery.
Whale positions, smart money flows, and short-term recovery signals suggest that these three Token may continue to surprise traders in the coming days.
PEPE is in the spotlight
PEPE was one of the meme coins to watch in November. Surprisingly, the meme coin is down 44% in the last 30 days. This correction makes PEPE one of the biggest losers in the category.
However, some on- chain moves still make it worth paying attention to this month.
Smart Money and mega whales appear to be buying the dip . In October, Smart Money wallets increased their PEPE holdings by 17.24%, now holding 1.91 trillion Token , while whales increased their balances by 0.88%, holding 306.83 trillion.
In total, that's about 3 trillion additional PEPE Token worth over $16 million — a clear sign of re-established trust.
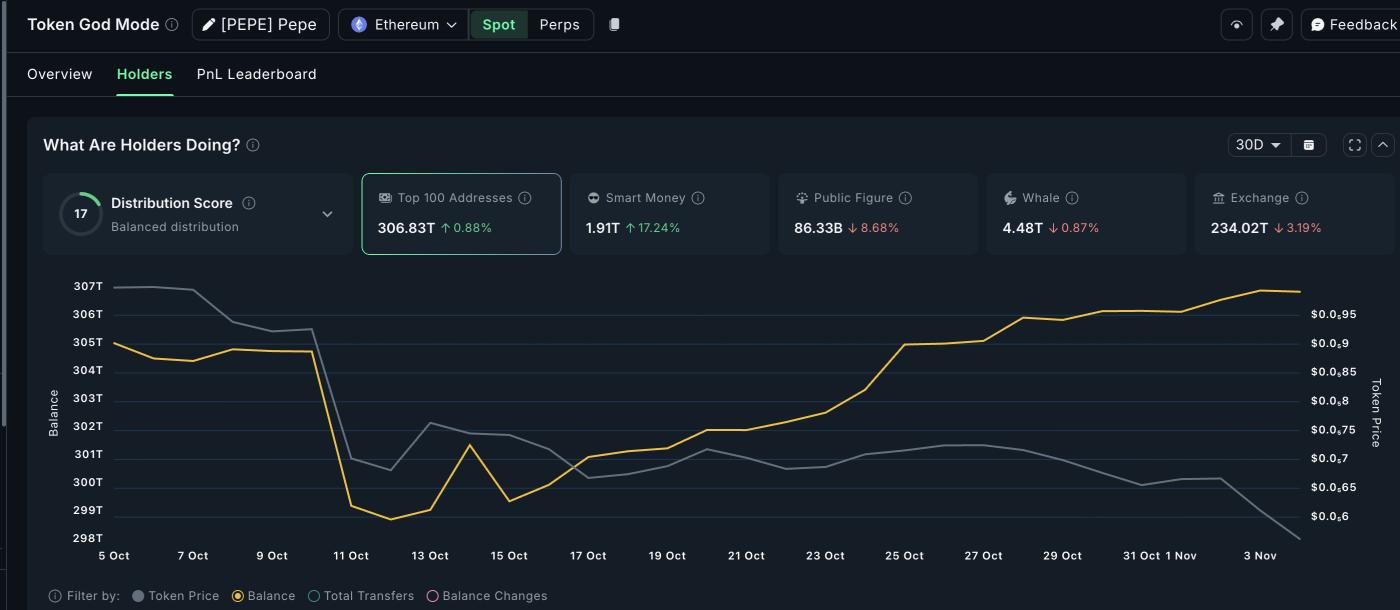 PEPE Whales: Nansen
Want more information about Token like this? Subscribe to Editor Harsh Notariya's Daily Crypto Newsletter here .
On the chart, PEPE price is trading within a Falling Wedge pattern — a bullish setup if the upper trendline is broken. The Token is currently holding above $0.00000548, a strong support level.
If this level holds, PEPE could rally towards $0.00000607 and $0.0000064, with a break above $0.00000702 confirming a wedge breakout. That could potentially trigger a bullish reversal towards $0.00000798.
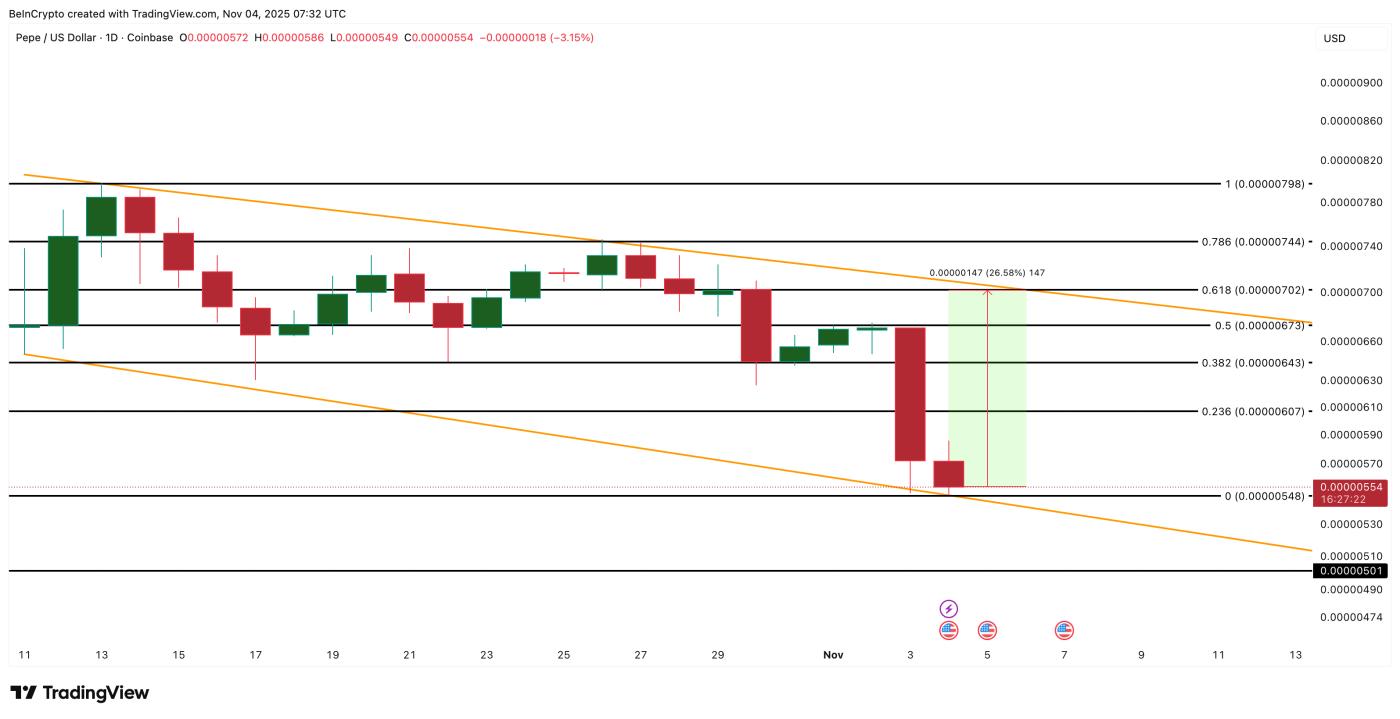 PEPE Price Analysis : TradingView
However, if there is a daily close below $0.00000548, PEPE could fall further towards $0.00000501, invalidating the wedge setup. Currently, the lower trendline of the wedge pattern appears weaker, as there are fewer points of contact.
However, the situation could change quickly if the $0.00000548 support holds.
Doge is also being watched
Doge along with PEPE were two notable meme coins in November. Despite a massive 38% drop in the past 30 days, there are signs that this correction may be coming to an end, with a recovery setup emerging.
During the period from October 10 to November 4, the price made a higher Dip , but the Relative Strength Index (RSI) — a momentum indicator that measures the speed and strength of price movements — made a lower Dip .
This pattern is called a hidden bullish divergence, which usually signals that the main uptrend is still holding even if there is a correction. In a main uptrend, we are talking about a 3% increase over the previous year.
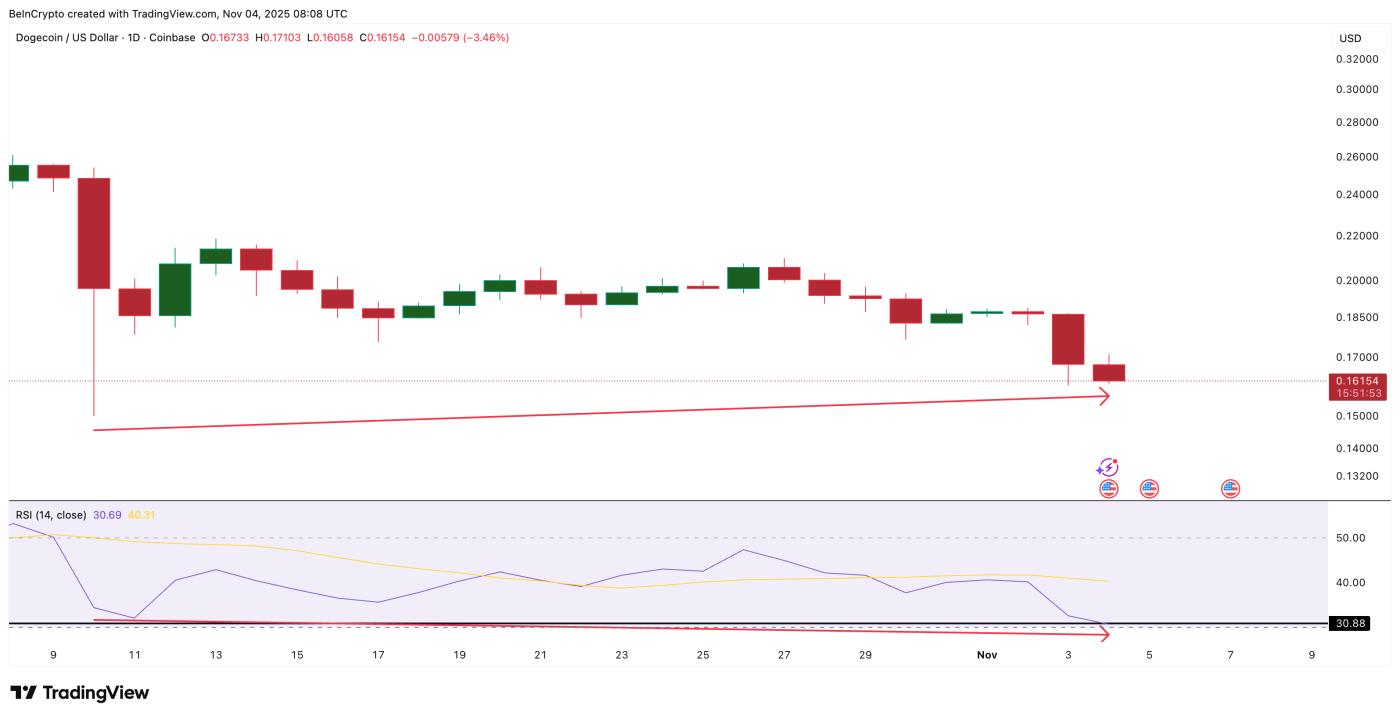 Doge shows signs of recovery : TradingView
This suggests that buyers remain motivated, reinforcing the idea that the selling may be losing steam.
Doge is currently trading at around $0.16. The first resistance to watch is $0.19, which coincides with the 0.618 Fibonacci retracement level — a key technical level that many traders are expecting a reaction to.
A daily close above $0.19 would confirm this recovery and could pave the way for further upside. It should be noted that this important Fibonacci level has been quite a hindrance to Doge ’s price recovery efforts since October 30.
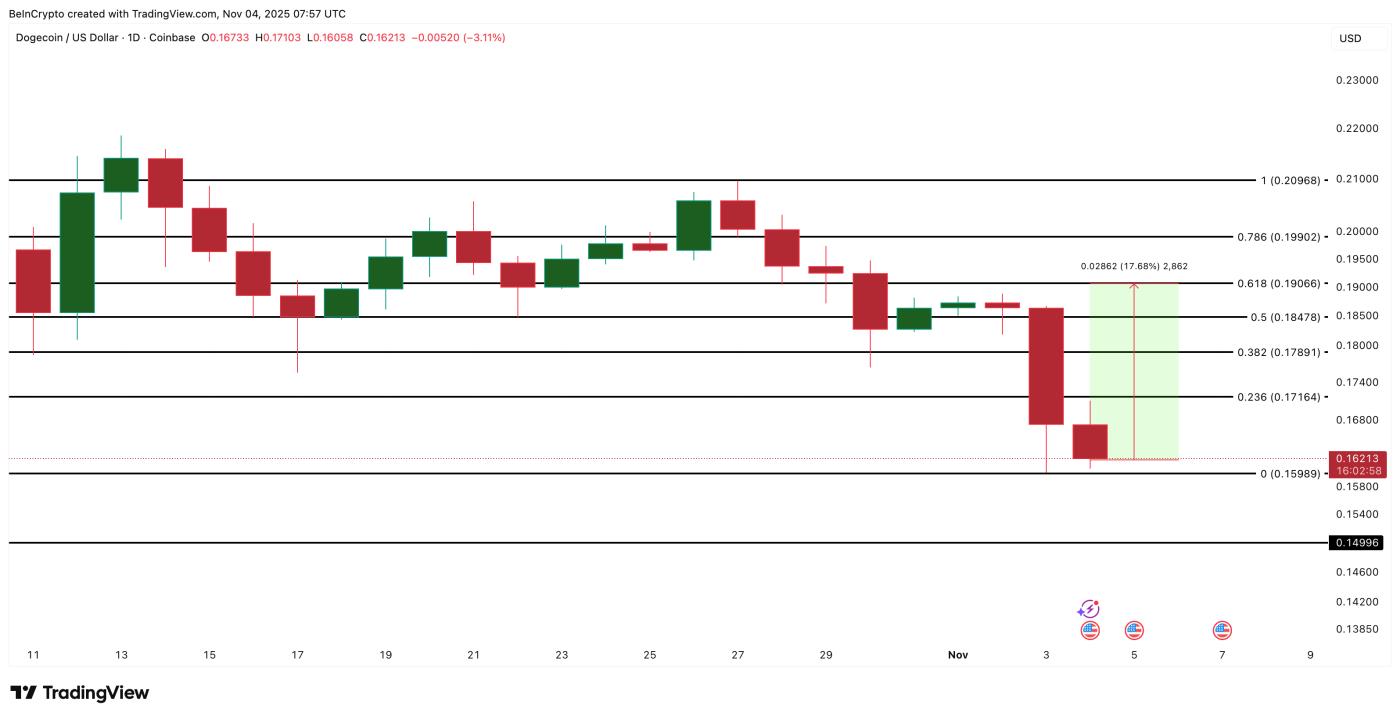 Doge Price Analysis : TradingView
However, if Doge falls below $0.15, it could test $0.14 or even lower, invalidating the bullish setup. For now, as long as $0.15 holds, Doge remains one of the top meme coins to watch this month, despite its current weakness.
notable Shiba Inu
PUMP is the final name in the meme coins to XEM this November. Despite being one of the biggest losers in this category, down nearly 47% over the past month and 21.3% over the past seven days, it is showing signs that a recovery may be forming.
Whales have been noticeably active during this correction. In the past week alone, they have added approximately 2.10 billion PUMP Token , bringing their total holdings to 16.68 billion.
At current prices, that amount is equivalent to about $7.77 million, a clear sign that large investors are buying on dips.
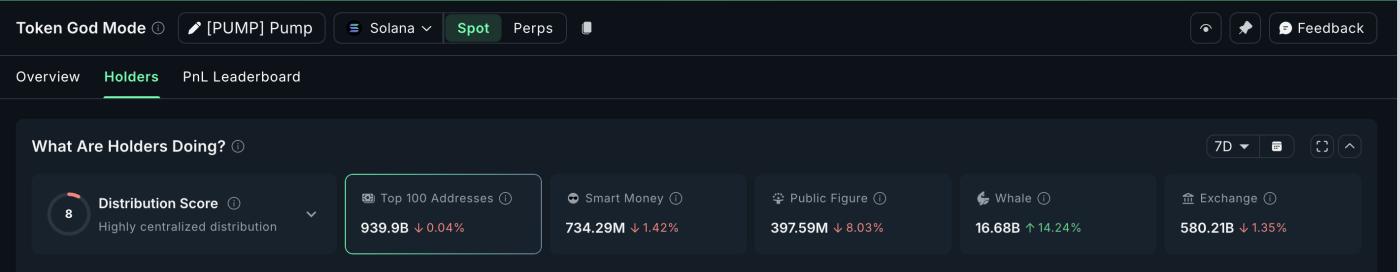 Whale Pump: Nansen
The Token is currently trading within a symmetrical triangle pattern, a neutral pattern that often signals further volatility. The recent decline since October 30 was triggered by a hidden bearish divergence. This occurs when the price makes a lower high while the Relative Strength Index (RSI), a price momentum indicator, makes a higher high. This setup often predicts short-term corrections.
Now that PUMP has found support at the lower trendline of the triangle, the RSI-led decline appears to be complete. A daily close above $0.0049 could signal a bullish breakout, potentially reaching $0.0062.
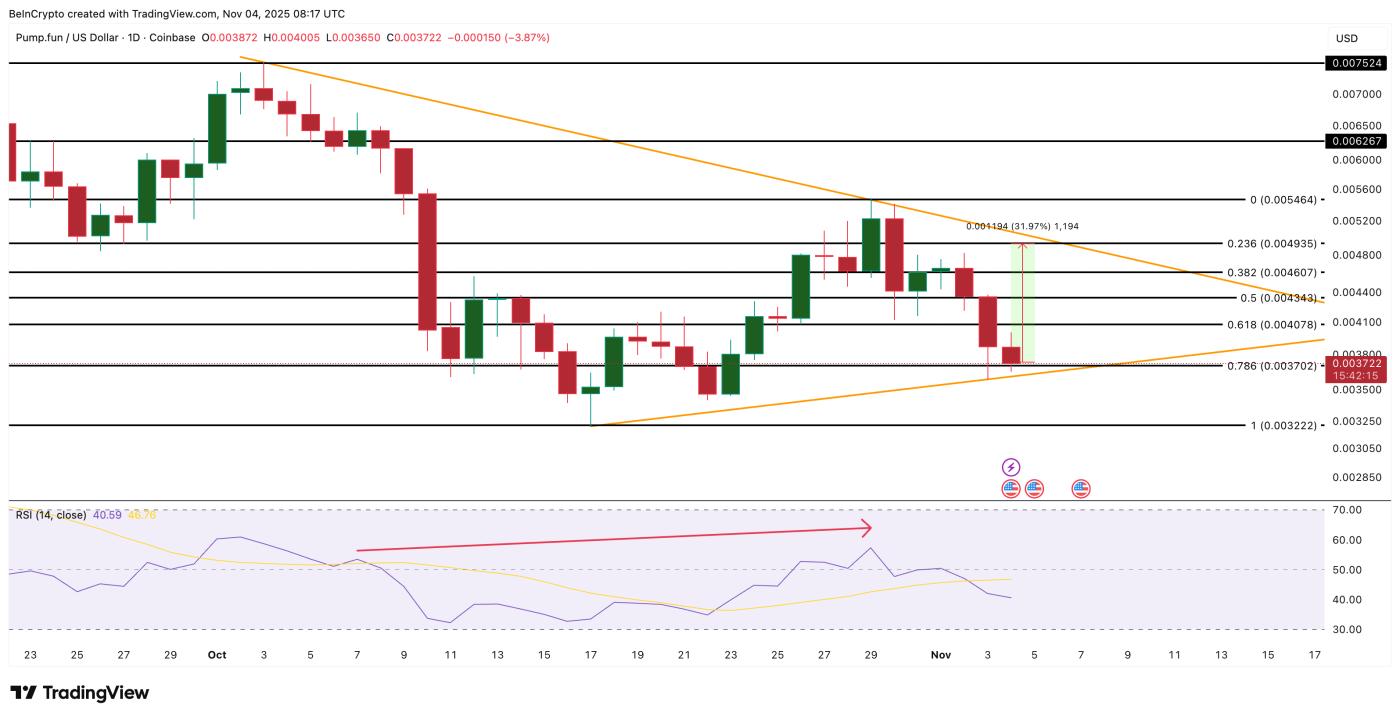 PUMP Price Analysis: TradingView
However, the lower trendline has only two touches, making it quite weak. If PUMP loses the $0.0037 support, it could fall to $0.0032, invalidating the recovery thesis.
Still, with whales buying heavily, PUMP remains one of the most interesting meme coins to watch this November.


