

Compiled & translated by: TechFlow TechFlow

Podcast source: 10x Research
Original title: A Deep Dive into Bitcoin Bear Market On Chain and Market Indicators
Broadcast date: November 13, 2025
Key points summary
About 10x Research
- The prediction was for Bitcoin's lowest point in October 2022, and it was projected that Bitcoin would rise to $63,160 by March 2024 before the halving (the halving date was adjusted to April, and the final price was $63,491).
- In January 2023, we predicted that Bitcoin would rise to $45,000 before Christmas, a prediction that came true (the final price was $43,613).
- Back in September 2023, we pointed out that Bitcoin mining companies would be a key investment area in 2024. More recently, in November 2023, we predicted that Bitcoin would rise to $57,000 after the ETF was approved.
- Bitcoin is predicted to rise to $70,000 in January 2024, followed by a pullback near its March 2024 high.
This podcast episode from 10x Research will provide in-depth analysis of the Bitcoin bear market:
What are the on-chain data and market signals telling us? Has Bitcoin entered a bear market? How should traders respond now?
Over the past three weeks, and especially in our report on October 22, we have repeatedly highlighted several key signals. The plunge on October 10, the subsequent unusual investor behavior, and Federal Reserve Chairman Powell's uncertain stance on the prospect of a December rate cut are not isolated events, but rather manifestations of the same macroeconomic context.
With the SEC approving a Bitcoin ETF, regulation is no longer a major obstacle to the bull market. The real reason for a stalled bull market is that when market inflows weaken and profit-taking exceeds new demand, the market loses its upward momentum.
This podcast episode will provide a detailed analysis of charts, fund flows, and various data points to help you determine whether Bitcoin is currently in a bull or bear market. Even if Bitcoin is indeed in a bear market now, this bear market may not last long.
Summary of key viewpoints
- When the price of Bitcoin falls below the 21-week moving average (EMA), the market enters a mini-bear market.
- If the price of Bitcoin falls below the $110,000-$112,000 range, we will maintain our bearish view; if the price breaks through this range, we may turn bullish.
- Over the past 30 days, long-term holders have sold 185,000 bitcoins, worth approximately $20 billion. These holders believe the market may decline further and are therefore choosing to exit.
- On-chain data also suggests this could be a deeper market correction. The market currently appears to have entered a bear market phase dominated by selling. This selling could take many forms and could last for an extended period.
- We predict that Bitcoin may rebound to $110,000 before falling again.
- Historically, when Bitcoin's price falls below its true average price, the market typically enters a deep bear market. Currently, the true average price is around $82,000, a significant dividing line between the end of a Bitcoin bull market and the beginning of a bear market. If the price breaks below this level, the market may first test the key support level of $93,000.
- We will maintain our bearish market view as long as the price of Bitcoin remains below $113,000.
- Whether the price of Bitcoin falls below the 21-week moving average is an important indicator for judging market trends.
- We anticipate that the next bull market may begin after a shift in the Federal Reserve's monetary policy, which is one of the core factors we are closely monitoring.
Bitcoin falls below the 21-week EMA – a key threshold for a bull market.
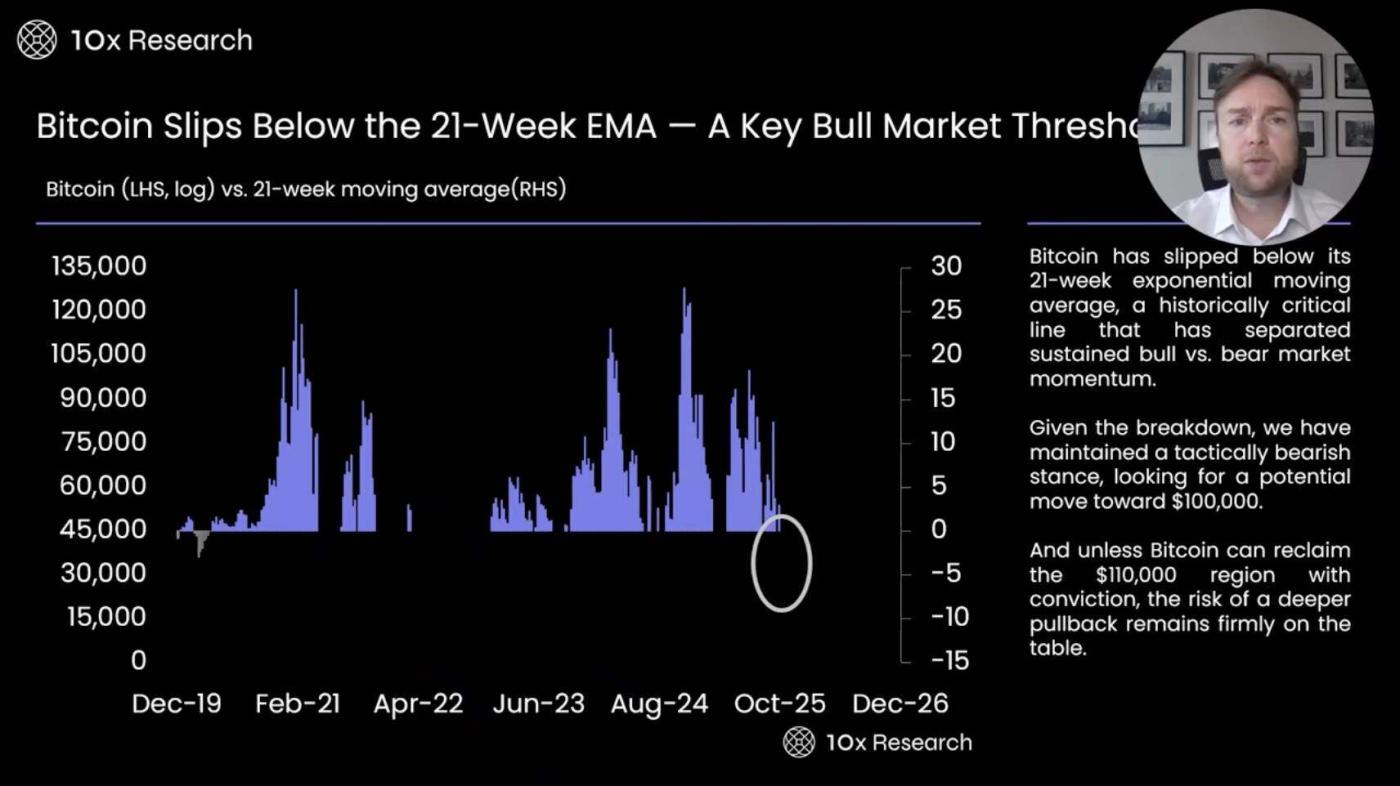
- Our current focus is on the 21-week moving average (EMA). Typically, when the price of Bitcoin falls below this indicator, the market enters a mini-bear market. This indicator played a significant role in the 2022 bull-to-bear market transition, helping us avoid substantial losses for many in the market.
- Furthermore, we observed the market correction in the summer of 2024, as well as the adjustment in the first quarter of this year. This indicator not only confirmed these corrections but also gave us advance warning. These corrections typically ranged from 30% to 40%, with a significant impact. Therefore, setting a clear reference point is crucial, and the current reference point is $110,000.
- Multiple indicators point to a Bitcoin price range of $110,000 to $112,000. If the price falls below this range, investors need to manage risk, reduce bullish positions, remain neutral, or even turn bearish.
- Current EMA indicators suggest that Bitcoin's price should fluctuate between $100,000 and $110,000, and the actual price movement has aligned with this prediction. This forces us to seriously consider whether the market is currently entering a phase of accelerated decline in a bear market.
Long-term holders sold $20 billion worth of Bitcoin.
![]()
- We need to pay close attention to the actions of long-term holders. In the past 30 days, long-term holders have sold 185,000 bitcoins, worth approximately $20 billion. Typically, long-term holders behave by selling when prices rise and buying when prices consolidate, bottom out, or experience initial rebounds. As the market continues to rise, they gradually exit, continuously reducing their holdings at price peaks.
- Looking back at April 2022, long-term holders sold off large amounts of Bitcoin, causing its price to plummet from $40,000 to $20,000, even hitting a low of $15,000. This phenomenon is noteworthy. In the past few weeks, the price of Bitcoin has continued to decline, falling from $12,600 to the current range of $10,000 to $13,000. And long-term holders have not stopped selling Bitcoin.
- This at least indicates that long-term holders believe the market may fall further and are therefore choosing to exit. Whether their judgment is correct remains to be seen.
Achieving a market capitalization comparable to the overall market capitalization: a reliable signal revealing a shift in the Bitcoin cycle.
![]()
- The ratio of realized market capitalization to market capitalization is a key metric we frequently use. This metric has played a significant role in previous bear markets, successfully predicting not only large-scale bear markets but also similar smaller ones.
- When this indicator is negative, it usually means the market is in a correction phase. At this time, it is advisable for investors to exit the market, remain on the sidelines, or adopt a bearish strategy. I believe the market is currently in this phase, and it deserves our close attention.
Bitcoin's bullish momentum is weakening, and capital inflows are gradually decreasing.
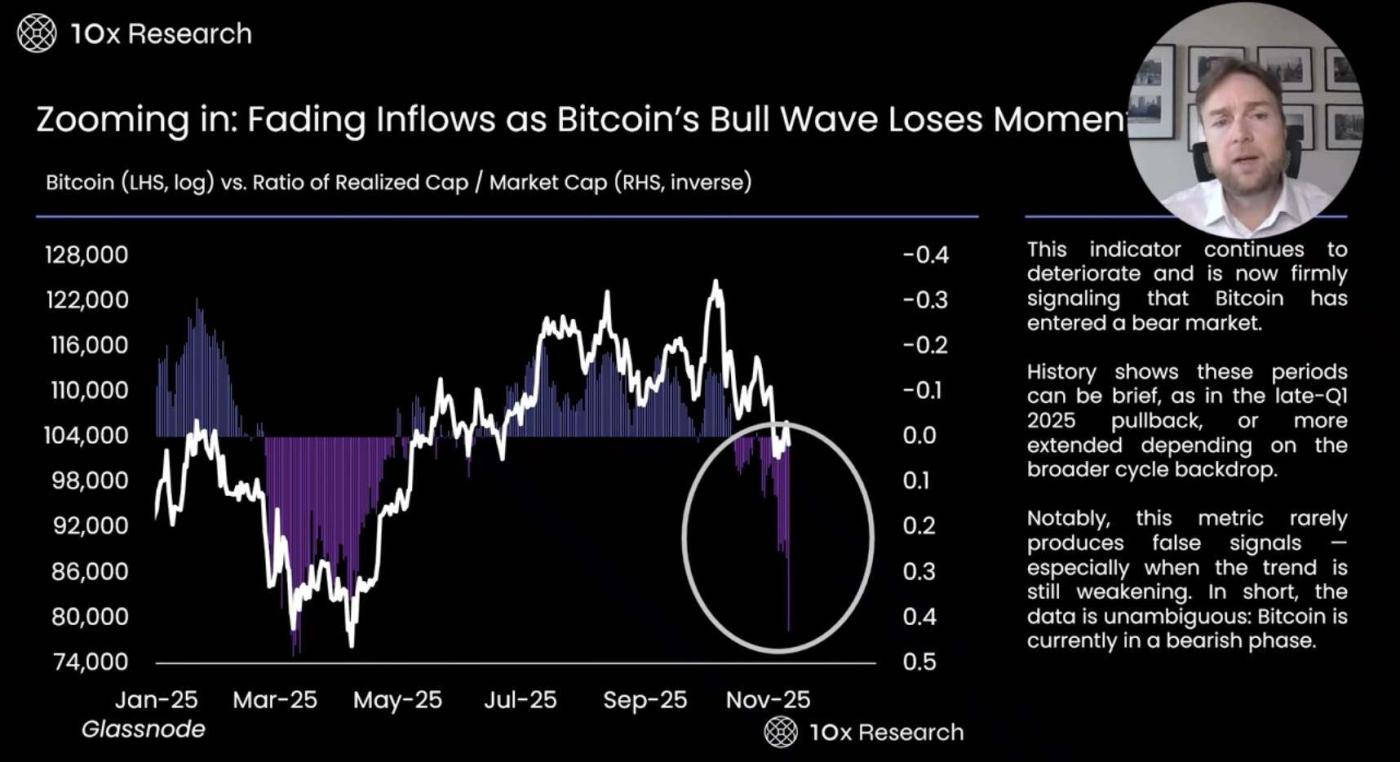
- By zooming in further, we can see more clearly that the recent downward trend of this indicator is very similar to the worst period in the market this March. Although Bitcoin subsequently experienced a slight rebound, it has since fallen another 10% from the level after the rebound. Therefore, it is still difficult to conclude that the market has emerged from its predicament. In fact, it is still uncertain whether $100,000 is the lowest point of this correction. Based on the performance of this indicator, the market may fall below $100,000 and go further down, as this indicator usually foreshadows a deeper correction.
- The market has been correcting for several weeks now. But if we look back at the market correction earlier this year, that was a two- to three-month adjustment, not the current correction that has only lasted about three weeks.
Short-term holders' cost benchmark falls below: capitulation may have begun.
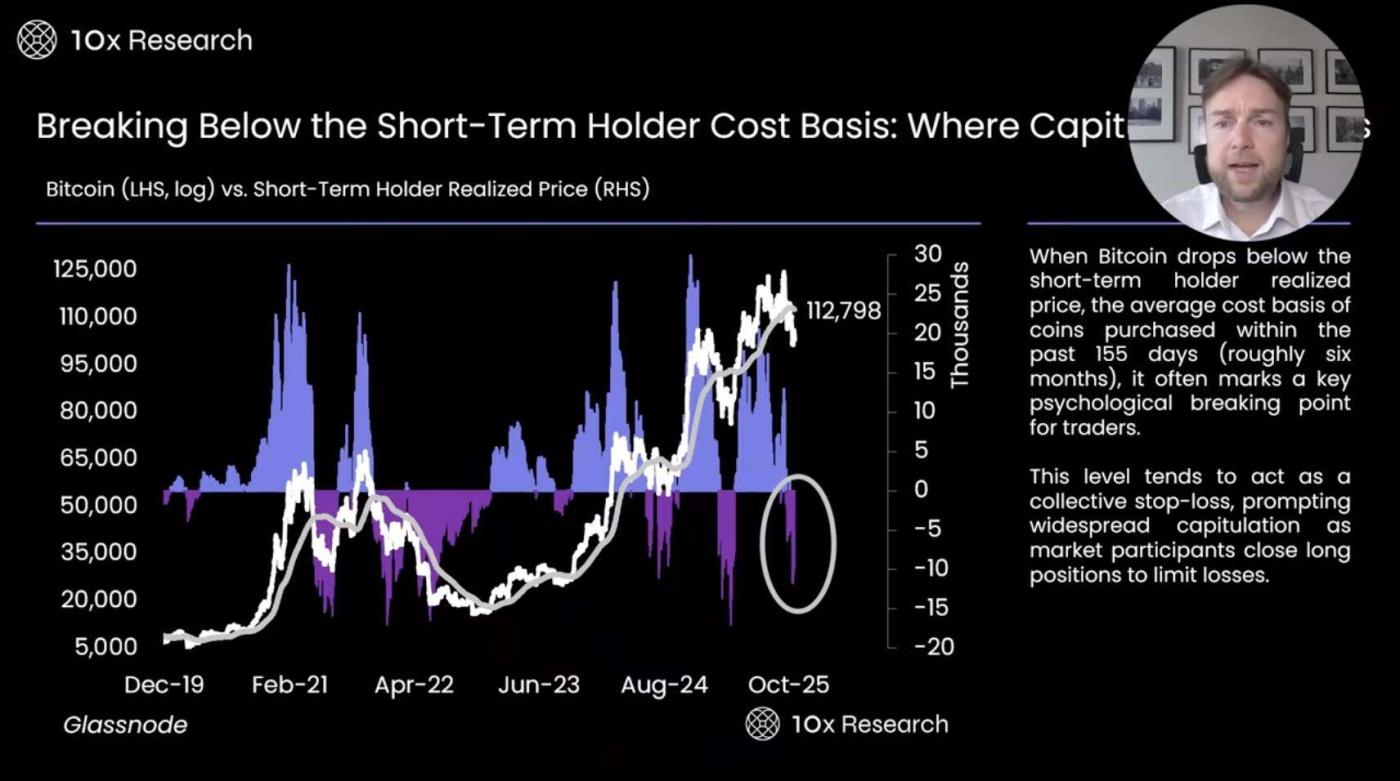
- The realized price for short-term holders is a key indicator , currently at $112,798 (at the time of podcast recording), reflecting the average purchase level of short-term holders over the past 155 days. When the price of Bitcoin falls below this level, investors typically opt to stop-loss, causing the market to decline further. This is primarily because short-term traders tend to buy on the expectation of price increases, and when the price falls below their purchase price, they quickly sell their assets. We can see that when Bitcoin fell below $113,000, the price experienced further declines, triggering a massive forced liquidation event in October.
- Furthermore, on-chain data suggests this could be a deeper market correction. The market currently appears to have entered a bear market phase dominated by selling. This selling can take many forms and may last longer. Historically, Bitcoin prices tend to fall further when short-term holders are at a loss. Only a break above this level (ideally driven by a strong catalyst) could potentially turn the market bullish. Otherwise, the market still faces significant downside risk. In this situation, protecting capital is paramount. If we want to buy at lower prices, we must sell at higher prices.
The risk of surrender has resurfaced—even if Bitcoin rebounds.
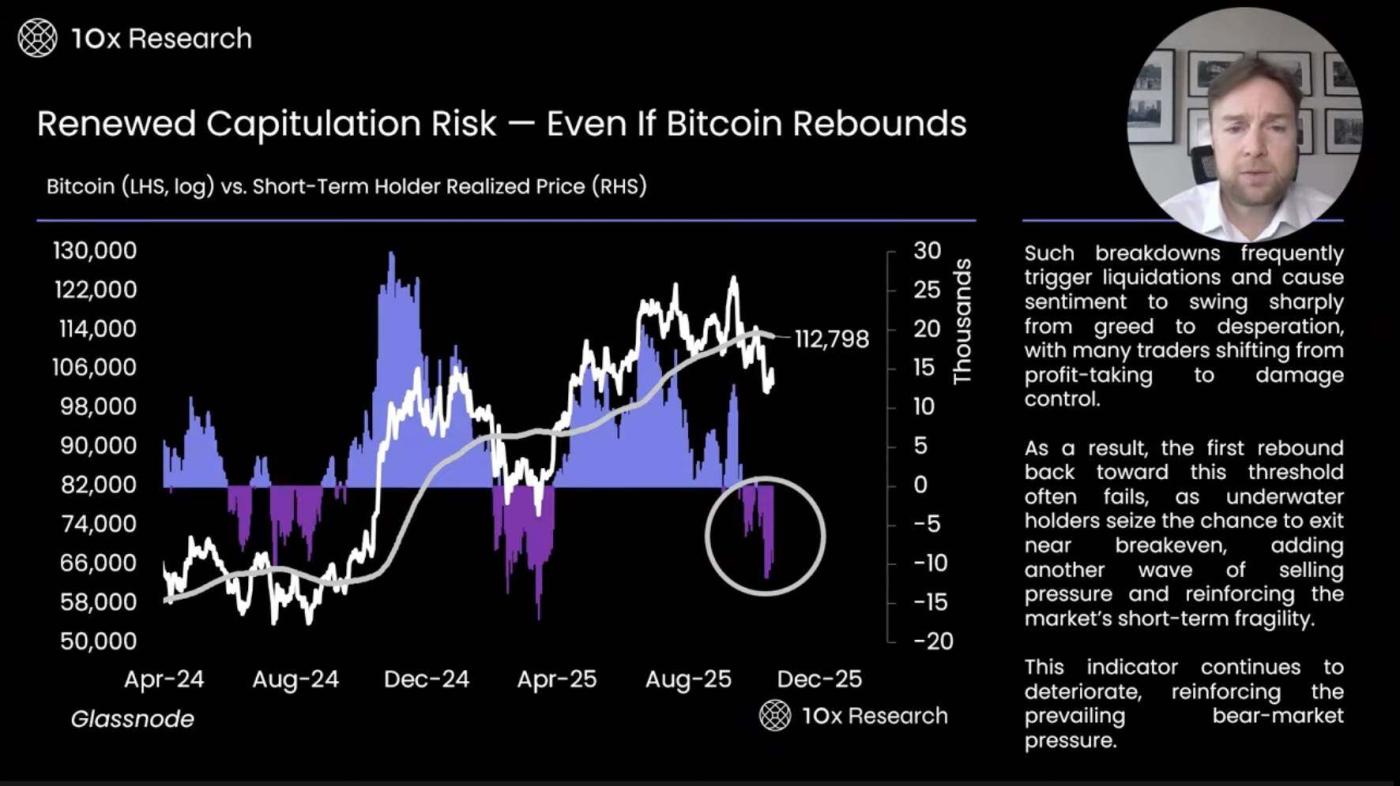
- In our research reports over the past few weeks, we analyzed Bitcoin's market trends from multiple perspectives. A closer look revealed that relevant indicators became more negative during the first quarter correction this year, suggesting that Bitcoin's rebound pattern is closer to a W-shape than a traditional V-shape. A W-shape rebound implies that the market price experiences two bottoming and rebound processes over a longer period, rather than a single rapid rise. Based on this, we predict that Bitcoin may rebound to $110,000 before falling again.
- However, from a trading perspective, such predictions may be overly idealistic, as market movements are difficult to predict accurately. We cannot determine whether the price will rebound before falling or enter a direct downtrend. Therefore, we believe it is more reasonable to maintain a bearish stance when the Bitcoin price is below $113,000. Unless the price breaks through this level, we are more inclined to focus on downside risks rather than trying to capitalize on potential upside momentum.
Weakening speculative momentum may indicate that the market is about to enter a consolidation phase.
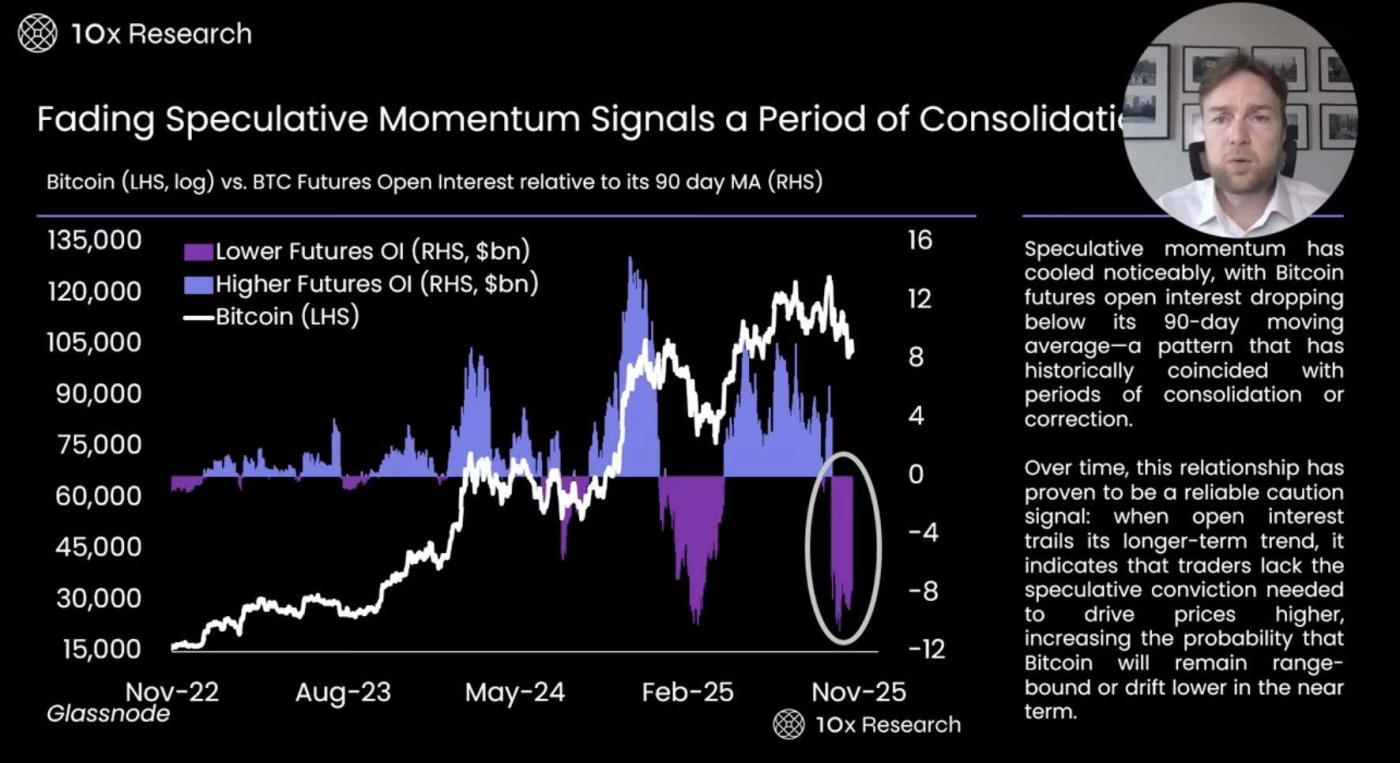
- During the market correction on October 10th, Bitcoin experienced a massive forced liquidation. At that time, former US President Trump threatened to impose a 100% tariff on China at the close of Friday's trading session, while the US stock index futures market was about to close, and only the Bitcoin futures market remained open. It was at this moment that the Bitcoin futures market liquidated positions worth up to $20 billion.
- This suggests that Bitcoin prices struggle to rebound when the number of futures traders in the market decreases. We may be experiencing a similar situation, as we've observed in previous market corrections that market rallies become exceptionally difficult once futures traders unwind and unwind their long positions. This is one reason why we remain cautious. We are closely monitoring changes in open interest, futures positions, and funding rates, all of which currently do not show bullish signals but rather indicate that traders are employing very prudent risk management strategies.
Long-term holders are starting to take profits – this could signal the approach of a consolidation period.
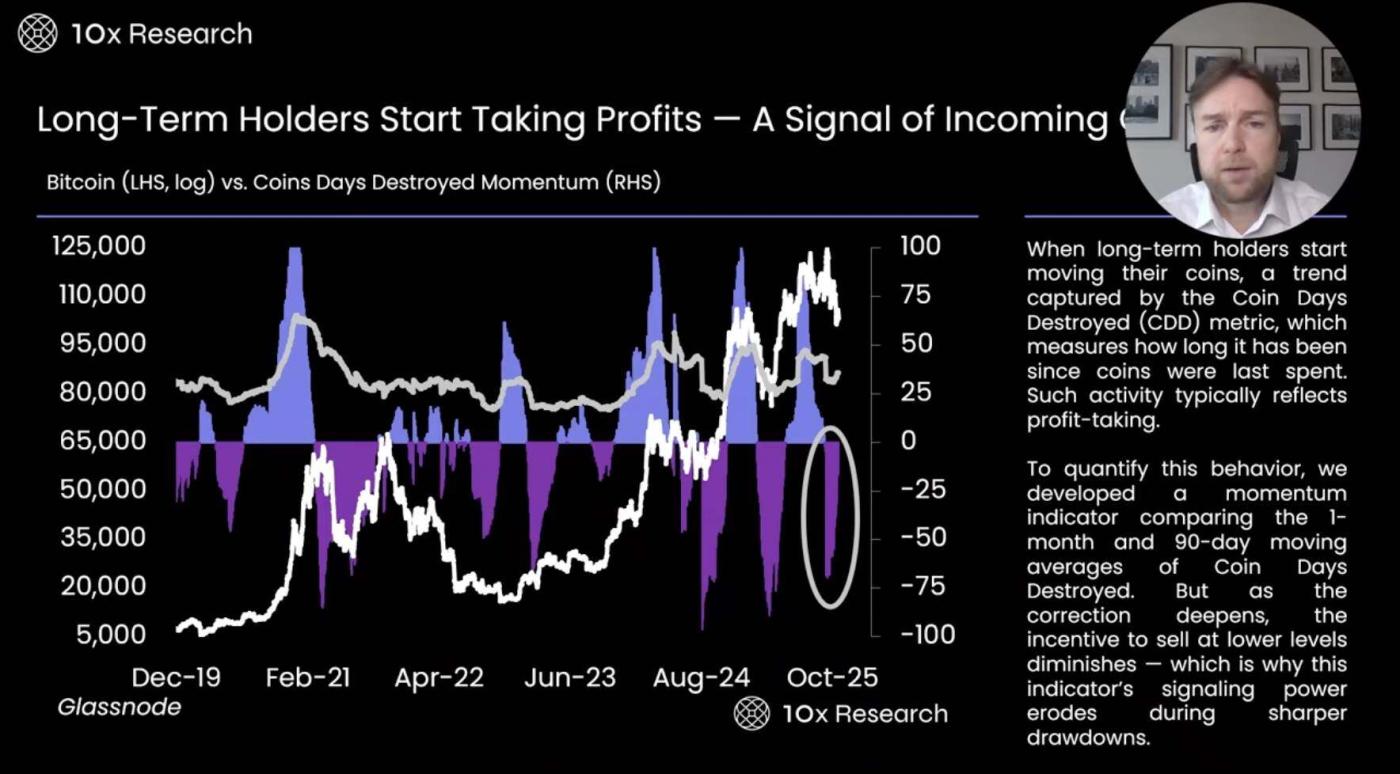
- Coin Days Destroyed is an indicator used to track long-term Bitcoin holders. It works by monitoring the number of days coins have been destroyed (i.e., the cumulative time it takes for long-held Bitcoin to be sold) to issue warning signals. When some long-term holders begin selling Bitcoin, this indicator alerts the market to potential risks.
- However, as bear markets persist, long-term holders typically choose to continue holding rather than sell at lower prices. This weakens the predictive power of this indicator during bear markets. Even so, it still provides some warning signs. I believe this is one of the key reasons why we remain cautious.
Low valuations lacking momentum: MVRV indicator suggests consolidation may continue.
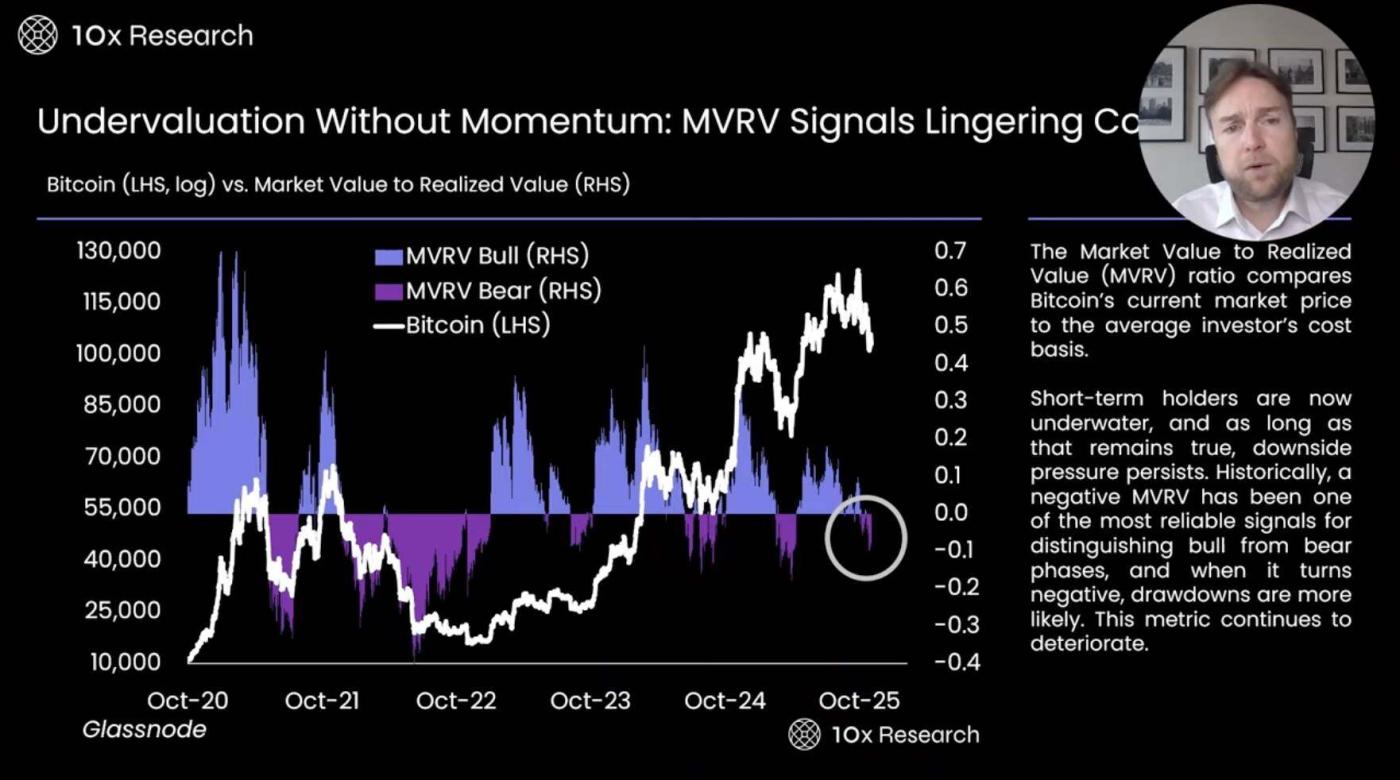
- One of the most critical off-chain metrics is the Market Value to Realized Value (MVRV), which compares Bitcoin's current price to an average investor's cost basis. Currently, this metric has turned negative, primarily reflecting the performance of short-term Bitcoin holders who bought Bitcoin over the past 155 days, rather than the overall market performance.
- This data indicates that many investors are currently experiencing losses. When investors are in a loss-making situation, the market often experiences a minor correction, or even a deeper adjustment. This was particularly evident during the bear market of late 2021 to 2022. Furthermore, it's worth noting that the current bull market momentum is weak. Compared to the bull market surge at the end of October 2020, both market momentum and investor euphoria are significantly lacking. This low momentum makes the market more susceptible to a rapid reversal, especially when investors realize they are in a loss-making position. Therefore, we remain concerned that the current bull market may lose momentum prematurely.
The true average market price indicates that investors' profits are being gradually eroded.
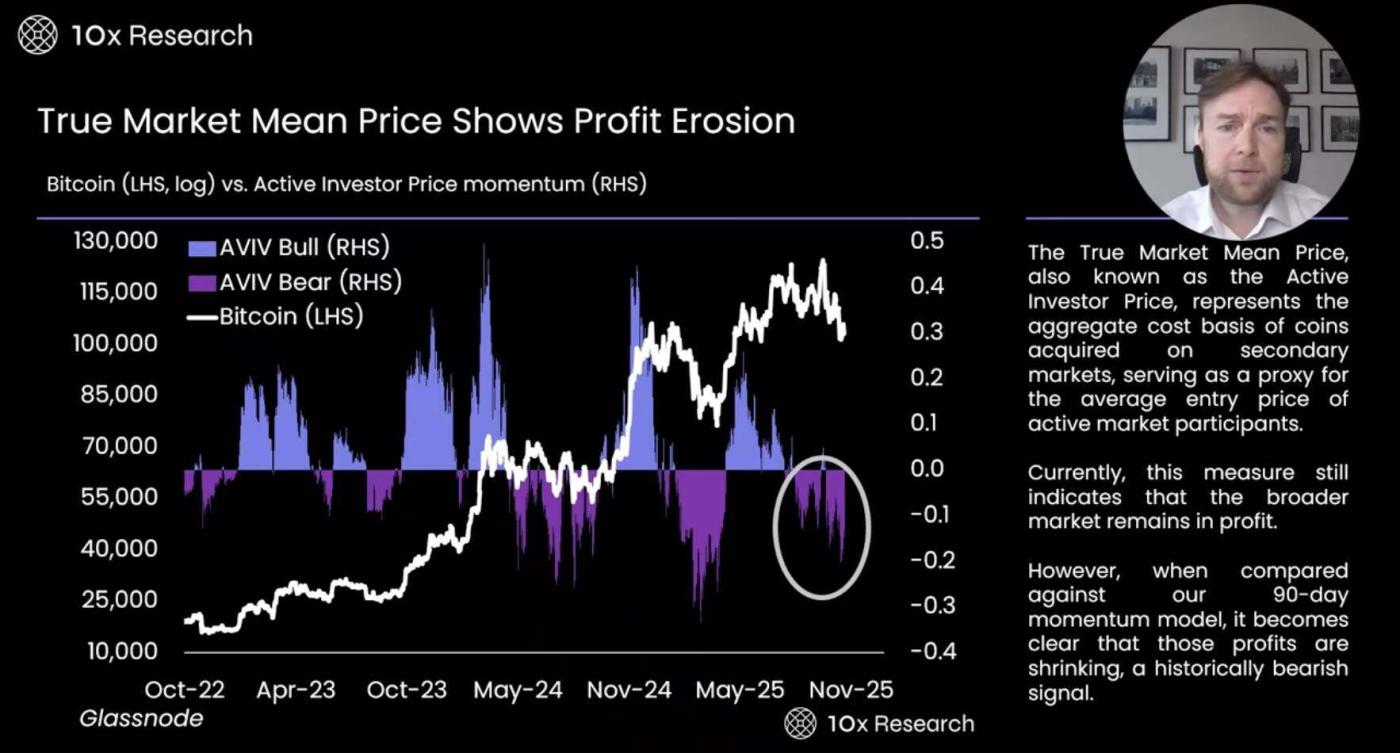
- The True Market Mean Price (MMT) is an important market metric that reflects the overall cost of buying Bitcoin in the secondary market. It can be viewed as the average purchase price paid by active investors, used to analyze the cost pressures and behavioral tendencies of market participants. When investors face losses, they typically choose to sell or liquidate their assets, a phenomenon that has frequently occurred at different stages of the market.
- It is worth noting that market activity has declined significantly since this summer, with the overall trend gradually weakening. This has put the market in a state of "hovering at a critical point." Looking back at last year's Trump election, policy uncertainty triggered a large-scale market activity, but after the tariff issue was resolved in April this year, the second wave of market activity significantly weakened. Therefore, the decline in market momentum has been faster than expected, and investor confidence has also been affected to some extent.
Three mini-bull markets – and the signs of profit exhaustion they left behind
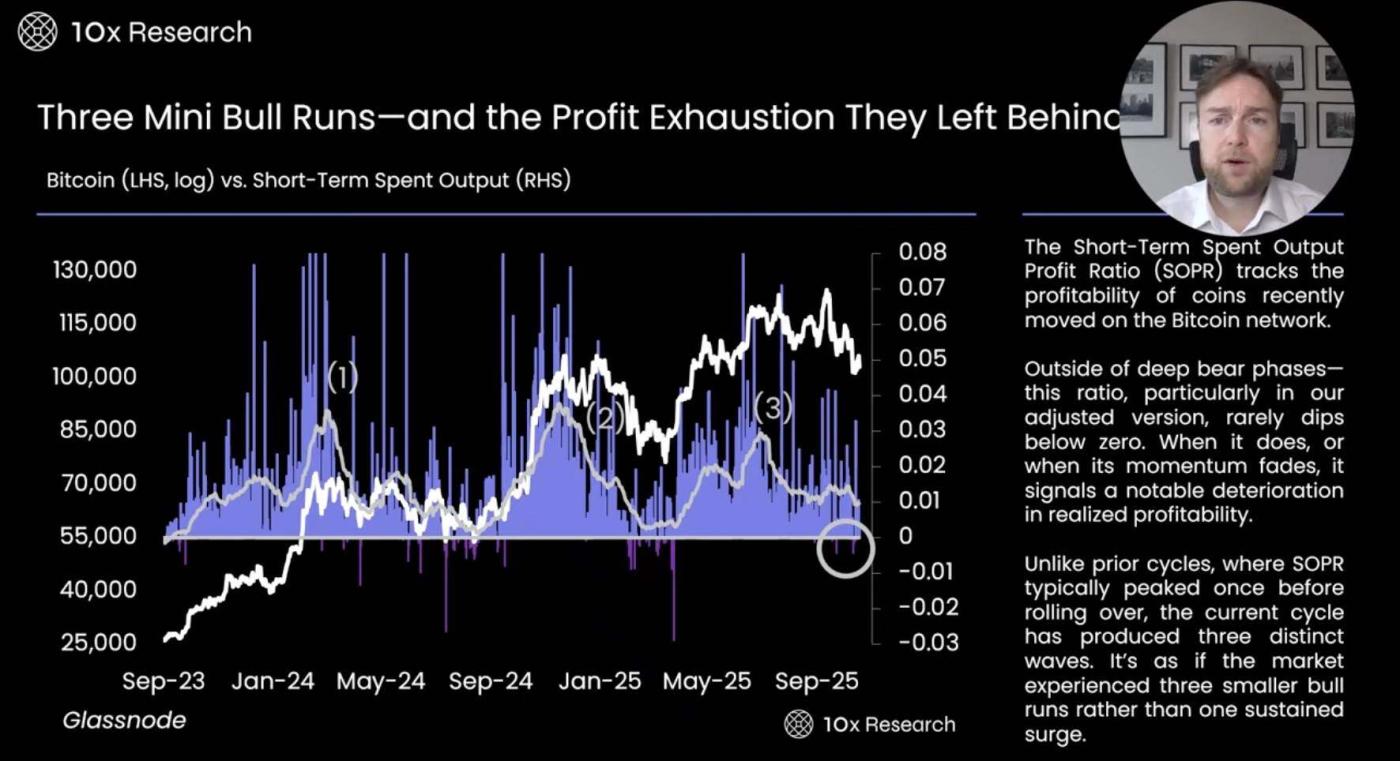
- The Short Term Spend Output (STO) metric is an important tool for tracking whether coins circulating on the Bitcoin network are currently profitable. Over the past two years, Bitcoin has experienced two to three brief bull markets, but these bull markets were short-lived and market momentum quickly weakened. As the market enters a downturn, we can observe successive price rallies, but the magnitude of these rallies gradually diminishes, indicating a decline in the strength of the market recovery.
- Historically, when the short-term spending output indicator approaches zero, it typically signifies a market bottom and a good time to buy Bitcoin. However, this indicator is currently not yet at zero, suggesting that the market's short-term profitability has not been fully exhausted, and therefore it may not be the optimal time to buy. Only when profitability approaches zero will the market bottom signal become more pronounced. At this stage, remaining on the sidelines or waiting for a clearer market signal may be a more prudent strategy.
Evidence of continued surrender and weak momentum
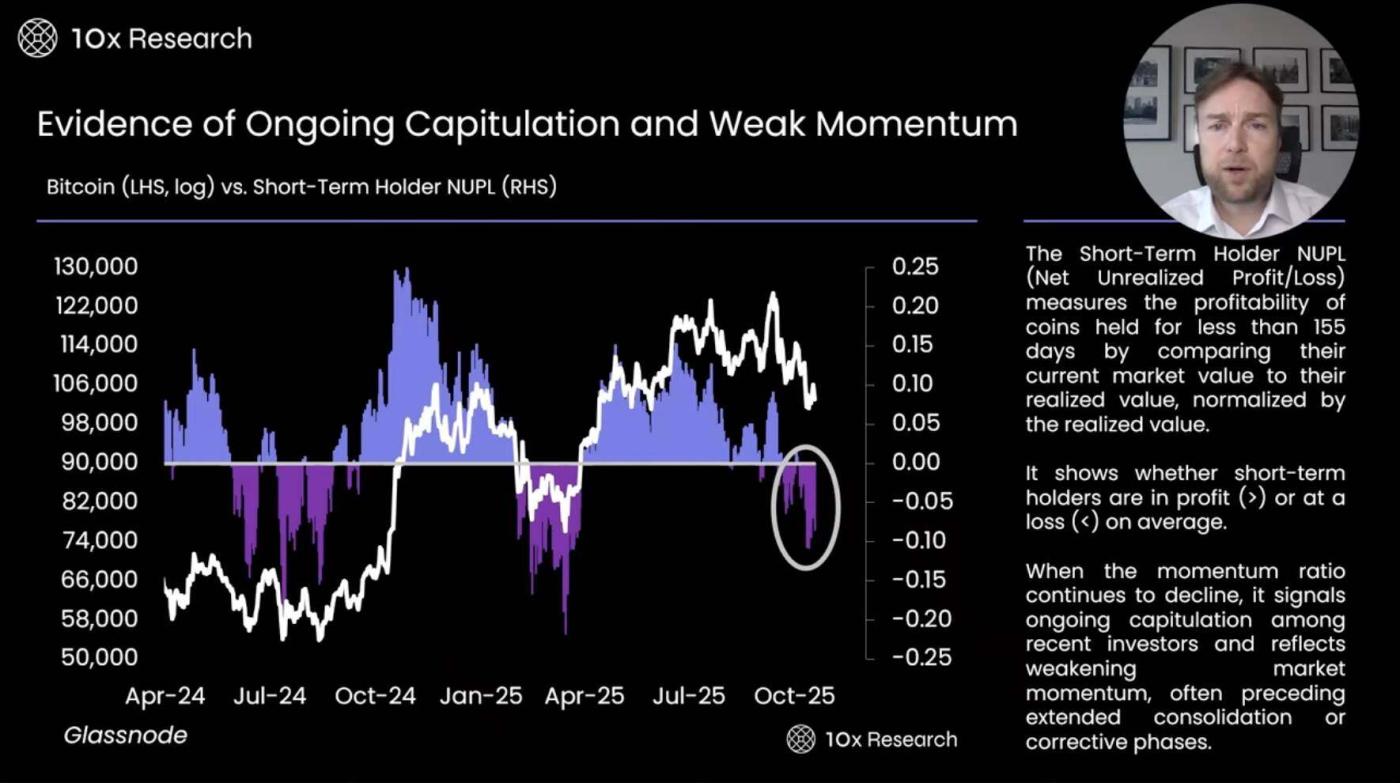
- Short-Term Holder Net Unrealized Profit is an important metric used to measure whether investors holding cryptocurrency for less than 155 days are profitable. This metric reflects the investment performance of short-term holders by comparing the current market value of the cryptocurrency with its realized value and then normalizing the comparison. Current data shows that market momentum is weakening, and there are signs of more investors engaging in "capitulationist" selling, which is consistent with the current market downturn.
- Comparing the market corrections of last summer and the first quarter of this year reveals that the current correction may last longer and be more significant. Current market prices remain considerably below historical highs, making a sustained rebound for Bitcoin unlikely in the short term. The market is likely to fluctuate within a narrow range of $110,000 to $100,000. In this environment, investors may consider profiting by selling call options and deep put options. Meanwhile, the next potential market catalyst is expected to emerge after the Federal Open Market Committee (FOMC) meeting on December 10th, at which time investors should closely monitor market developments.
The true market average price reveals the phenomenon of profit erosion.
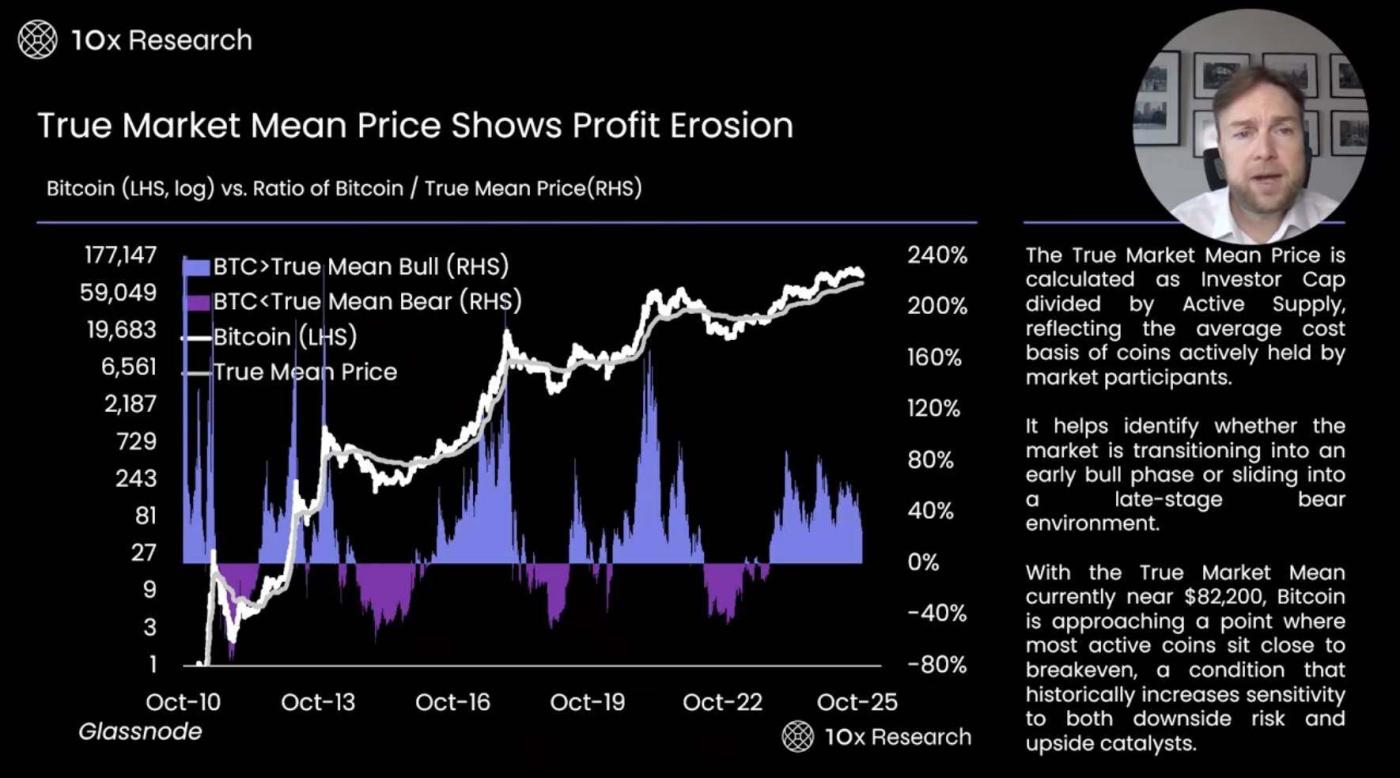
- On-chain metrics offer a more cautious market perspective. For example, the Bitcoin-to-True Mean Price ratio, calculated by dividing investor cap by active supply, measures the average cost of holding the coin for market participants. Current data shows that market momentum from short-term holders is gradually weakening, and most short-term investors are facing losses.
- Overall, the average profitability of the Bitcoin network is only 25%, a figure similar to MicroStrategy's Bitcoin purchase cost. Historically, when the price of Bitcoin falls below its true average price, the market typically enters a deep bear market. Currently, the true average price is around $82,000, a significant dividing line between the end of a Bitcoin bull market and the beginning of a bear market. If the price breaks below this level, the market may first test the key support level of $93,000. It's worth noting that during Trump's election, Bitcoin surged rapidly from $68,000 to $93,000. Trading volume was low in this range, potentially leading to a "shortcut" phenomenon—price volatility within this range lacking stable support. If this indicator is triggered, it could spark significant market volatility.
- Currently, we are more concerned that the price of Bitcoin may fall below $100,000. Based on trend models and on-chain indicator analysis, we will maintain a bearish market view as long as the price of Bitcoin remains below $113,000.
A drop to the true market average price will provide support—a bear market may begin below this level.
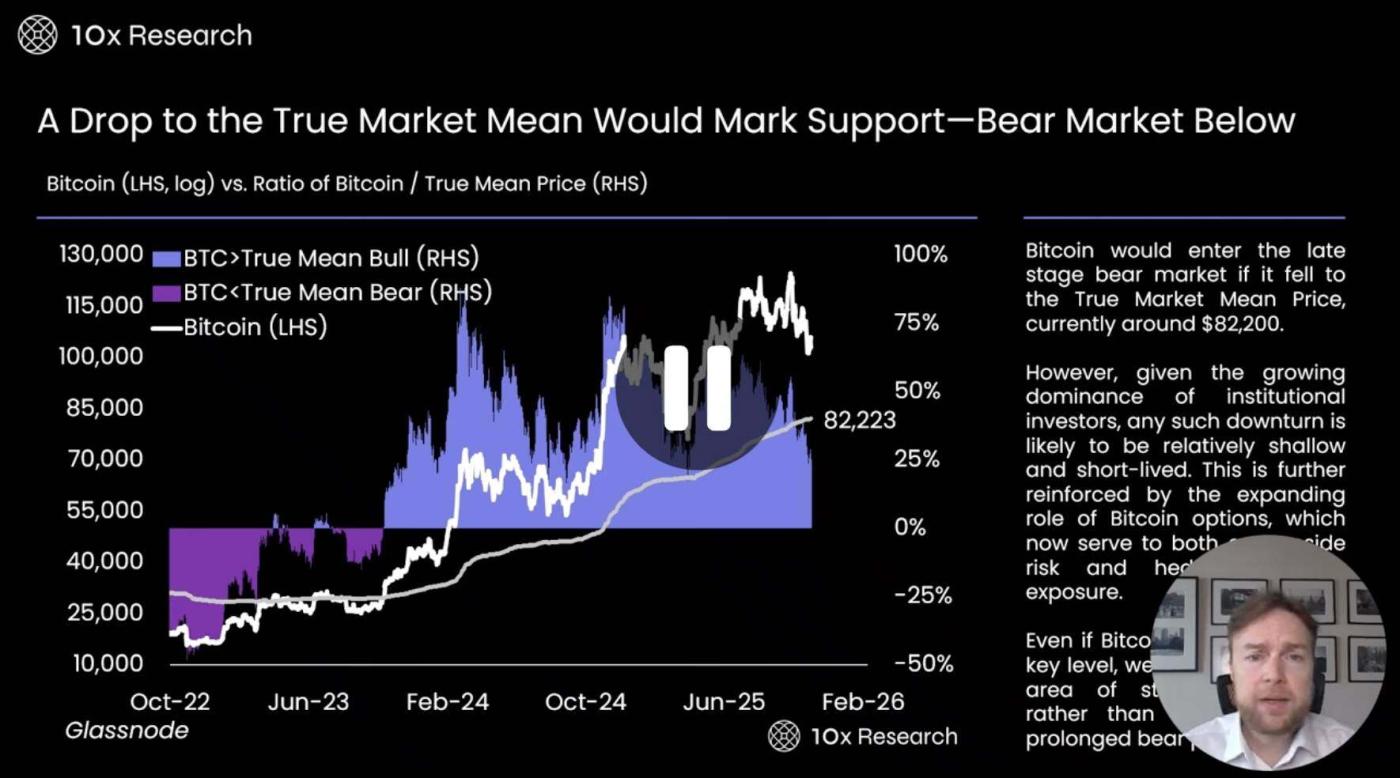
- Data further shows that the average profit margin for Bitcoin network investors has dropped sharply from 75% to 25%. This change is primarily due to active trading at the market's peak over the past few months. Early adopters (OGS) and established investors gradually sold their Bitcoin to new investors, causing a significant increase in the market's average cost, or True Mean Price. At the beginning of the year, the True Mean Price was around $50,000 to $60,000, but with the rapid increase in trading volume, this average price has climbed to even higher levels.
- A potential risk facing the current market is the influx of new investors purchasing Bitcoin in the $100,000 to $126,000 range, making the market environment more fragile. These investors may be more likely to sell when prices fall. For example, if the price of Bitcoin drops to $100,000, investors who bought at $120,000 may quickly exit due to the pressure of losses, and such selling could further exacerbate market instability. Furthermore, the average profit level of long-term holders is only 25%, which is not high relative to the total market investment, indicating relatively low overall market confidence.


