Bitcoin 2021 vs. 2025 – A Disturbing Pattern Reappears
When comparing the 2021 and 2025 charts side by side, the similarity is striking.
2021: Double Top → Black Friday → Collapse
- $Bitcoin formed a broad double top.
- A sharp correction around Black Friday marked the start of the major downtrend.
- What looked like a normal dip eventually turned into a prolonged crash that erased months of gains.
2025: Same Structure, Just at Higher Prices
- $BTC once again formed a weakening ascending structure.
- The price tapped the upper trendline and failed — very similar to 2021.
- The selloff that followed is now accelerating.
If this pattern continues to play out, Bitcoin may only be in the early stages of a larger corrective phase.
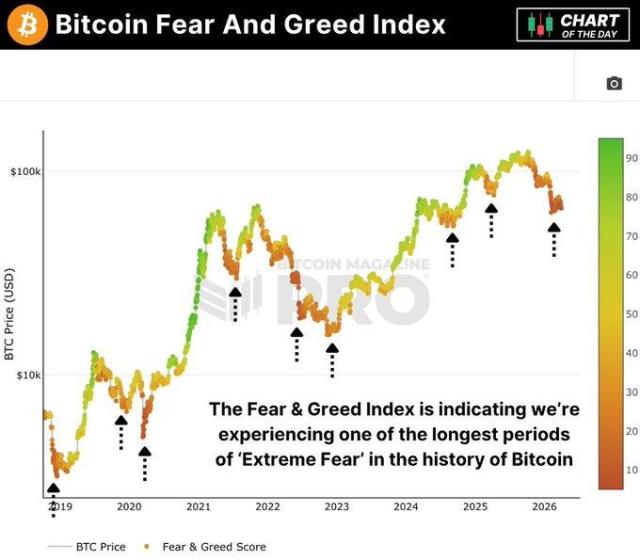
Bitcoin Now the Most Oversold Since 2023 — But the Downside May Not Be Over
The weekly RSI shows a rare signal:
Bitcoin is extremely oversold, reaching a zone last seen in 2023.
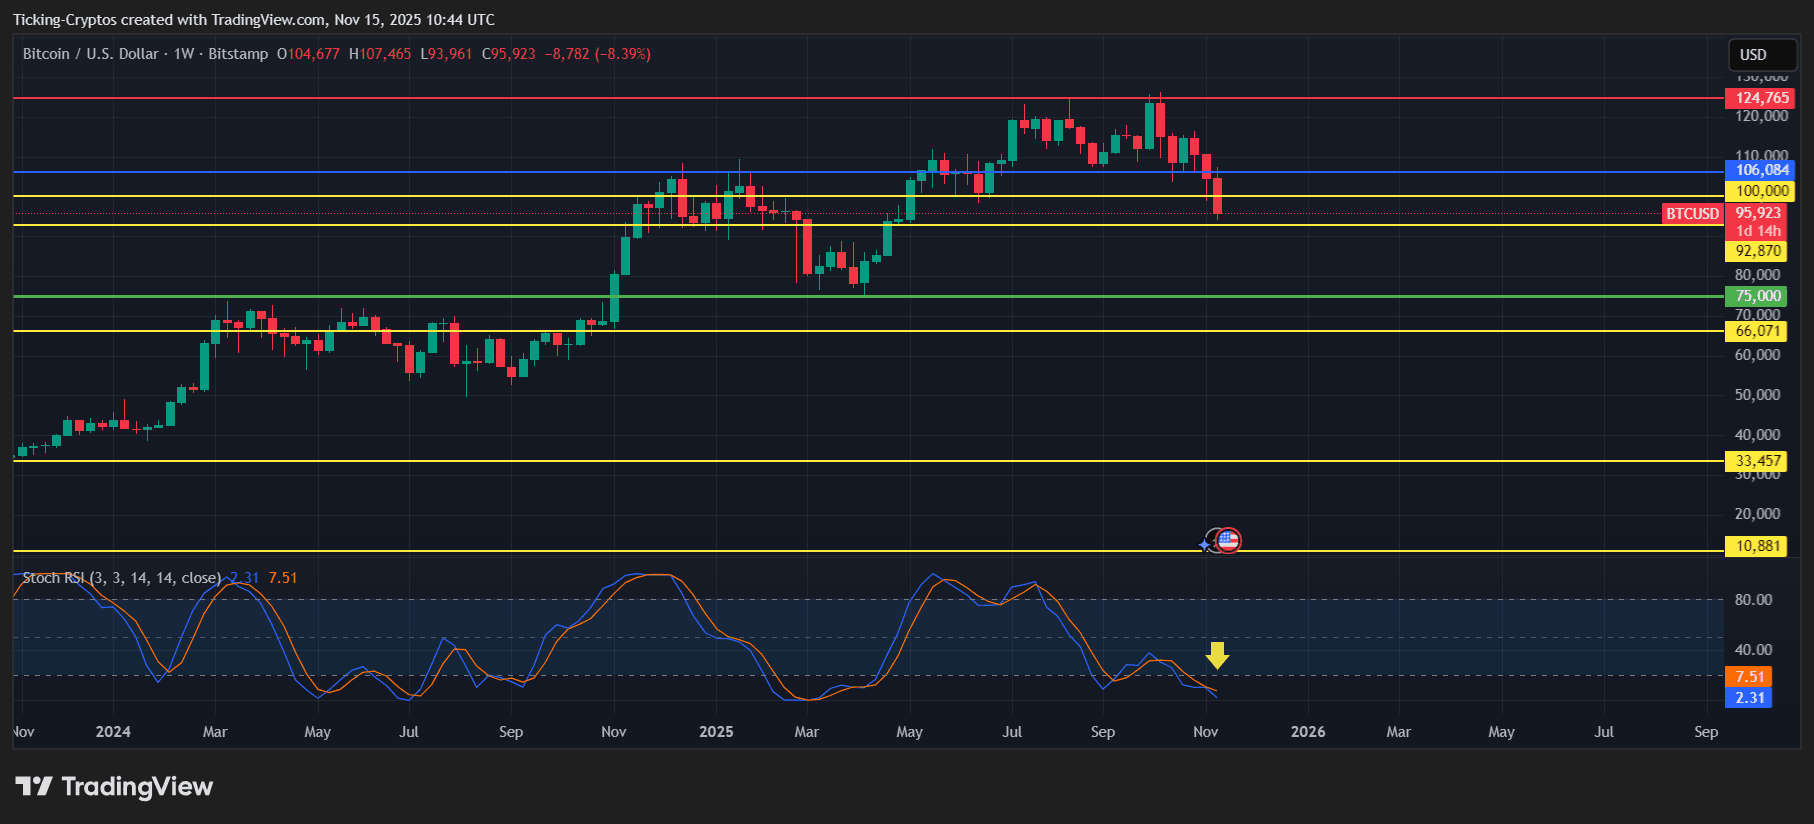
BTC/USD 1-week chart - TradingView
Historically, such readings have triggered strong reversals — but only after the downtrend exhausts itself.
During heavy crashes, these oversold periods can extend for weeks or months:
- 2018 breakdown from 6K
- 2020 COVID crash
- 2022 post-FTX collapse
This means that while oversold, Bitcoin may still fall further before forming a real bottom.
Bitcoin Chart Analysis: What's Happening to Bitcoin Price
Based on the 4-hour chart:
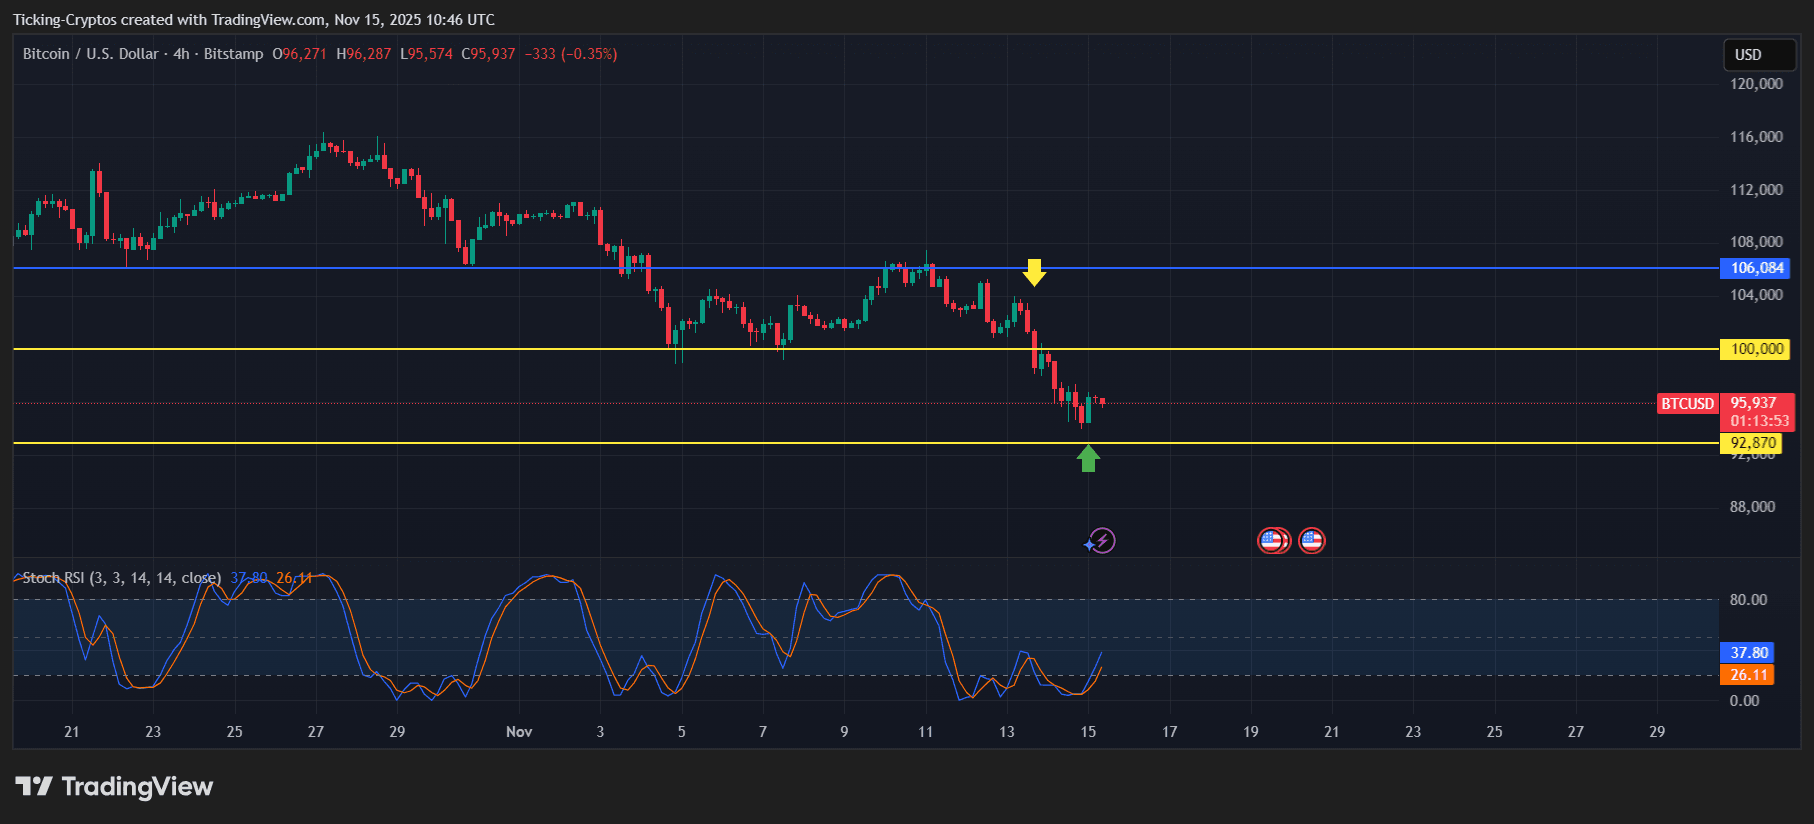
BTC/USD 4-hour chart - TradingView
1. Loss of the $100,000 support
- Bitcoin already lost the psychological 100K level convincingly.
- This triggered a wave of panic selling.
2. Price hovering above the $92,870 support
- This is the next major structural support.
- Bitcoin is attempting to stabilize here, but momentum remains bearish.
3. Stoch RSI shows a potential bounce
- A short-term relief rally is possible.
- But until higher resistance levels are reclaimed, this is likely just a temporary reaction, not a trend reversal.
Bitcoin Price Prediction: How Low Can Bitcoin Fall?
Based on trend structure, oversold momentum, and historical fractals:
Short-Term Bearish Scenario
If $92,870 breaks:
- $90,000 becomes the next immediate target.
- Breaking 90K intensifies the crash.
Medium-Term Downside Targets
- $88,000
- $82,000
- $74,000–$78,000 (typical deep-cycle bottom zone)
Bullish Reversal Scenario (less likely right now)
A meaningful recovery starts only if Bitcoin:
- Reclaims $100,000,
- Then breaks $106,000 with strong volume.
Until these two levels are recovered, the trend remains decisively bearish.