

Bitcoin is trading at $86,550 with a market cap of $1.72 trillion and 24-hour trading volume standing firm at $45.17 billion. The intraday price range of $83,402 to $86,828 paints a picture of resilient bulls and hesitant bears locking horns across multiple timeframes.
Bitcoin Chart Outlook
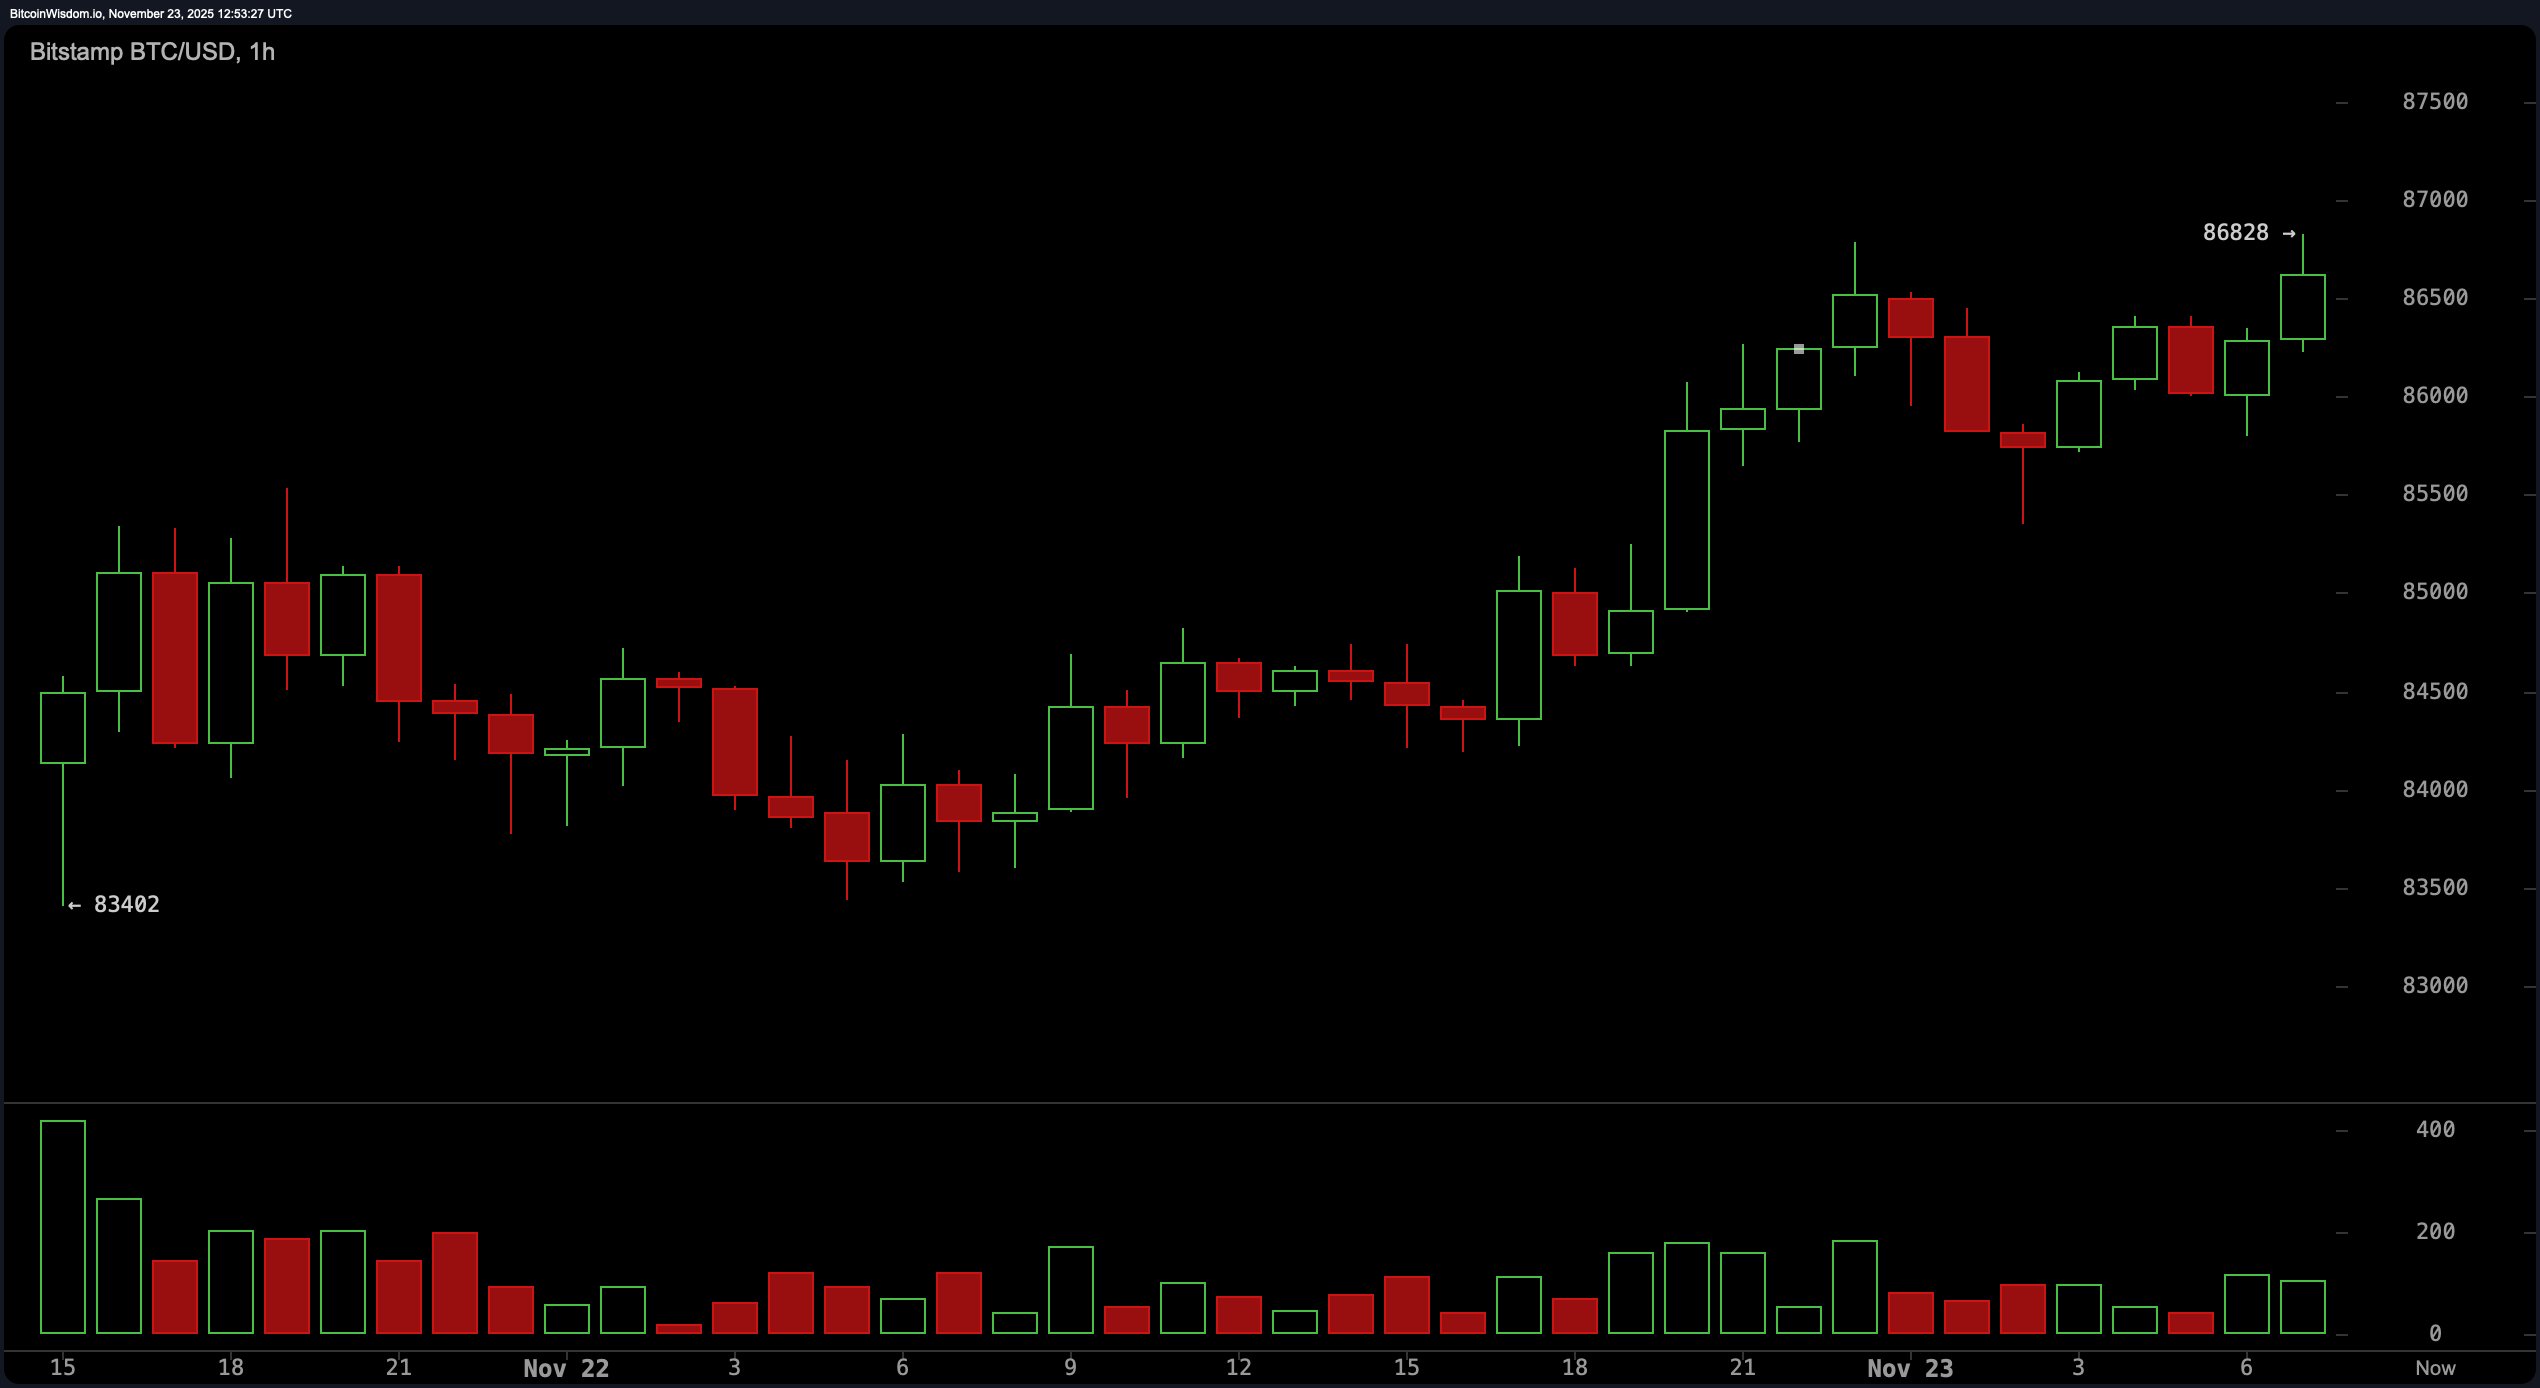
The 1-hour chart showcases a short-term uptrend, prancing with higher highs and higher lows—though the last candle at $86,828 resembles an exhaustion move, complete with a long wick and tepid volume. This implies a potential stall or minor correction before any further ascent.
Should bitcoin flirt with the $85,000 zone on declining volume, the dip could lure eager eyes hunting favorable entry points. A strong push past $87,000 to $87,500, however, could turn the tide decisively upward, provided the volume follows suit. Resistance hovers near $88,000 to $89,000—tight stop-losses are the name of the game here if momentum wanes.
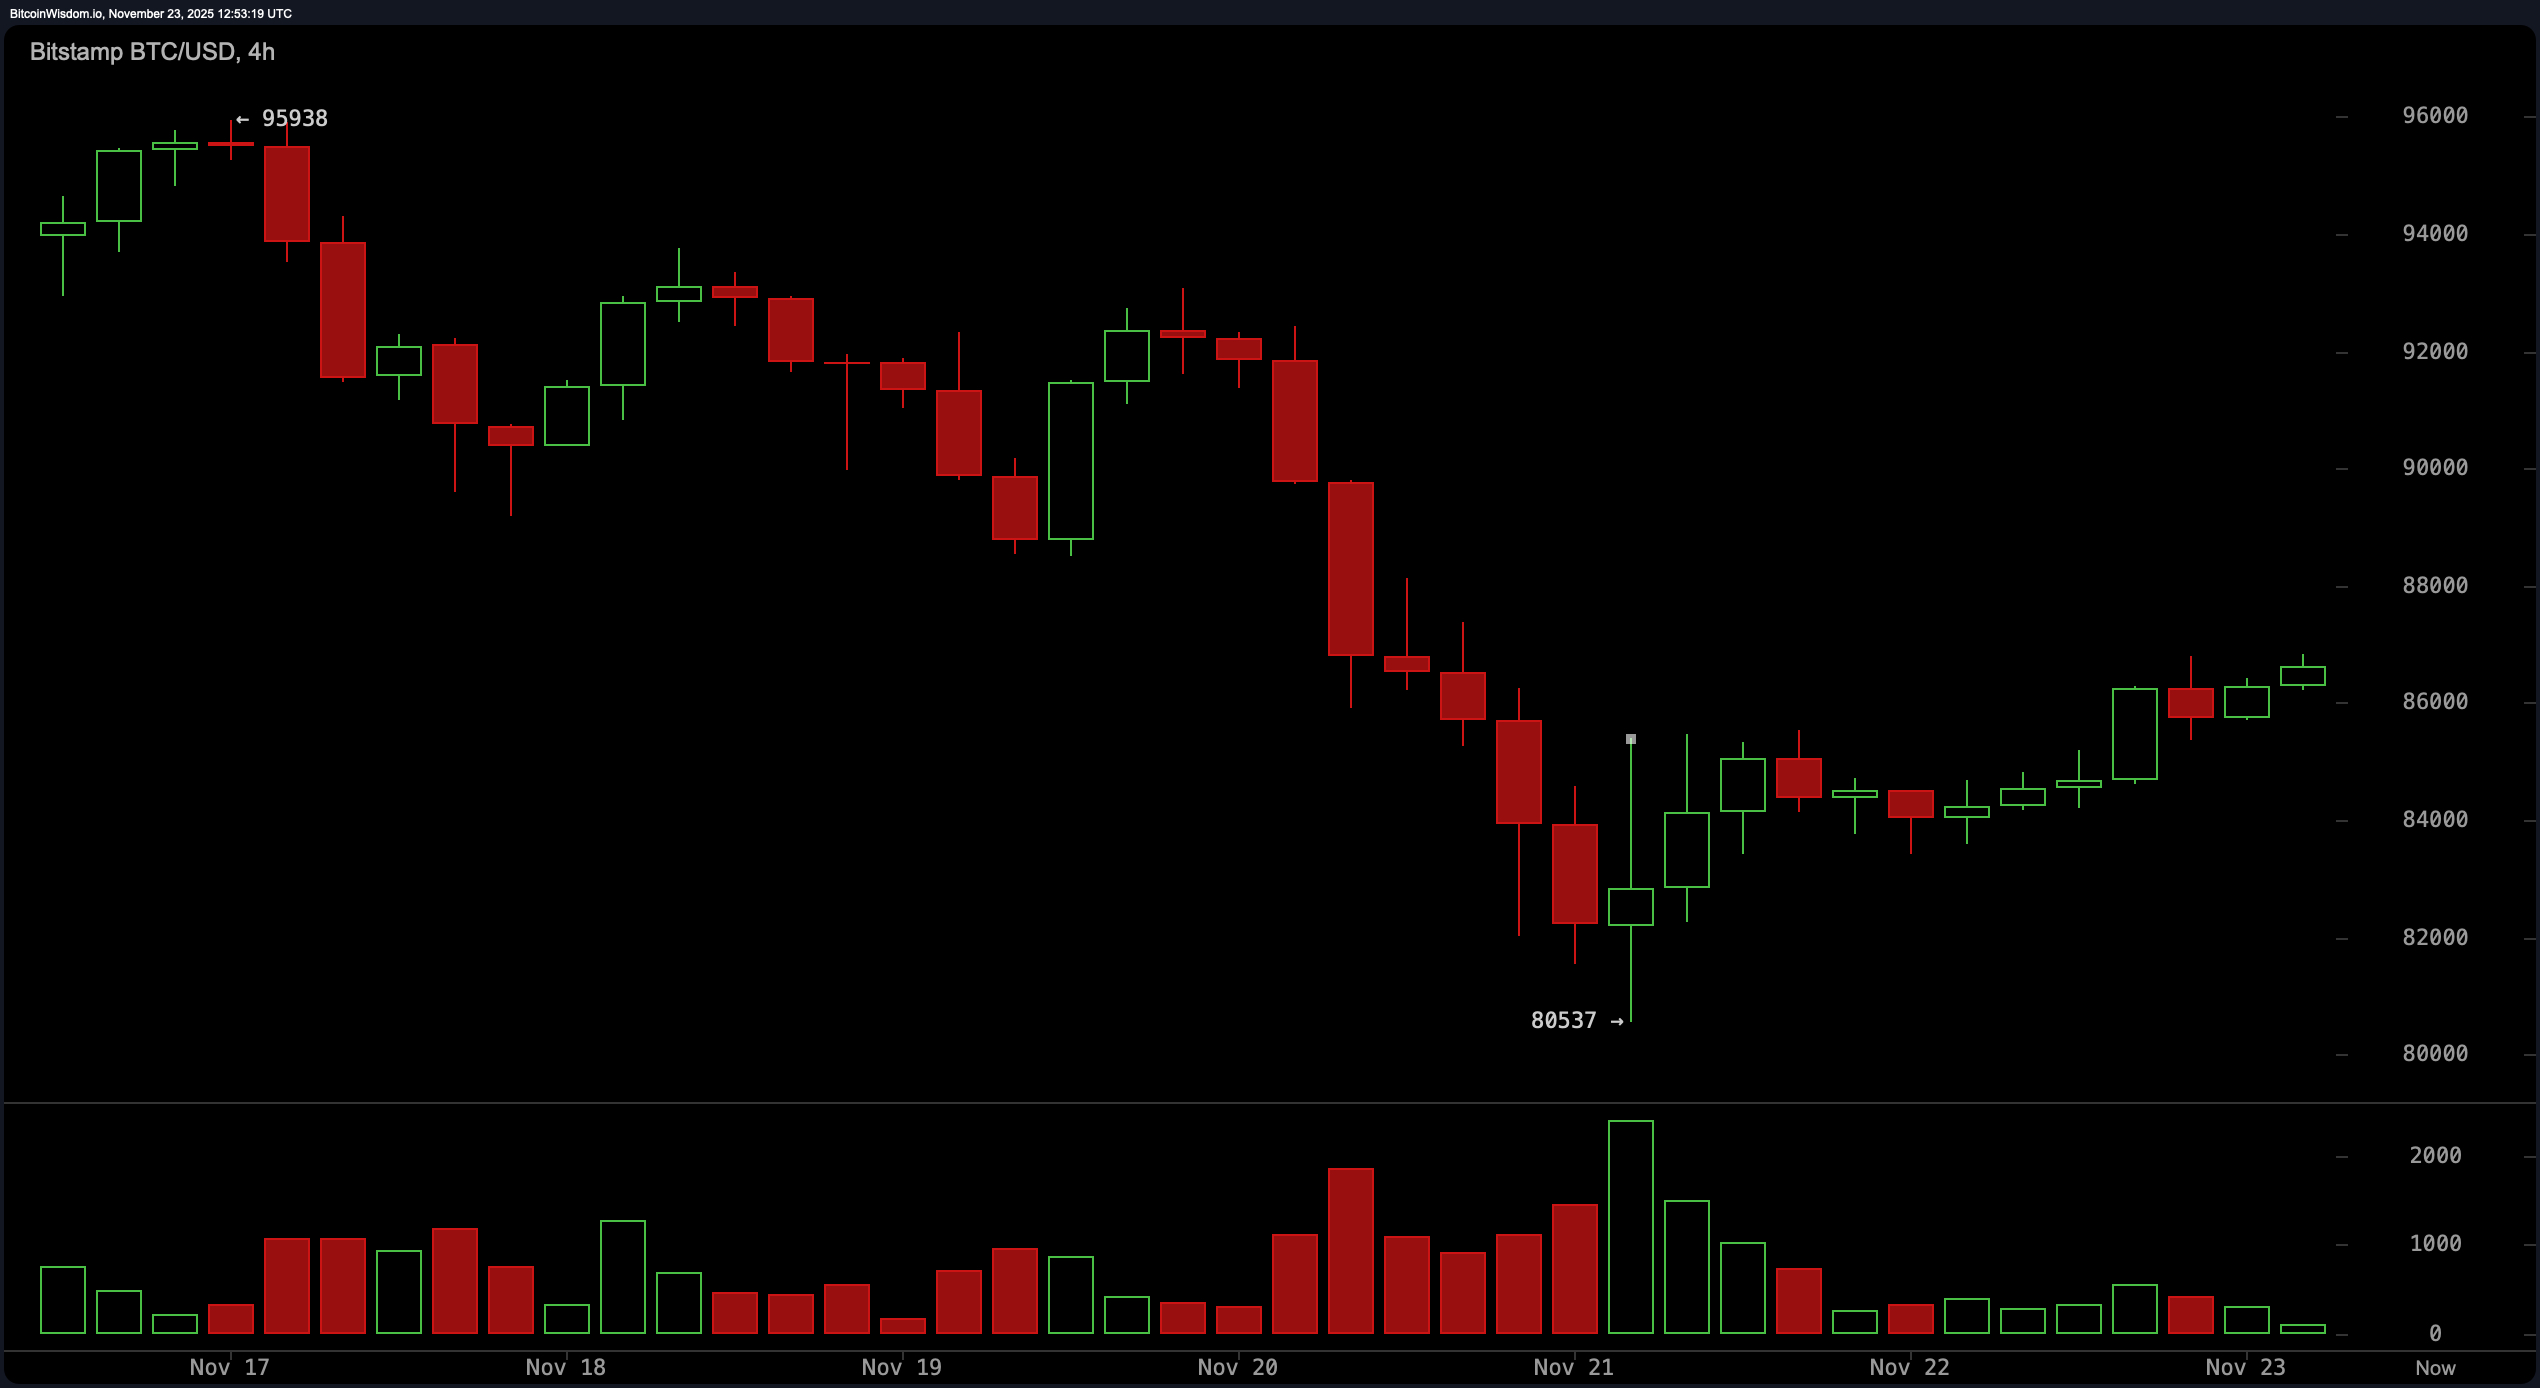
Zooming out to the 4-hour chart, bitcoin displays textbook short-term bullish momentum. Following a bounce from the $80,537 low, higher lows and consistent green candles underscore steady buying interest. Volume confirms this narrative, increasing on the upswings. Eyes are on potential pullbacks near $85,000, which may provide tactical positioning for upward continuation. Should the price clear the $87,000 to $88,000 region, a dash toward the previous ceiling at $90,000 could be on the cards—assuming no pesky lower highs crop up to spoil the party.
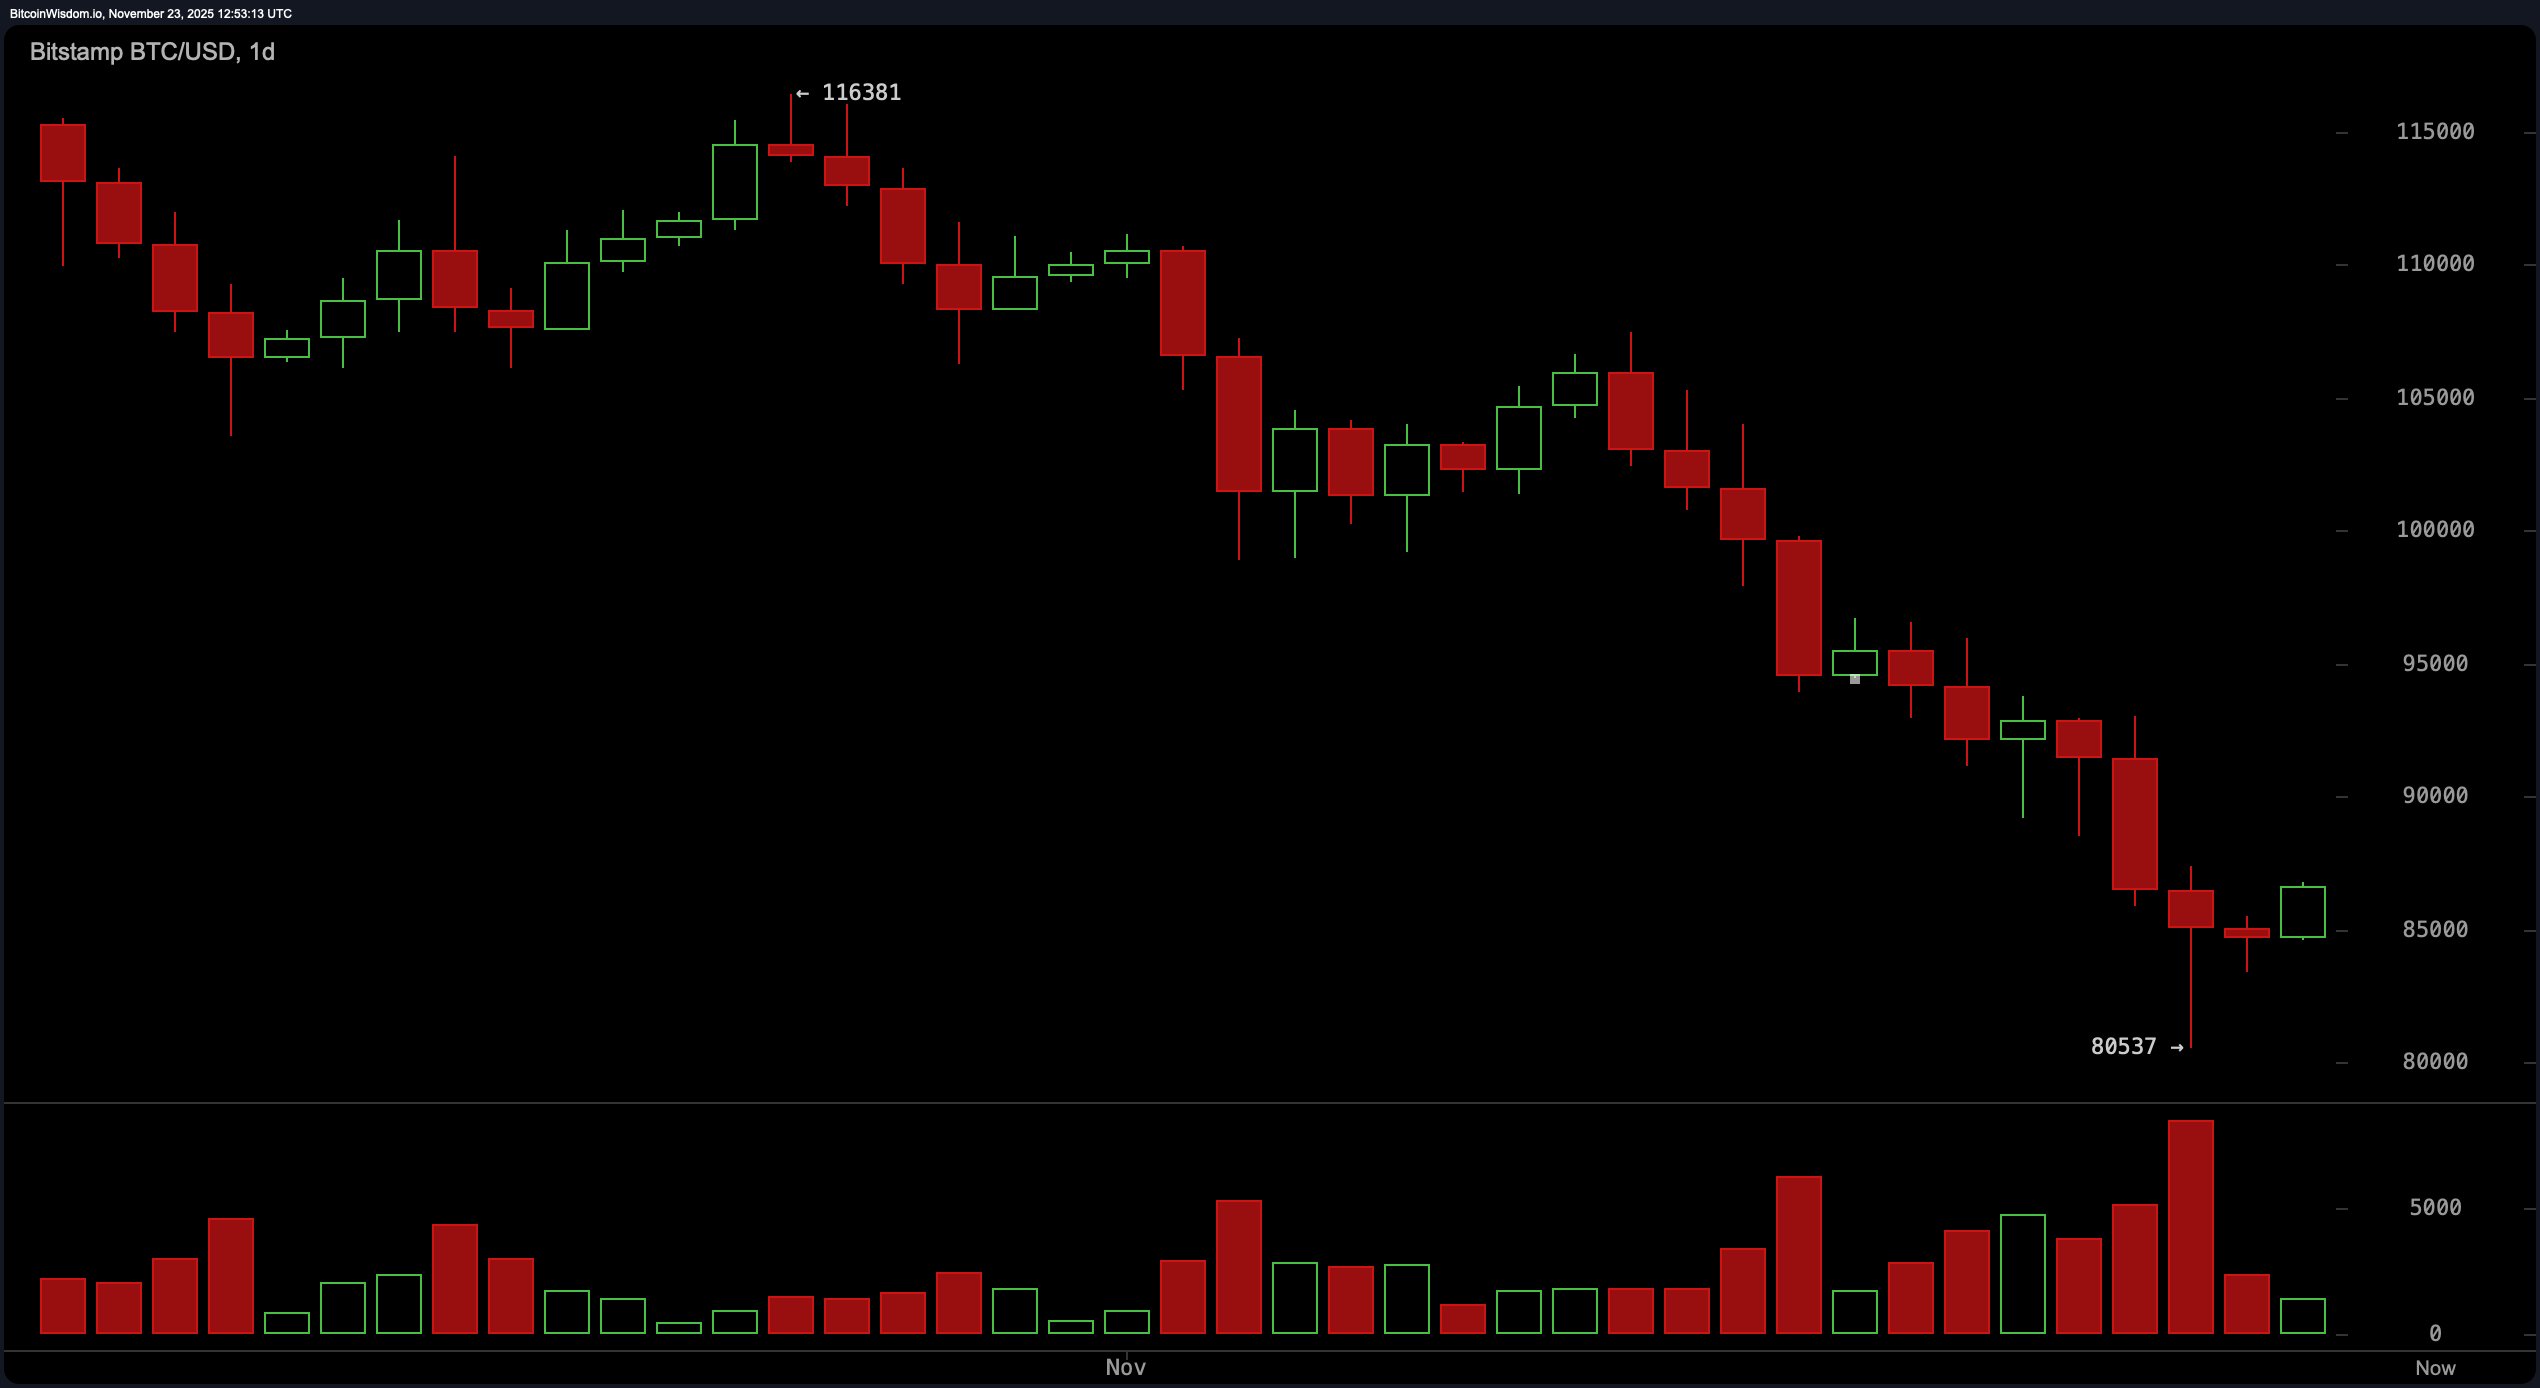
The daily chart tells a different tale. Here, bitcoin remains in a well-defined downtrend, consistently printing lower highs and lower lows. Yet, the notable volume surge near $80,537 hints at possible capitulation—classic bottom-fishing bait. The support zone between $80,000 and $82,000 remains pivotal, while resistance looms overhead at $90,000, with a tougher barricade near $100,000. A clean breakout above that first wall would suggest a change in character, but the cautious among us may demand a bullish candlestick pattern confirmation first. For now, it’s a game of wait-and-see.
Now for the tea from the oscillators. The relative strength index (RSI) clocks in at a measly 28, signaling deeply oversold conditions. Momentum, too, isn’t playing coy at −13,205, while the commodity channel index (CCI) screams from −117—both supporting the oversold narrative. Meanwhile, the moving average convergence divergence (MACD) tells a different story, lounging at −5,954 and flashing classic downside pressure. Stochastic at 18 and the awesome oscillator at −15,670 prefer to play it neutral, evidently not in the mood to take sides. The average directional index (ADX) at 46 confirms that the trend is indeed strong—just not in bulls’ favor on the broader timeframe.
Finally, moving averages are nearly unanimous in their pessimism. The exponential moving averages (EMAs) and simple moving averages (SMAs) across the 10, 20, 30, 50, 100, and 200 periods all sit well above the current price, cementing the view that bitcoin is firmly below its trend lines. For context, the 10-period EMA and SMA hover above $90,000, while the 200-period simple moving average towers at $110,210. When every major moving average lines up against you like this, you don’t need a crystal ball to know you’re swimming upstream.
In sum, bitcoin is caught in a technical tug-of-war. Short-term charts hint at a recovery, while daily indicators and long-term moving averages still hum a bearish tune. Traders, tread carefully—this dance isn’t done yet.
Bull Verdict:
The short-term uptrend on the 1-hour and 4-hour charts, coupled with oversold readings on the relative strength index (RSI), momentum, and commodity channel index (CCI), provides a hopeful setup for an upside continuation. If bitcoin can hold the $85,000 level and break through the $87,500 threshold with conviction, the door to $90,000—and potentially higher—swings open.
Bear Verdict:
Despite the bullish whispers on shorter timeframes, the dominant trend remains bearish on the daily chart, with lower highs, lower lows, and unanimous resistance from all major moving averages. Until bitcoin reclaims and holds above the $90,000 resistance zone, downside risk remains alive and kicking, with support near $80,000 still vulnerable to retests.
FAQ ❓
- Where is bitcoin’s key support level today?Around $80,000–$82,000 based on daily chart analysis.
- What signals a short-term breakout for bitcoin?A strong move above $87,500 with high volume.
- Is bitcoin oversold right now?Yes, indicators like the relative strength index (RSI) and commodity channel index (CCI) confirm oversold conditions.
- What’s the current trend on the daily chart? Bitcoin remains in a strong downtrend with resistance near $90,000.


