

Moving average indicators
Simple Moving Average (SMA)
Exponential Moving Average (EMA) .
Detailed Explanation
I. Settings
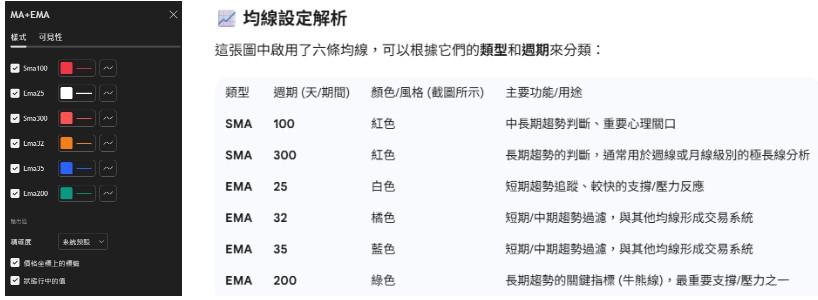
Indicator Logic
The analysis logic used in this configuration covers the short, medium and long term.
1. Identify trends (long-term moving averages)
- Long-term trend: mainly look at the SMA 300 and EMA 200.
The EMA 200 is a crucial "bull-bear dividing line" in technical analysis. Prices above it are considered a bullish structure (bullish), and below it are considered a bearish structure (bearish).
- The SMA 300 represents the market cost over a very long period and is usually used to determine the trend direction of a large cycle.
- Medium- to long-term trend: Primarily look at the SMA 100. Used to determine a relatively stable medium-term direction that lasts for several months.
Therefore, if the moving averages are in a bullish alignment (values arranged from smallest to largest from top to bottom), we go long; conversely, we go short. If the moving averages are in a mixed alignment, it indicates a consolidation phase, so we don't trade.
2. Trading Signals and Swing Trading (Short-Term Moving Averages)
- Short-term swings: Use a set of similar short-term moving averages: EMA 25, 32, 35.
- Fast trading system: Three close EMAs (e.g., 25/35) can form a moving average band or moving average crossover system.
- Buy signal: When a shorter timeframe (e.g., EMA 25) crosses above a longer timeframe (e.g., EMA 35) (golden cross).
- Sell signal: When a shorter timeframe crosses below a longer timeframe (death cross).
- Because EMAs react to price changes faster and more sensitively than SMAs, this set of moving averages is particularly suitable for capturing short-term swing trading opportunities and quickly judging changes in market sentiment.
3. Use both SMA and EMA simultaneously.
This is a common professional analysis technique:
- SMA (100, 300): Provides a relatively smooth and stable trend indication and important price levels. SMA generates fewer false signals.
- EMA (25, 32, 35, 200): Used to quickly track prices, improve system sensitivity, and ensure that trading decisions can reflect the latest market conditions more promptly.
Practical application methods
1. Moving averages exhibit the characteristic of "oscillating between moving averages" (alpha).
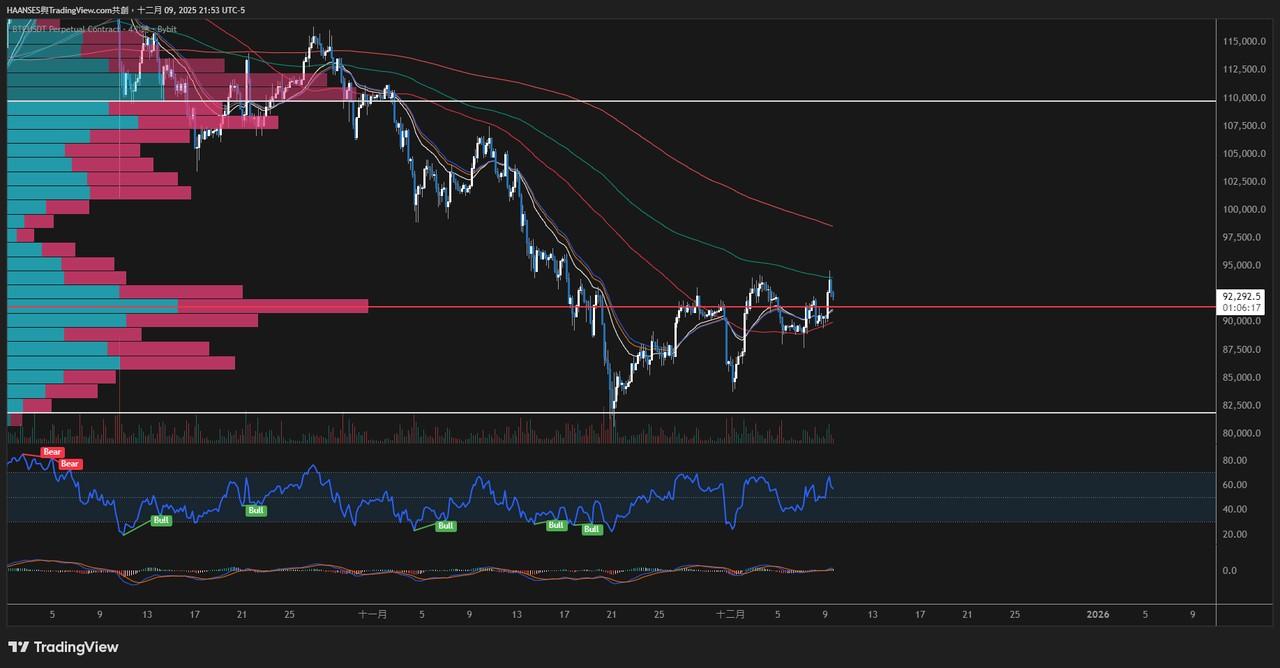
The chart above shows the 4-hour moving averages. The short-term moving averages are converging and fluctuating, currently encountering resistance at the 4-hour EMA200.
We must look at the moving average situation in different timeframes.
The chart below shows the status of the daily moving average.
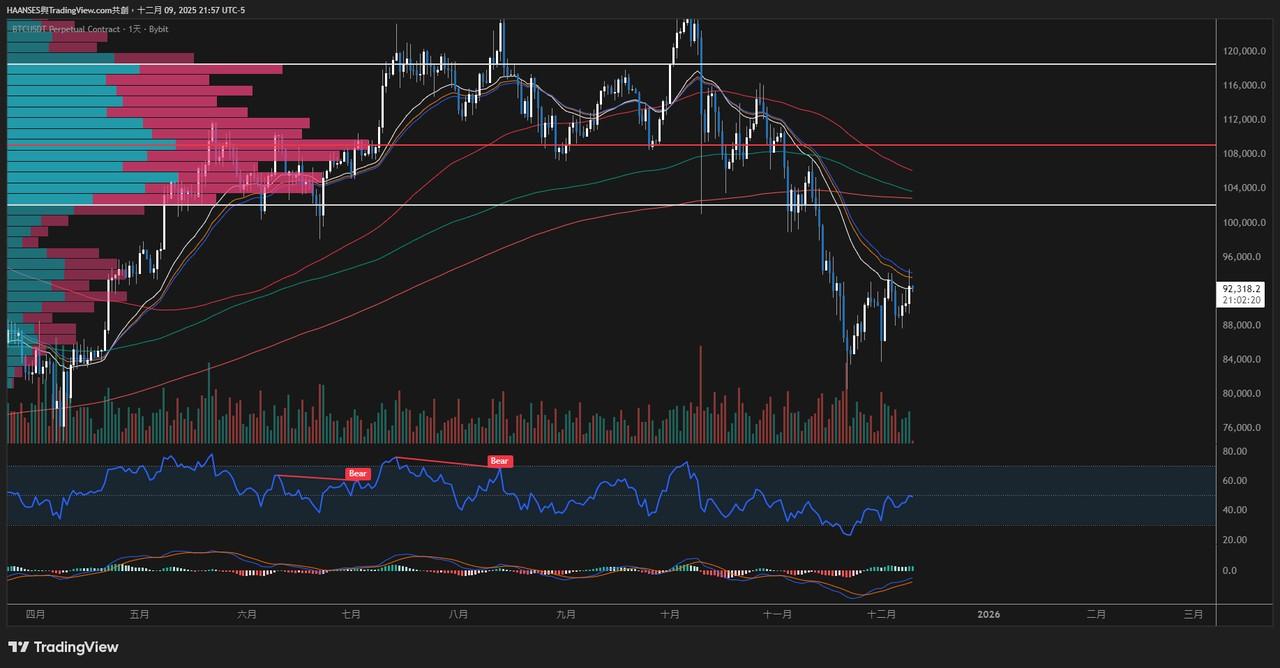
It is clearly in a bearish formation and is being suppressed by short-term moving averages.
Therefore, we now have two conclusions.
1. Under pressure on the daily chart.
2. It is oscillating on the 4-hour chart and is being suppressed by the EMA200.
If we want to increase our position at this point, what conditions need to be met?
1. Breaking upwards above the short-term moving average on the daily chart and heading towards the VAL range.
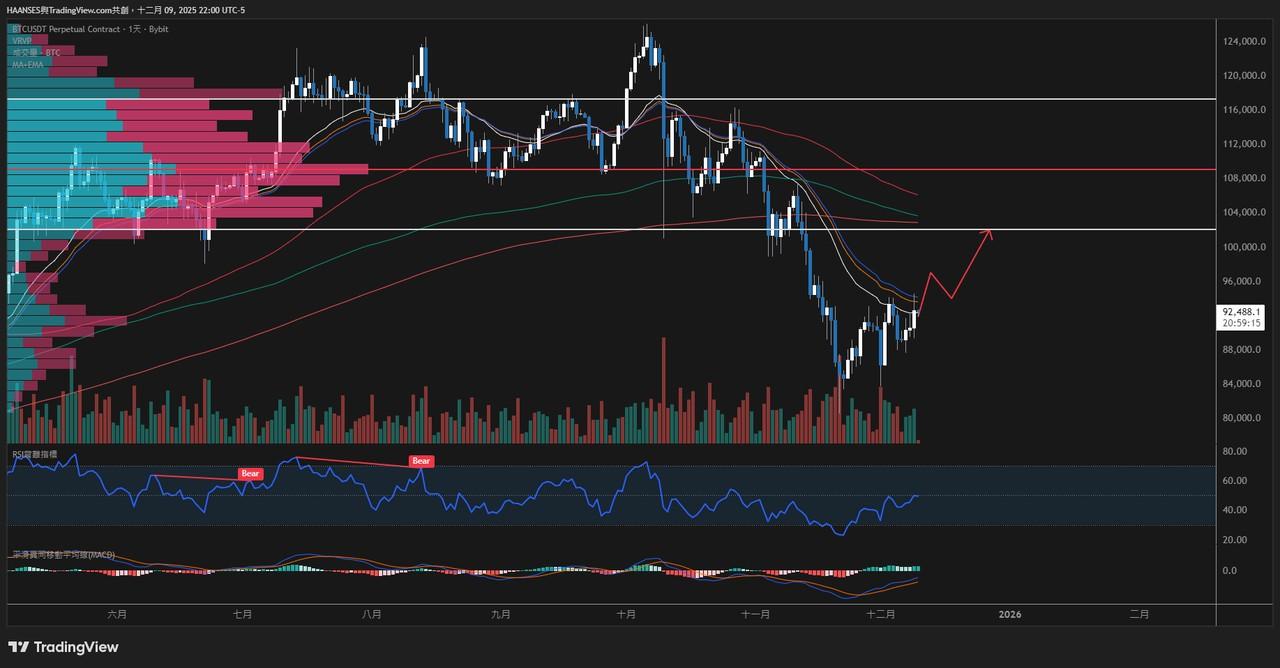
2. Similarly, the price must overcome the EMA200 resistance level within 4 hours to successfully reach higher points. 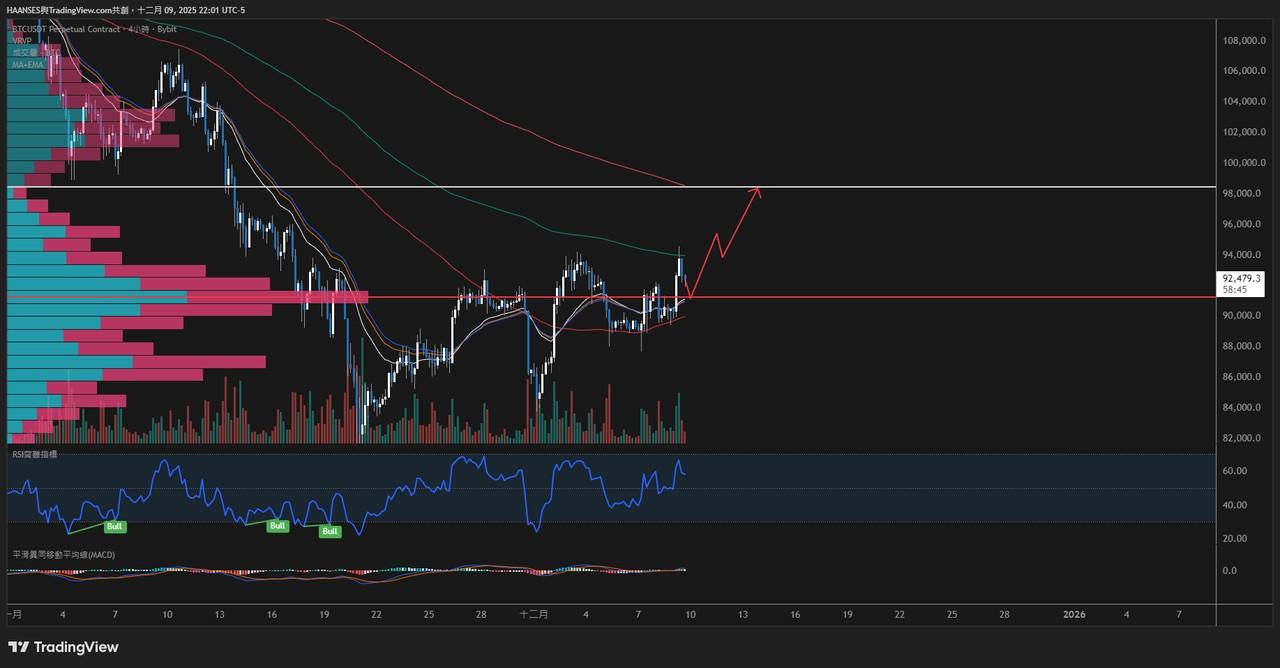
As mentioned earlier, moving averages have the characteristic of "oscillating between moving averages".
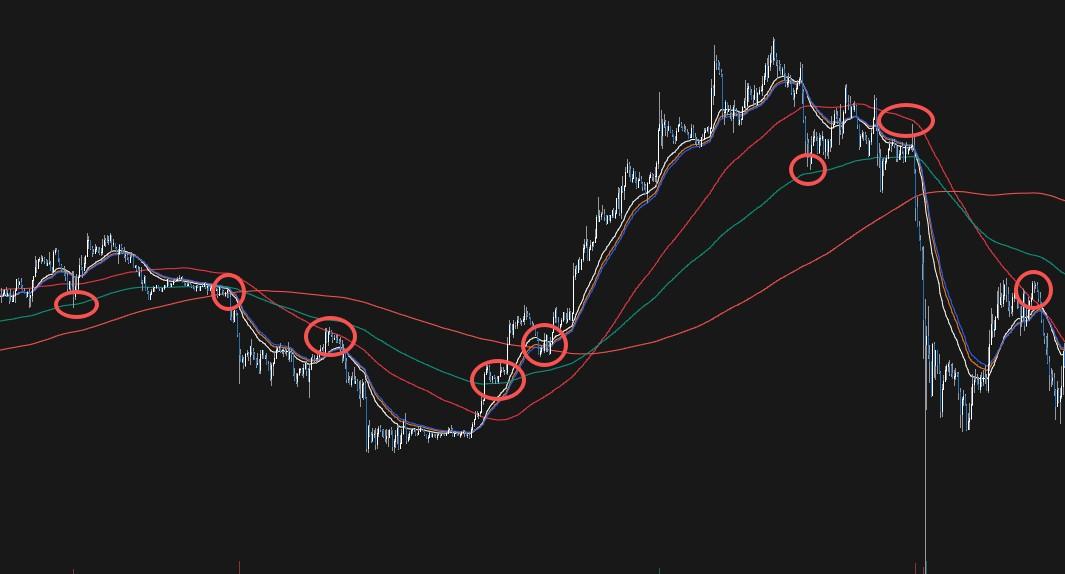
This means that the price will oscillate between different cost lines such as short-term moving averages, 100-day moving average (SMA), 300-day moving average (SMA), and 200-day moving average (EMA200) to find consensus. For example, it might retrace to EMA25, rise, encounter 100-day moving average (SMA), break through EMA200, and then encounter resistance at EMA200. It might then retrace to 100-day moving average (SMA), break through EMA200 again, and then encounter resistance at 300-day moving average (SMA300), and so on.
This means that the price will oscillate between different cost lines such as short-term moving averages, 100-day moving average (SMA), 300-day moving average (SMA), and 200-day moving average (EMA200) to find consensus. For example, it might retrace to EMA25, rise, encounter 100-day moving average (SMA), break through EMA200, and then encounter resistance at EMA200. It might then retrace to 100-day moving average (SMA), break through EMA200 again, and then encounter resistance at 300-day moving average (SMA300), and so on.
The moving average will oscillate around different average costs.
So what we need to figure out is which time frame we are currently "respecting".
For example, currently the trend is to "respect" the moving averages on the 4-hour and daily charts.
Using a 2-hour timeframe (see image below) makes things unclear because there's no reliable reference point.
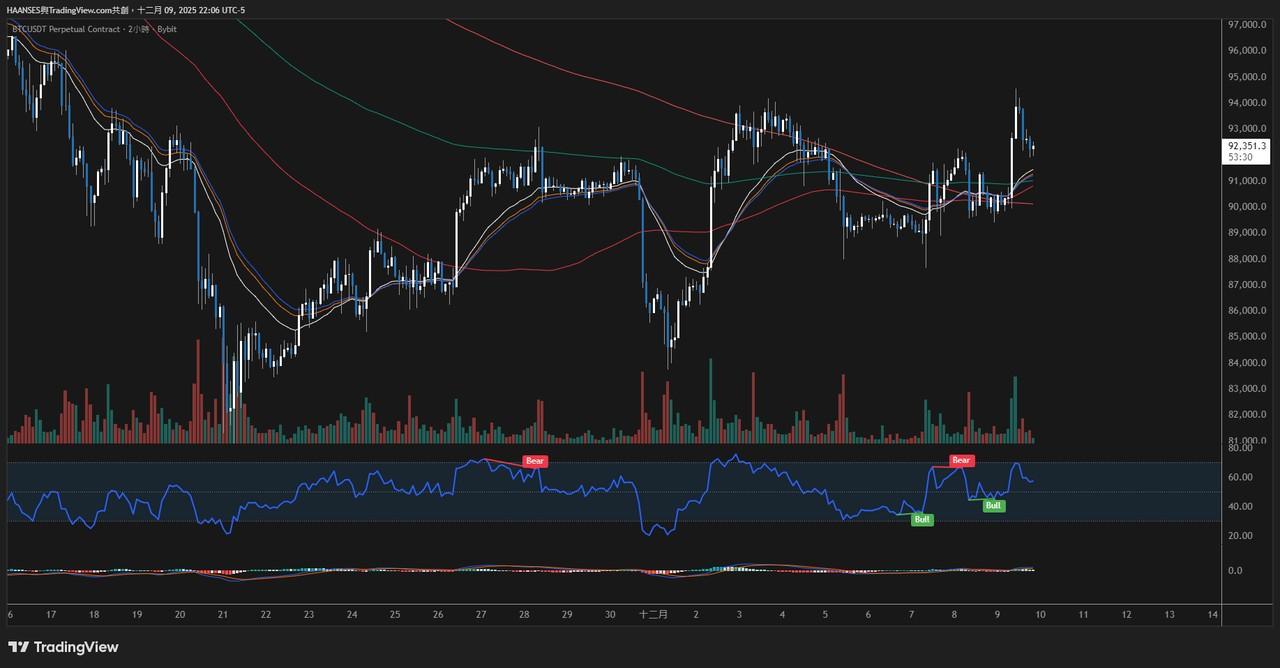
Therefore, we need to first identify which time frame we are respecting in order to use the moving average of that time frame for judgment, and then combine this with the VRVP method mentioned in the previous article to find the resonance node.
This will increase the probability of accurately judging support and resistance levels!
In the next article, we'll talk about trends!


