

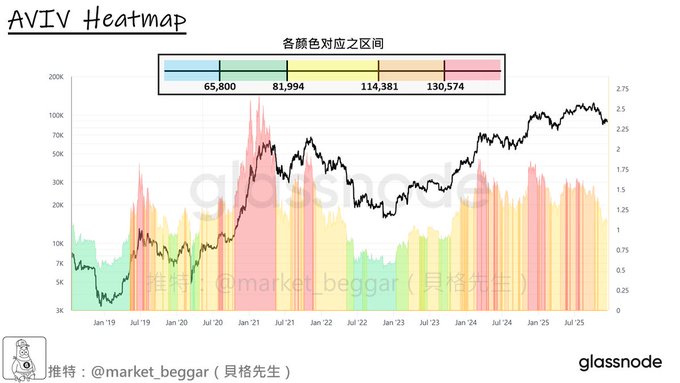
AVIV Heatmap latest update: Is the green zone finally coming?❓ It’s been a month since the last update, so here’s a fresh look at the AVIV Heatmap numbers. As BTC’s cycle thermometer, AVIV Heatmap has consistently delivered solid signals. If you’re new to this indicator, check out my previous tutorial 🔗: x.com/market_beggar/status/194...… Let’s dive straight in👇 Quick refresher on the core concept of AVIV Heatmap📊: ➡️ Full name: AVIV Heatmap, a model I personally designed ➡️ AVIV stands for “Active Capital’s Profit Multiple”, think of it as an upgraded MVRV ➡️ AVIV Heatmap leverages AVIV’s mean reversion property for its model ➡️ Concept inspired by Cointime Economic methodology (Ark & Glassnode) As shown in the attached chart, the current AVIV Heatmap zones are: 🔴 Red: “Above 130,574” 🟠 Orange: “114,381 ~ 130,574” 🟡 Yellow: “81,994 ~ 114,381” 🟢 Green: “65,800 ~ 81,994” 🔵 Blue: “Below 65,800” 💬 Reminder: These numbers are dynamic, not fixed. As I’ve mentioned many times: Since the bear market bottom, every major correction in this cycle has NOT seen BTC hit the “green zone” on the Heatmap. A month ago, after my shallow bear scenario post on 11/21, BTC dipped to around 80K, but since AVIV Heatmap is based on closing price, the green zone didn’t show up. Compared to last month’s numbers (see quote below), the upper limit of the green zone is still around 82K. With yesterday’s US market dip, BTC is now hovering near the green zone again. With this “recovery phase” approaching one month and volatility heating up, I expect we’ll soon get clearer direction❗️ Combining recent signals, including: ➡️ STH-NUPL bottoming structure (x.com/market_beggar/status/199...…) ➡️ The missing Stop Hunt on the technicals (x.com/market_beggar/status/199...…) ➡️ TMMP resonating with the green zone (x.com/market_beggar/status/200...…) My personal bias: Next move will likely be a Stop Hunt targeting the 11/21 previous low (80.6K), then a push higher📈 If that plays out, expect massive liquidations and a clean sweep of leftover liquidity below, flushing out weak hands—ideal and healthy base-building structure🔋 Of course, if 80.6K breaks without a Stop Hunt, that’s a different story... That’s all for today—hope this helps🫡 // 📚 Related reading: Shallow Bear Bottom Playbook: Extreme deep pullbacks may be gone for good x.com/market_beggar/status/199...… Shallow Bear Bottom Analysis Series (All) - A concise summary x.com/market_beggar/status/199...… No Fear of Deep Bears: Four god-tier bottom-picking tools on standby x.com/market_beggar/status/199...… Strong Bottom Signal: Stablecoin supply ratio market analysis x.com/market_beggar/status/199...… New Buyers Returning: Waiting for “conviction buyers” to trigger a bullish combo x.com/market_beggar/status/199...… // 【Shill Time】 “If you’re stacking stables but not ready to catch the bottom yet...💰” Here’s a solid yield option: Bitget Wallet Onchain Finance ✅ Long-term APY = 10%, sourced from AAVE + Bitget Wallet subsidies ✅ Stablecoin (USDC) savings, start from just 1 USDC, redeem anytime ✅ Transparent, no rehypothecation, no loop lending, low risk If you’re interested, register with my invite code👇 Invite code: “3jTNi6” (manual binding required)
This article is machine translated
Show original

貝格先生
@market_beggar
11-14
AVIV Heatmap 最新數值更新:黃金坑合理價格評估🍯
承接上篇 AVIV Heatmap 的分析內容(https://x.com/market_beggar/status/1980811244123877400…),
今天再來和各位報告一次 AVIV Heatmap 的現況。
同時,我將結合「偏離度調整的 STH-RP」一併評估合理的黃金坑價格;
並且我亦將於本文詳述未來可能出現的「兩種大型修正劇本」👇:
From Twitter
Disclaimer: The content above is only the author's opinion which does not represent any position of Followin, and is not intended as, and shall not be understood or construed as, investment advice from Followin.
Like
Add to Favorites
Comments
Share
Relevant content


