

Compiled by: Block unicorn
Vaults are one of the concepts in the cryptocurrency space that everyone thinks they understand, mainly because they seem simple and straightforward. However, simplicity is often deceptive. Beneath the surface, vaults have quietly become one of the most misunderstood yet strategically important fundamental elements in the entire ecosystem.
In the DeFi summer, "Vault" was simply a clever UI built around automated yield farming. Yearn packaged tedious and manually-intensive operations—such as switching between different yield farms and compounding governance tokens—into an almost magical experience. Simply deposit funds, and the strategy does all the work automatically. It's an internet-native abstraction that works.
But 2025 will be completely different.
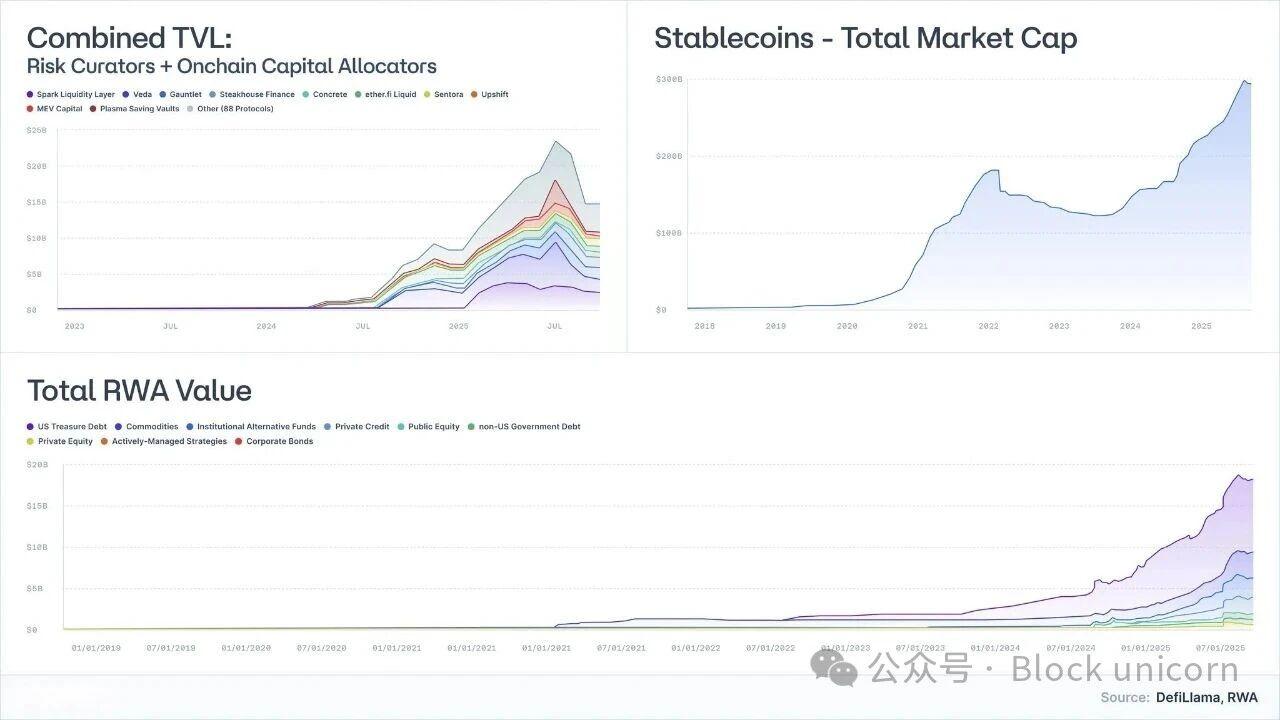
Tokenized government bonds have evolved from an experiment involving tens of millions of dollars to an asset management scale of nearly $9 billion, with institutions such as BlackRock, Franklin Templeton, and Société Générale becoming active participants.
Risk-weighted assets ( RWA ), excluding stablecoins, have reached a scale of tens of billions of dollars.
Stablecoins themselves have a market capitalization of over $300 billion, and the maturity of issuers has also increased significantly .
The industry of risk curators and onchain allocators, which was virtually unknown just a few years ago, now has nearly 100 companies managing more than $20 billion in assets.
The view that vaults are merely "yield machines" is outdated. Vaults are evolving into fund wrappers, serving as programmable simulation tools for money market funds, structured credit, and (increasingly) hedge fund strategies.
However, there is a dangerous misconception here:
Most vaults are marketed as yield-generating instruments. But in economic terms, they are risky products.
The collapses of projects like Stream and Elixir clearly demonstrate this. When the industry treats structured credit as a product equivalent to the US dollar, the consequences are predictable: poor risk management, cascading decoupling, and systemic fragility in lending agreements.
This article aims to reshape people's understanding of vaults: what vaults actually represent, how they map to real-world asset classes, and why "low-risk DeFi" is not a flash in the pan, but the next frontier in global financial accessibility.
1. A vault is essentially an investment portfolio with APIs (Active Portfolio Investment).
Stripped of UI and marketing elements, the concept of a vault is actually quite simple:
A portfolio building engine encapsulated in an API.
Assets are deposited into a vault (stablecoins, Ethereum, risk-weighted assets).
Strategy execution (lending, collateralization, hedging, leverage, mining , selling volatility, underwriting credit).
Programmable interfaces are used for depositing and withdrawing funds; sometimes they offer predictable liquidity , and sometimes they do not.
This is the entire vault.
If a traditional financial professional hands you a letter of intent to invest in a fund, you would immediately ask:
Is this cash? Credit? Equity? Or some other rare asset?
What are the liquidity characteristics—daily, weekly, or quarterly?
What would happen to my principal if an extreme event occurred?
Cryptocurrencies completely skip this step. We're talking about annualized yield (APY), not risk levels.
In the front end of decentralized finance (DeFi), five distinct strategies ultimately boil down to the same seemingly appealing card:
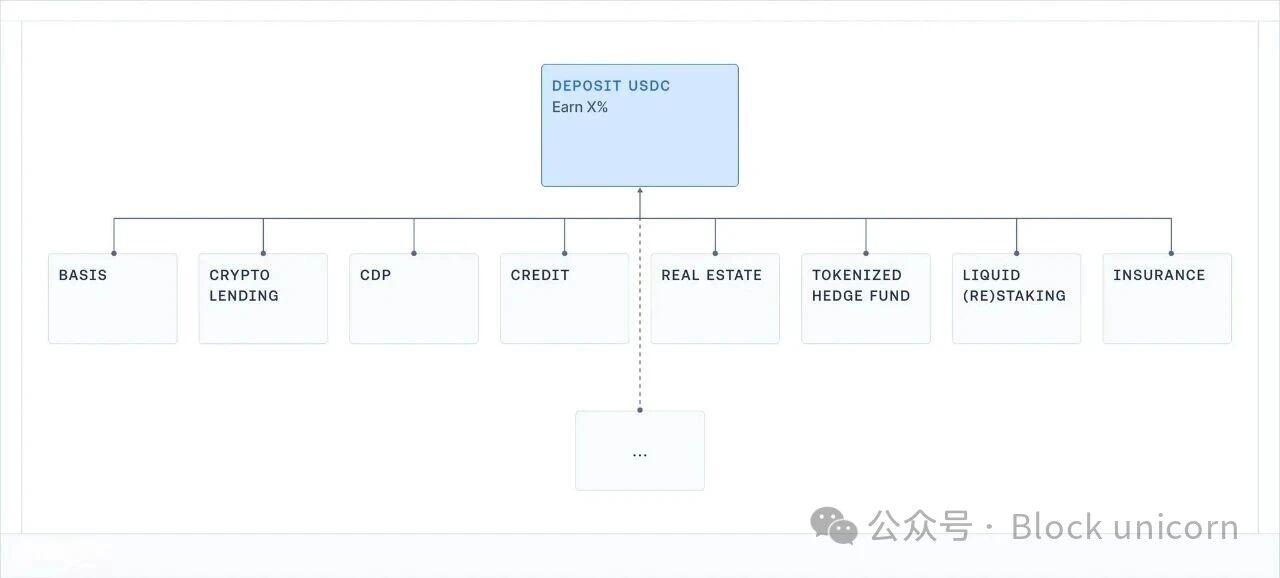
The vault is the gateway to anything on the chain.
The missing part is the most crucial one: what risks did I actually take?
Contract risk? Counterparty risk? Basis risk? Leverage risk? Credit risk? Or all of the above?
Ultimately, this lack of transparency comes at a cost: retail investors may incur risks they are unaware of or do not understand, and suffer unexpected losses (and may even attract the attention of regulators); institutional investors will simply glance at it and give up, disappointed by the lack of professionalism and transparency standards.
Furthermore, using yield as the sole competitive benchmark has had another devastating impact on risk management: agreements and risk managers are taking on more and more risk in order to compete with each other.
This situation must change as cryptocurrencies enter the institutional era.
2. What are the actual benefits you receive? The benchmark in the real world.
If we want to understand the yield of DeFi vaults, we need a benchmark:
What kinds of returns have been obtained from different types of risks in the historical and real world?
For nearly a century, researchers have been collecting data on core financial asset classes.
Aswath Damodaran maintains an authoritative data series on U.S. stocks, bonds, and short-term Treasury bills dating back to 1928, while the Global Investment Returns Yearbook tracks long-term returns in major countries since 1900.
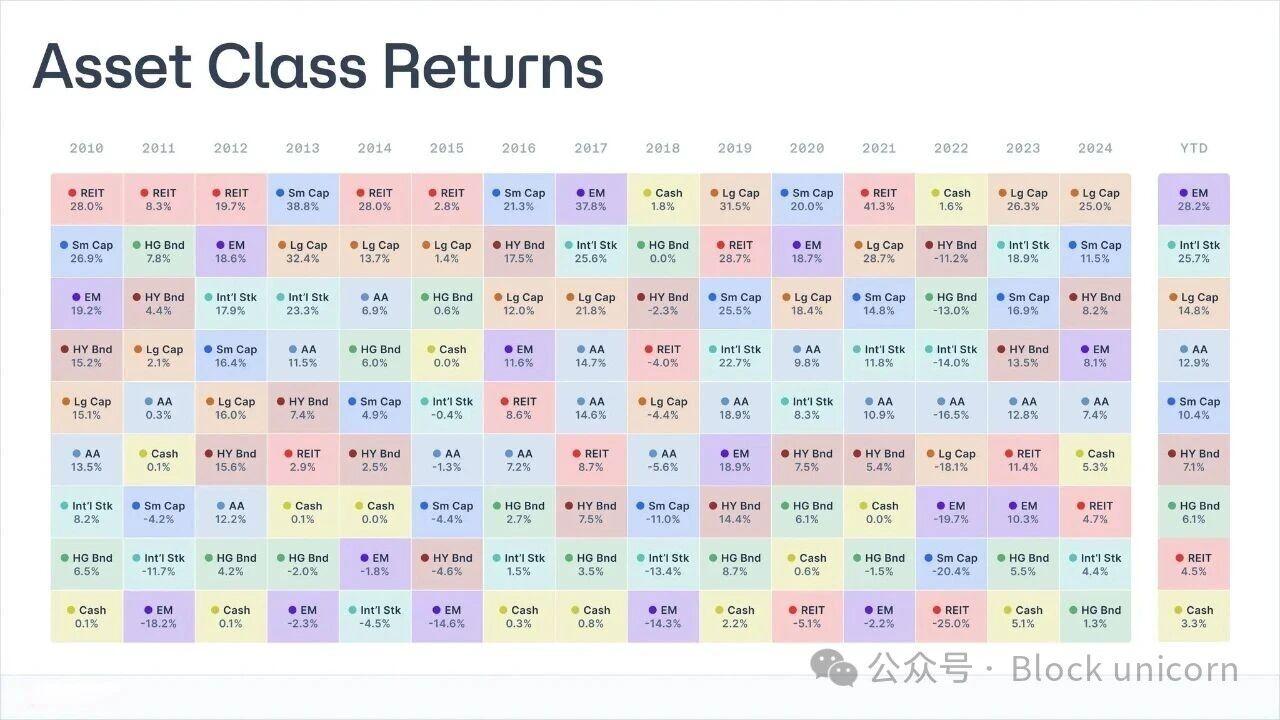
In these data sets, the situation is remarkably consistent:
Stocks (S&P 500): Approximately 9.9%
Small-cap stocks: approximately 11.7%
High-yield corporate bonds: approximately 7.8%
Investment-grade bonds: approximately 4.5%
Cash/Short-term Treasury bonds: Approximately 3.3%
Real estate: Approximately 4.2%
Gold: Approximately 5%
During this period, the inflation rate averaged around 3%, resulting in a real return that was about 3 percentage points lower than expected. These figures are not precise predictions for the future, but they broadly reflect trends that may emerge in the long-term economy.
Every return comes with a series of risks and trade-offs, which are borne by the corresponding holder.
2.1 Cash / Short-term Treasury Bonds: Rewards for waiting
definition
In practice, it is the investment target in the financial system that is closest to the "risk-free" benchmark (short-term US government bonds, money market funds).
Historical returns
The nominal yield is approximately 3.3% (the real yield after adjusting for inflation is 0-1%).
Investment returns: Essentially, since credit risk is virtually nonexistent and term risk is extremely low, investment returns are based solely on the time value of money.
Trade-offs: Inflation can quietly erode income and purchasing power; after deducting costs and frictions, long-term real returns are close to zero.
Essentially, these investments are better suited for storing cash than for achieving compound growth of wealth.
2.2 Bonds: Receiving compensation for lending funds.
definition
Debt issued by governments and corporations varies in quality. You lend money in exchange for interest and principal repayment.
Historical returns
The nominal yield on investment-grade bonds is approximately 4-4.6%;
The nominal yield of high-yield bonds ("junk bonds") is approximately 6-8%.
return on investment:
Credit risk: The possibility of borrower default or loss (“junk bonds” carry a higher risk);
Maturity risk: Sensitivity to changes in interest rates;
Liquidity risk, especially in non-mainstream or low-rated bonds.
Trade-offs: When interest rates rise, the performance of bond portfolios may decline sharply (cyclical sensitivity, such as the historic lows in bond yields in 2022); when inflation soars, real yields may be low or even negative; credit events (restructuring, default) may result in permanent capital losses.
The term "bonds" encompasses a range of financial instruments with varying risks and returns: assessing the debtor's financial situation is the basis for determining the exact level of risk.
2.3 Stocks: Rewards derived from growth fluctuations
definition
Holding shares in a company. Benefiting from profitability, innovation, and long-term economic growth.
Historical returns
US stocks (S&P 500 index): Nominal return is approximately 9.9-10%, and real return is approximately 6.5-7%.
return on investment:
Business risk: The company may go bankrupt;
Profit cycle: Profits fluctuate with the economy, and the contribution of dividends to overall returns may decrease;
Volatility and drawdowns: Even in developed economies, large daily market capitalization fluctuations are normal.
Trade-offs: While global equities generally outperform bonds and short-term government bonds in the long run, corrections of 30% to 50% over several years are not unusual (as seen in Japan ’s lost decade or Europe’s from 2000 to 2018), especially when inflation is taken into account.
2.4 Real Estate: Income + Leverage + Local Risk
definition
Real estate that generates and generates revenue: residential, commercial, logistics, etc.
Historical returns
The long-term average nominal yield of the U.S. housing index is about 4% to 4.5%, and the real yield is about 1% to 2%.
return on investment:
Revenue risk and economic cycle: Returns depend on whether tenants can continue to pay rent on time, while rental income will decrease with fluctuations in the economic cycle;
Local economic risk: Risk exposure from investments in specific cities, regions, and industries;
Leverage and volatility risks: Mortgage loans and debt financing can amplify both gains and losses;
Liquidity risk: Transactions in real estate and many real estate-related instruments are slow and costly, especially during periods of stress .
Weighing the trade-offs:
You cannot immediately "list" a property for sale; selling or refinancing can take weeks or months, and even listed real estate investment trusts (REITs) can experience significant drops when the market is under pressure.
Declines in interest rates, credit, or local demand (e.g., decreased demand for office space due to working from home) could simultaneously impact revenue and valuation.
When interest rates rise or lenders tighten lending, the cost of rolling over debt can be high.
Investment portfolios are often overly concentrated in specific regions or specific types of properties.
In reality, although real estate has historically been an effective investment to hedge against inflation, it is a complex and illiquid sector that cannot be traded or used for payments like cash equivalents.
2.5 Private Equity and Venture Capital: Insufficient Liquidity + Complexity Premium
definition
Investing in private companies and projects with low liquidity and long maturity, such as acquisitions and growth equity investments; early-stage venture capital or distressed and special circumstances investments.
Historical returns
Private equity: Net internal rate of return (IRR) is around 15% in many years (but it is highly cyclical).
Venture capital: Top quartile fund managers achieve returns of 20-30% or more.
However, the data exhibits extreme volatility: once costs and survivorship bias are taken into account, the median actual return will be closer to single digits.
return on investment:
Long-term liquidity shortage: Funds locked up for 7-12 years
Complexity: Customized transactions, governance, and structure
Managerial skills: Significant differences exist between different managers and in different investment years.
Information asymmetry: Requires professional channels and due diligence.
Higher principal risk: Venture capital is highly dependent on execution and economic cycles; there is a higher risk of principal loss.
Trade-offs: Funds are locked up for a long period; there is usually no secondary market. Furthermore, despite the higher risk, many funds underperform the public market after fees.
3. There's no such thing as a free lunch: the yield ladder
When you put all this historical data together, a simple fact emerges:
In the real world, no asset class can provide high returns without taking on high risks.
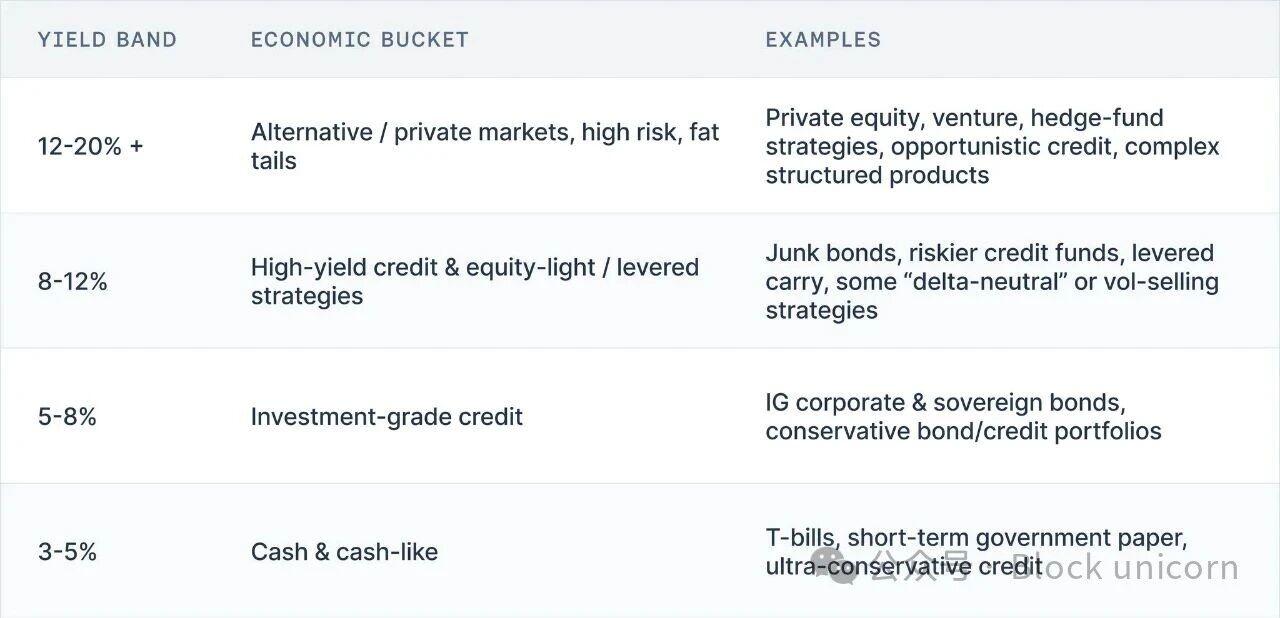
A practical way to interpret the yield of a treasury is to use a yield ladder model:
3-5% → Cash, Treasury bonds, short-term government bonds, ultra-conservative credit
5-8% → Investment-grade bonds, conservative credit portfolio
8-12% → High-yield bonds, higher-risk credit, low-equity strategies, and partial leveraged arbitrage
12-20%+ → Private equity, venture capital, hedge fund strategies, opportunistic lending, complex structured products
More than a century of market data shows that this yield ladder has demonstrated remarkable resilience through wars, hyperinflation, technological booms, and changes in interest rate systems.
Putting your portfolio on-chain doesn't invalidate it. Therefore, whenever you see a DeFi vault, ask yourself two questions:
Does the advertised risk match the advertised return?
Where does the yield come from?
4. Conclusion: The Correct Mental Model for Vault Returns
Leaving aside marketing and UI , the truth is actually quite simple:
The vault is no longer a "farm" with automatic compound interest, but an investment portfolio with API;
Its rate of return is the price of the risk it insures;
Market data from over a century shows that, under certain risk levels, a reasonable range of returns has remained remarkably stable.
Cash-like instruments have nominal yields in the single digits and real yields that are almost zero.
Investment-grade credit yields are slightly higher due to maturity and default risk.
High-yield credit and stocks can offer returns in the single digits or even the teens.
Private equity, venture capital, and hedge fund strategies are the only investment options in history that have consistently delivered returns in the teens or higher, but they also come with real risks such as insufficient liquidity, lack of transparency, and permanent loss.
Putting these portfolios on the blockchain does not change the risk-reward relationship. In today's DeFi front-end, five distinct risk levels may all be presented in the same friendly advertisement: "Deposit USDC and earn X% yield," without showing whether you are taking on the risk of cash, investment-grade credit, junk credit, stocks, or hedge funds.
This is bad enough for individual users, who may unknowingly invest in complex credit products or leveraged portfolios they don't understand.
But this also has systemic consequences: to maintain competitive yields, each product within a particular "category" will tend to opt for the riskiest allocation within that category. Safer allocations appear to "underperform" and are therefore overlooked. Custodians and agreements that quietly take on more risk in credit, leverage, or basis are rewarded until events like Stream or Elixir remind everyone what they've actually been taking on.
Therefore, the yield ladder is more than just a teaching tool. It's the starting point for a risk language currently lacking in the industry. If we can consistently answer these two questions for every vault:
Which level of the ladder does this vault belong to?
What risks (contract risk, credit risk, maturity risk, liquidity risk, directional risk) will I be exposed to with this rate of return?
This allows us to assess performance based on risk level, rather than turning the entire ecosystem into a single, indiscriminate race for annualized return (APY).
In later parts of this series, we'll apply this framework directly to crypto. First, we'll map today's major vaults and crashes onto a ladder to see what their yields truly tell us. Then we'll broaden our perspective and discuss what needs to change: labeling, standards, curatorial practices, and system design.
In subsequent articles of this series, we will apply this framework directly to the cryptocurrency space. First, we will map today's major vault and crash cases onto this framework to see what their returns actually reflect. Then, we will step outside the framework to explore areas for improvement: labeling, standards, curatorial practices, and system design.


