

Monad (MON) is trading around $0.021, down 7% in the last 24 hours but still up 4% for the week. Monad's price is also currently 56% lower than its post-listing peak of $0.048.
Despite the price drop, the chart still shows positive signals thanks to the inverse Vai and shoulders pattern stabilizing the price structure. This pattern will only be broken if the buyers fail to hold a key price level. However, the risk of a further price decline is not yet far off.
The inverse Vai and Vai pattern holds firm as investors buy during price dips.
Monad continues to follow an inverse Vai and Vai pattern. This is a pattern that often signals a bullish reversal if the price breaks above the neckline. Currently, support is at $0.020, while the neckline is near $0.024.
If the daily closing price is above $0.024, it will confirm a breakout from the pattern. At that point, the price could head towards the estimated 64% increase, reaching nearly $0.040. Although Monad's price has fallen by more than 7% in the last 24 hours, Dip -buying pressure is still helping to maintain expectations of a breakout.
The Money Flow Index (MFI) measures buying pressure through price and volume. During the period from December 26th to 29th, despite a price decrease, the MFI rose higher, creating a bullish divergence. This indicates Dip -fishing and support from retail investors.
Want more analysis on other Token ? Sign up for Editor Harsh Notariya's daily Crypto Newsletter here .
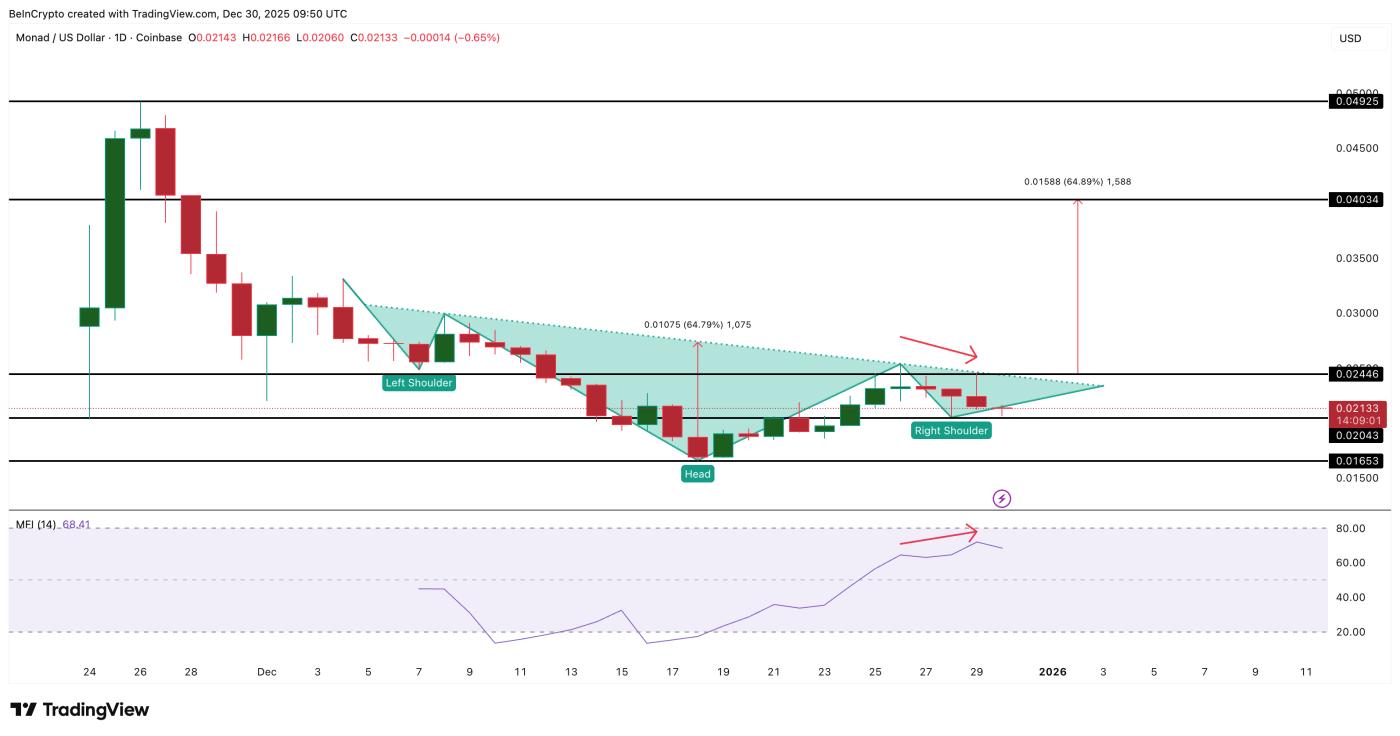 The breakout pattern is working: TradingView
This price action helps protect the pattern. If the MFI falls below the nearest Dip , Dip buying support will weaken. Conversely, if the MFI surpasses the recent high, the likelihood of the price heading towards the $0.024 region will increase. For now, retail investors are still holding steady around the $0.020 region.
Derivative contracts are skewed toward a long position, but the risk of a squeeze increases below $0.020.
Derivative data reveals why this pattern remains volatile. On the 7-day MON-USD chart on Hyperliquid, liquidation zones create a bullish skew. Liquidated Longing positions totaled approximately $93.62 million, while liquidated Short totaled around $45.26 million.
The pressure to liquidate Longing is more than 100% higher than the pressure to liquidate Short positions. This means that the majority of traders are betting on a price increase.
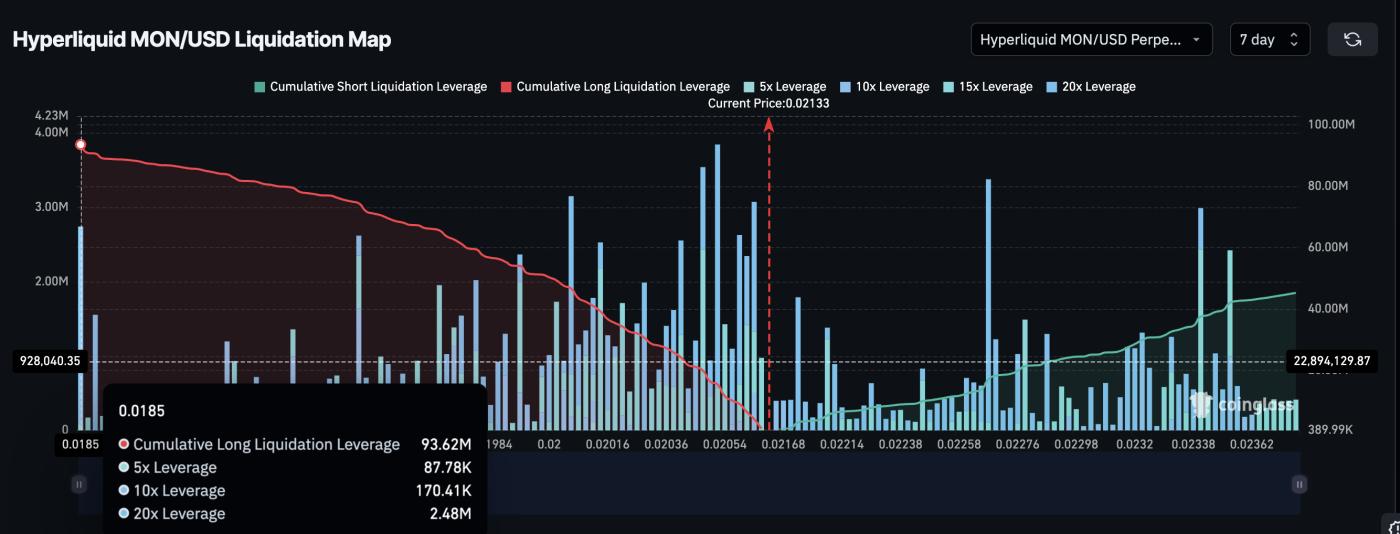 Liquidation map: Coinglass
This also poses a significant risk. If the closing price falls below $0.020, it will trigger a liquidation zone, with over 50% of Longing orders concentrated there. This zone has a total of $50.34 million in leveraged Longing positions. If this zone is broken, the market could enter a Longing squeeze effect, dragging prices down further.
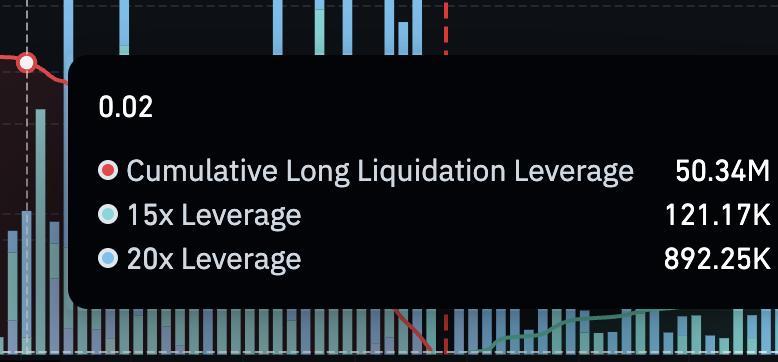 Monad Liquidation Leverage: Coinglass
Sellers may be waiting for this signal. If the $0.020 level doesn't hold, the liquidation effect will be faster and stronger.
Conversely, if the closing price is above $0.024, many large Short positions will be liquidated. At that point, the breakout trend will be confirmed, and the price could continue to rise sharply.
Key price levels for Monad for buyers and sellers.
Monad is currently trading in the area between two key directional points. A breakout above $0.024 would clearly indicate a trendline break. The $0.029 level would confirm upward momentum and could push the price toward $0.040.
If the price falls below $0.020, the pattern structure will weaken, the price could drop to the $0.016 region, and the inverse Vai and Vai pattern would be broken. At this point, the chart would shift to a downtrend. However, currently, the trend is still leaning towards an uptrend, albeit a very fragile one.
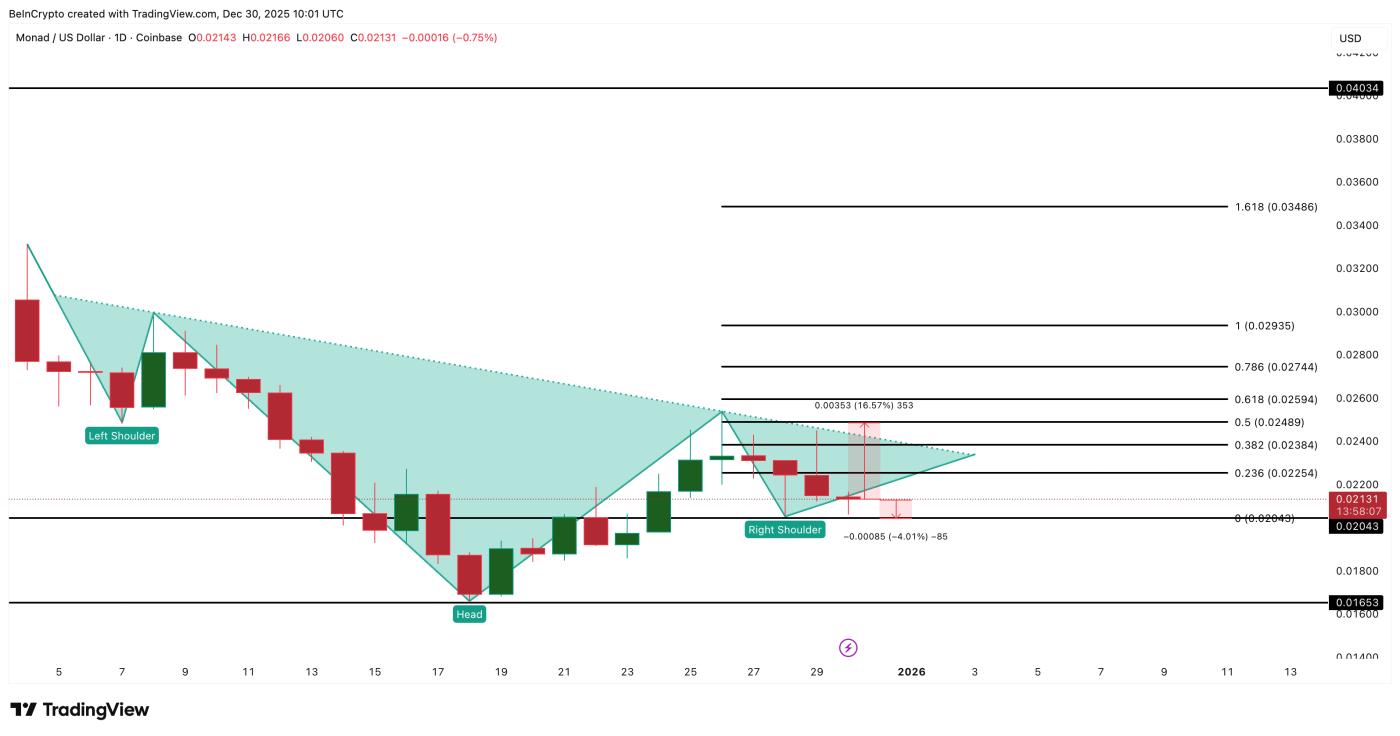 Monad price analysis: TradingView
Currently, the market is waiting for a breakout from the neckline or a Longing squeeze trap. If the breakout is successful, the price could rise by up to 64%. If there is strong selling pressure, a Longing squeeze effect will occur and the price could fall to $0.016.


