SENT launched on January 22, 2024, and immediately attracted attention. From its opening candle near $0.010 USD, the price of SENT has increased by approximately 140%, despite significant market volatility. This strength is remarkable. However, the short-term chart reveals some key points behind the scenes.
These price fluctuations are mainly driven by quick transactions, rather than long-term investment flows. At this point, SENT resembles a "playground" for short-term trading, with no clear trend yet established.
The 15-minute chart shows bursts of momentum, but the trend doesn't sustain.
On the 15-minute timeframe, SENT formed a clear double Dip structure after its launch. The neckline is near $0.030, so traders are paying close attention to this level. A price breakout above this level would typically suggest the potential for further gains.
The problem lies in the volume. After the sharp increase right after the TGE, Sentient's volume has steadily decreased. There was only one large green bar, followed by smaller but still fairly high red bars. This sequence is crucial.
Want more Token analysis like this? Sign up for editor Harsh Notariya's Daily Crypto newsletter here .
A large green candle indicates strong buying activity from investors, possibly anticipating a breakout or a rapid price increase. Closely following this is a red candle, showing quick profit-taking. This is typical day trading, often driven by "smart money" or scalpers. Buyers push the price up, and sellers immediately take profits, halting the upward momentum.
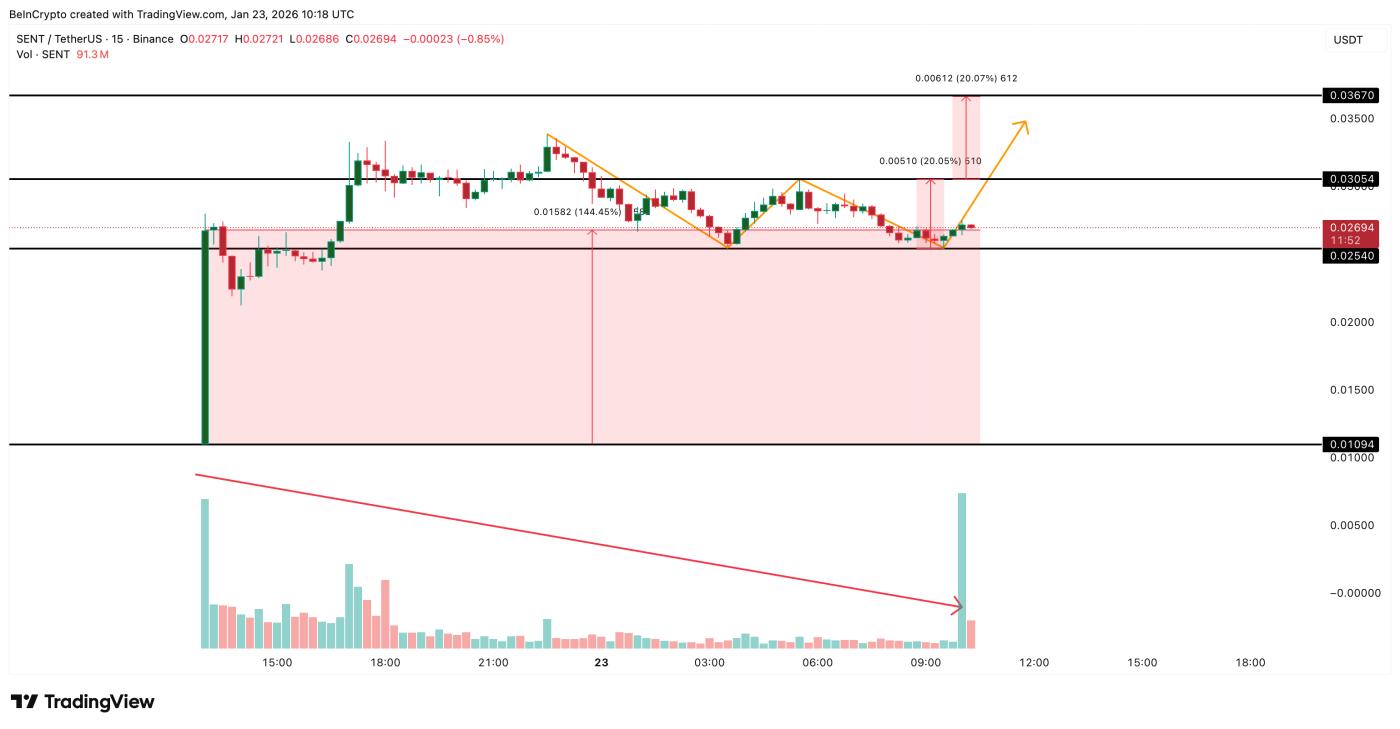 Sentient's 15-minute chart: TradingView
Simply put, the upward momentum is still there, but selling pressure has emerged, causing the price to move sideways instead of higher. This is suitable for scalpers, but quite risky for those expecting a clear uptrend.
The 30-minute and 1-hour data show rotation rather than strong belief.
When you zoom in on the chart a little more, the picture becomes clearer.
On the 30-minute timeframe, the Chaikin Money Flow (CMF) indicator – commonly used to track large money flows – has fallen below zero while the price has mostly moved sideways. Below zero means more money is being withdrawn than invested. Although the price has held steady, large "whales" or SENT wallets haven't really entered the market yet.
Currently, the CMF needs to remain above the descending trend line to avoid a sharp decline and Capital flight.
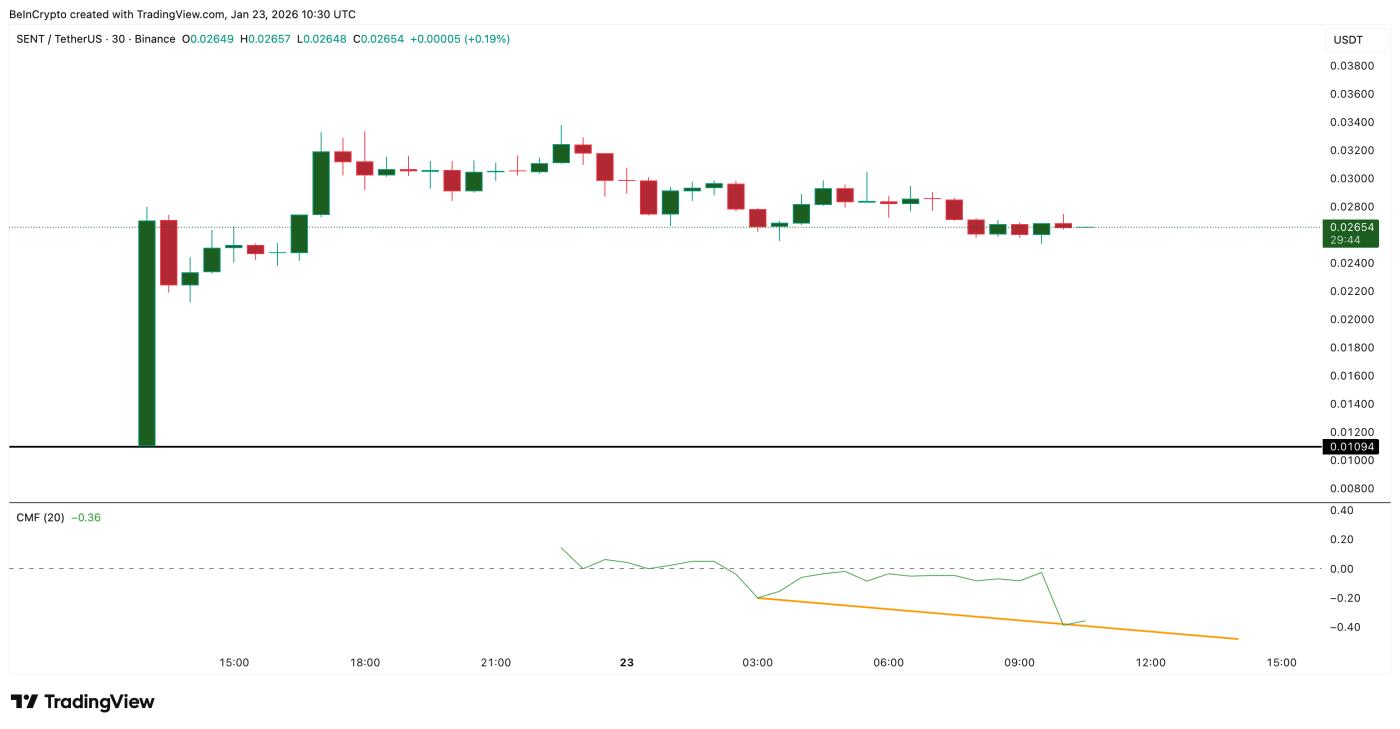 Big money hasn't entered the market yet: TradingView
Simultaneously, the 1-hour On-Balance Volume (OBV) indicator is attempting to break through the descending trend line. OBV helps determine whether volume confirms price movement. Currently, OBV is increasing (indicating investors are buying when the price stalls), but it needs to surpass approximately 1.09 billion to truly confirm buyer control (creating a higher peak). If it fails to break through, this breakout trend remains uncertain.
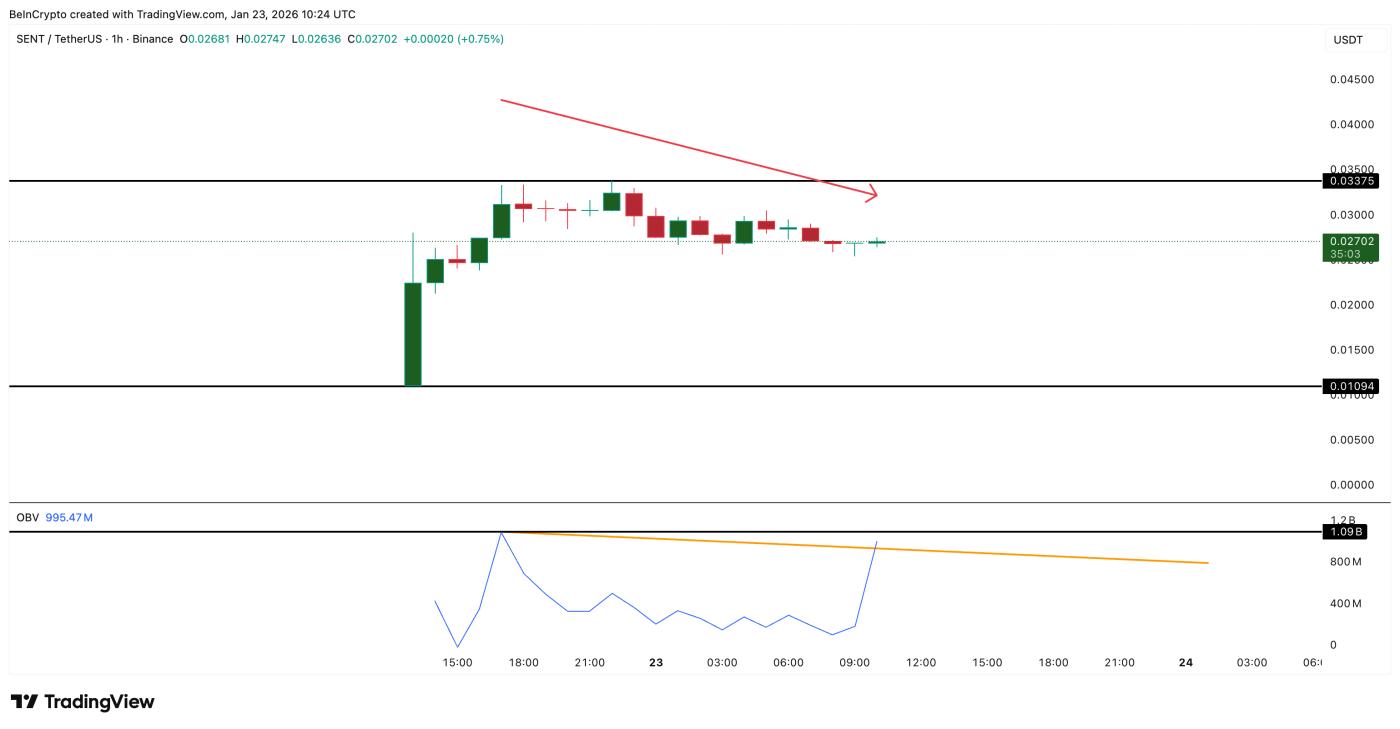 Buying pressure remains on SENT: TradingView
When the CMF indicator weakens and the OBV is attempting a breakout, it usually signals that short-term buying pressure remains, but large Capital hasn't yet entered the market. Sometimes, large wallets even take advantage of Airdrop Token when the price rises to sell them, which explains why the CMF falls below 0.
The Smart Money Index provides additional insight. Even when prices fall slightly, the "smart money" indicator line rises. This often reflects rapid entry and exit of large sums of money. This is also why there are "surges" in Volume on the 15-minute timeframe.
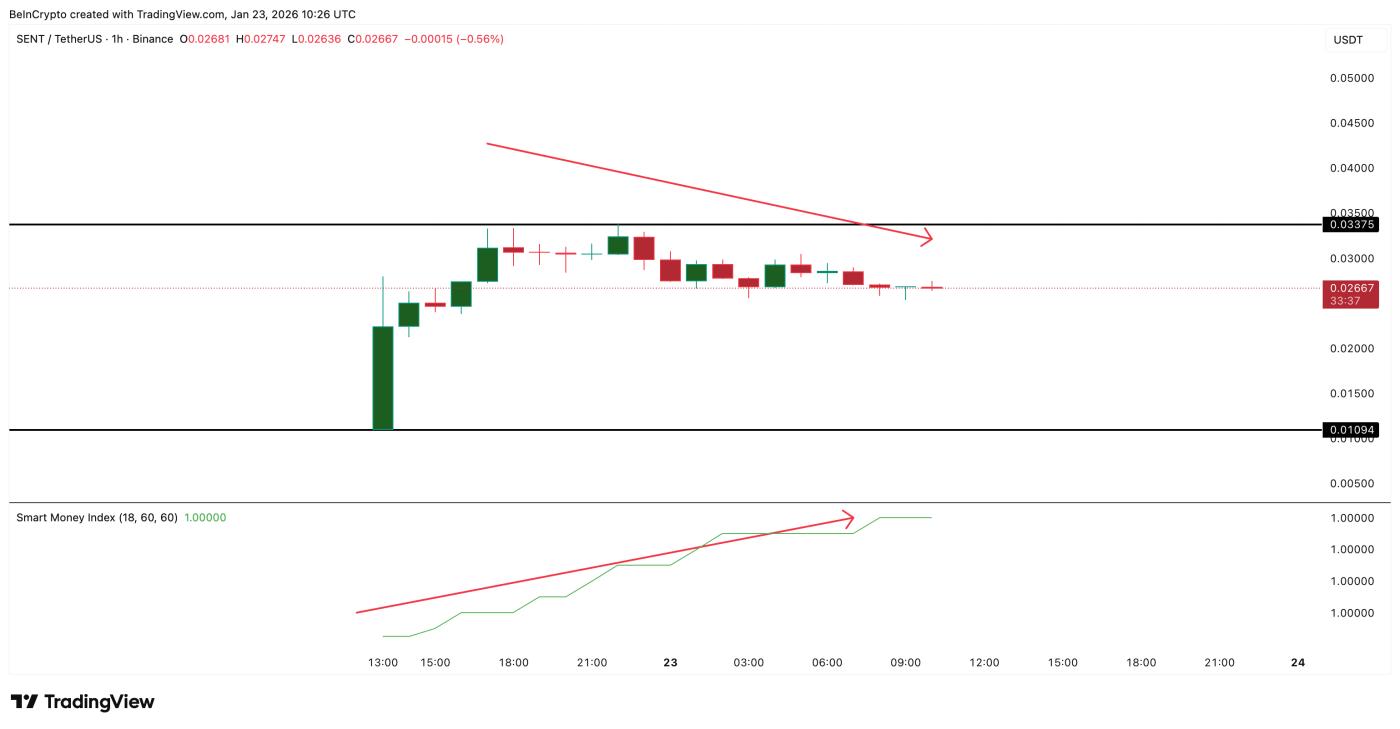 How smart money works: TradingView
This dynamic explanation is even more accurate when looking at exchange data. Volume on exchanges has surged by approximately 384% in the last 24 hours. Such high trading volume indicates significant short-term trading and a large number of Token changing hands: the increase in OBV confirms buying activity, while the influx of funds onto exchanges suggests an intention to sell and possibly take profits from Airdrop .
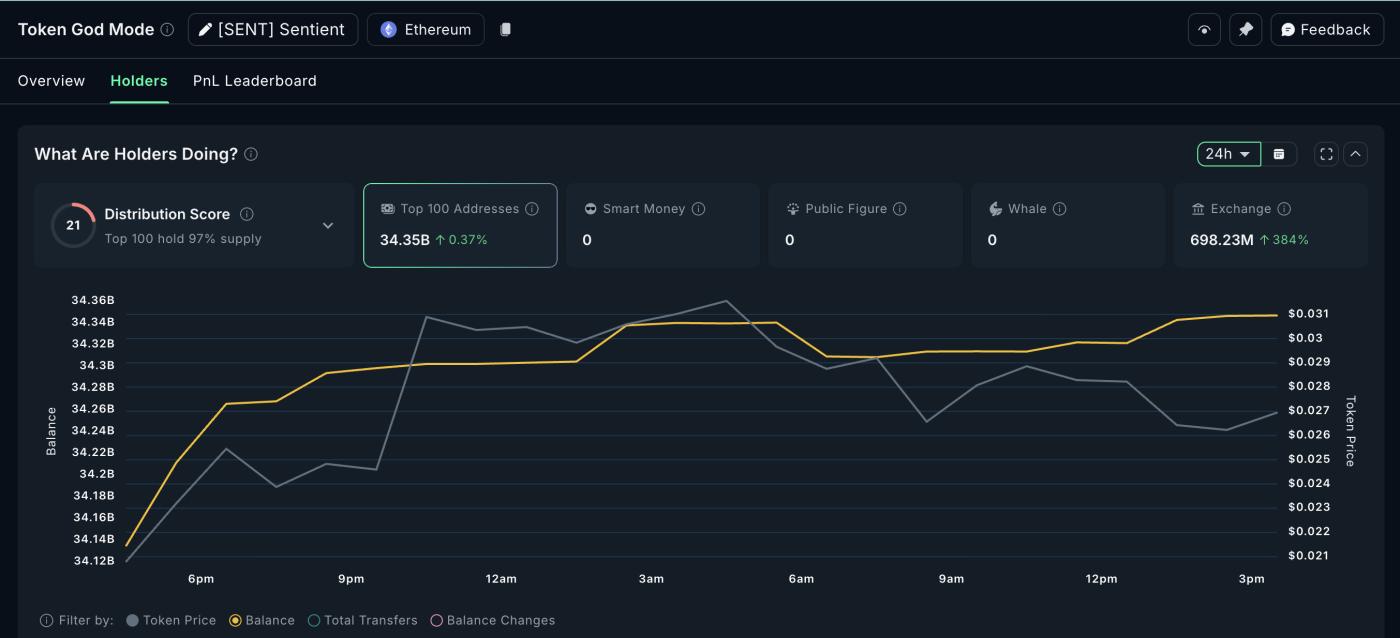 Selling pressure remains: Nansen
Overall, these signals indicate that SENT is being traded quite actively, but strong buying pressure has not yet become apparent.
The 2-hour SENT price trend will determine the next key levels.
A longer timeframe allows for a more objective view of the market.
On the 2-hour chart, SENT has maintained an uptrend since its post-listing Dip . This trend remains unbroken, which is noteworthy. As long as this area holds, attempts to push the price higher are still possible.
The first major support level is around $0.025. This level has held firm on several occasions when tested. If the price breaks below $0.025 with high volume, the next target is in the $0.021 region. If selling pressure intensifies further and the CMF continues to decline, a drop to near $0.010 is also possible.
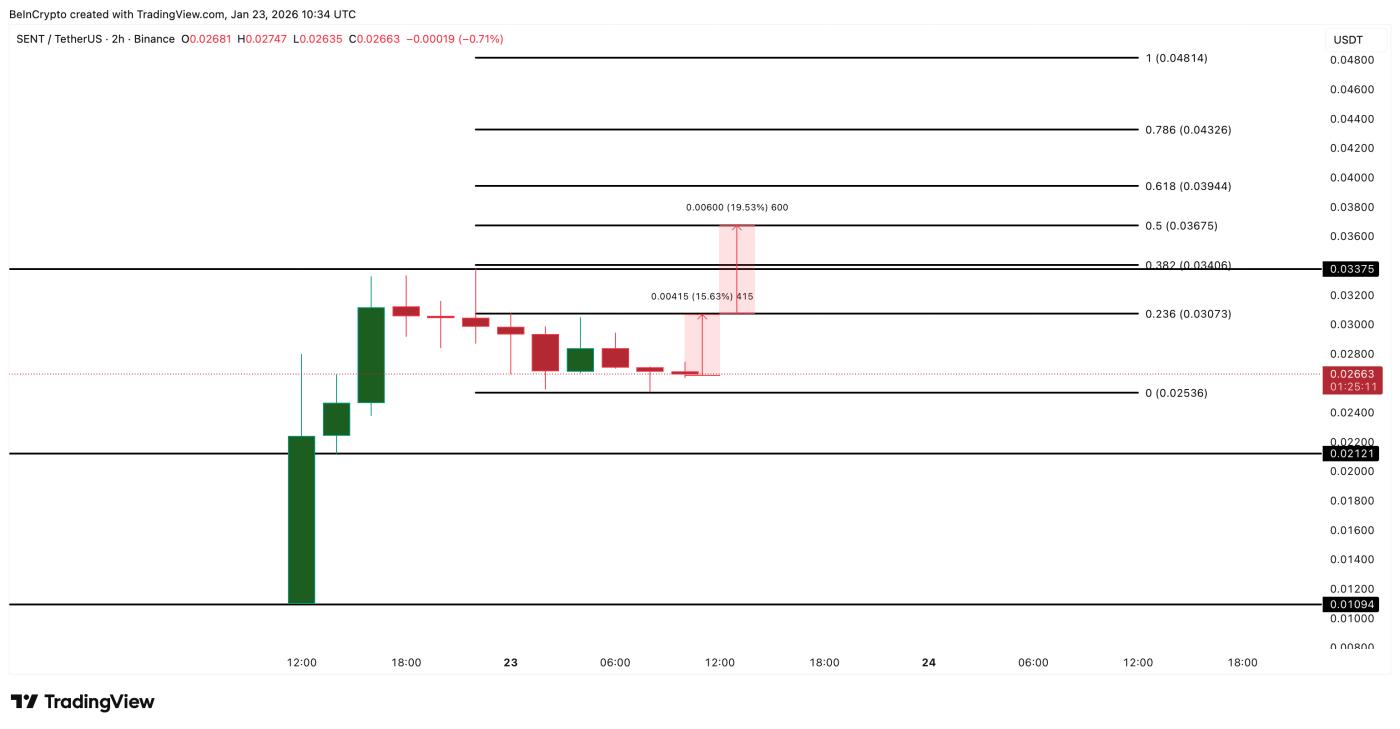 Price analysis SENT: TradingView
On the upside, everything hinges on the $0.030 mark. SENT needs to close above this level on both the 15-minute and 2-hour timeframes. Simply breaking above this level and then immediately reversing is not sufficient. The upward momentum is only truly solid when accompanied by significant volume.
If this confirmation appears, price structure analysis on the 15-minute timeframe suggests the next target could reach $0.036 (also seen on the 2-hour timeframe), an increase of approximately 20% from the breakout zone. Further down, strong resistance zones are located at $0.043 and $0.048.
Until then, the market has been moving quickly and mostly sideways within a narrow price range.
In summary: After TGE, SENT still maintains a certain level of strength; however, currently, the price is still influenced by high volatility rather than decisive buying power. The future trend will not simply be driven by rumors or technical patterns, but volume will determine whether SENT will break higher or continue to be a "playground" for day traders.