Hedera is struggling to recover from a recent price drop, leaving HBAR price moving in a sideways range. HBAR has managed to hold its ground, but the recovery effort is stalled due to retail investor behavior affecting overall sentiment.
This hesitation could still present opportunities for Futures Contract traders, as current positions suggest a potential for significant volatility if key price levels are broken.
Trader Hedera is facing many risks.
Derivative data shows that those shorting HBAR are facing significant risk if the price rises. The liquidation map shows the largest cluster of short positions is around $0.114. If the price reaches this level, an estimated $4.5 million worth of short positions would be liquidated, forcing many traders to buy back HBAR Token .
Currently, positions in the Derivative market are still skewed towards short selling rather than longing. This imbalance reflects the negative sentiment in the Derivative market. When many short sellers congregate, the likelihood of significant volatility increases, especially if prices break through resistance levels, forcing short sellers to quickly close their losing positions.
Want to receive more news about Token like this? Sign up for editor Harsh Notariya's daily Crypto newsletter here .
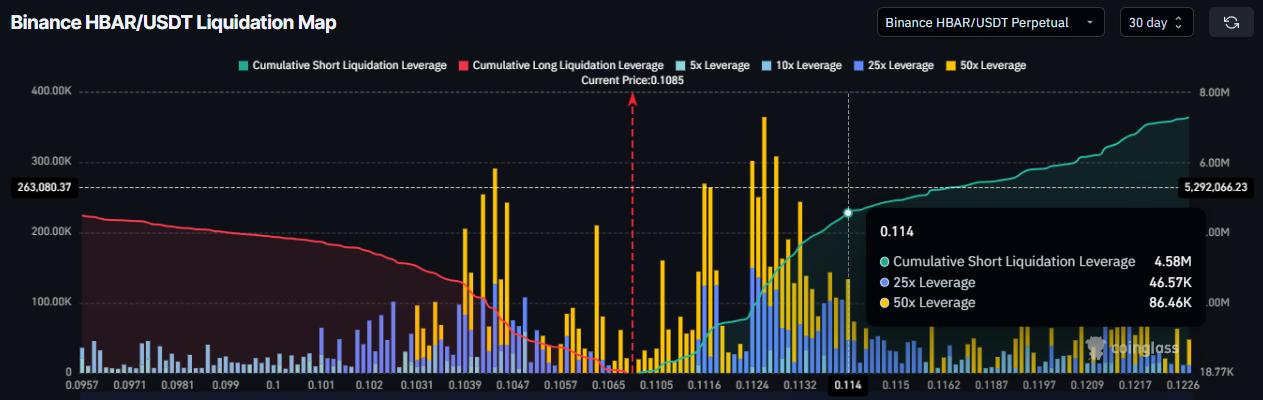 HBAR liquidation map. Source: Coinglass
Macroeconomic indicators suggest that investor participation is gradually decreasing. The Chaikin Money Flow indicator has recently been declining continuously for almost two weeks, creating successive lower Dip . The CMF tracks the flow of money into and out of an asset based on price and volume, and should be XEM an important signal of market demand.
When this indicator falls below the zero line, it confirms that outflows are dominating the HBAR market . This suggests that investors are reducing their positions rather than accumulating more. If outflows continue, selling pressure will persist, making it difficult for HBAR prices to rebound unless market sentiment shifts significantly.
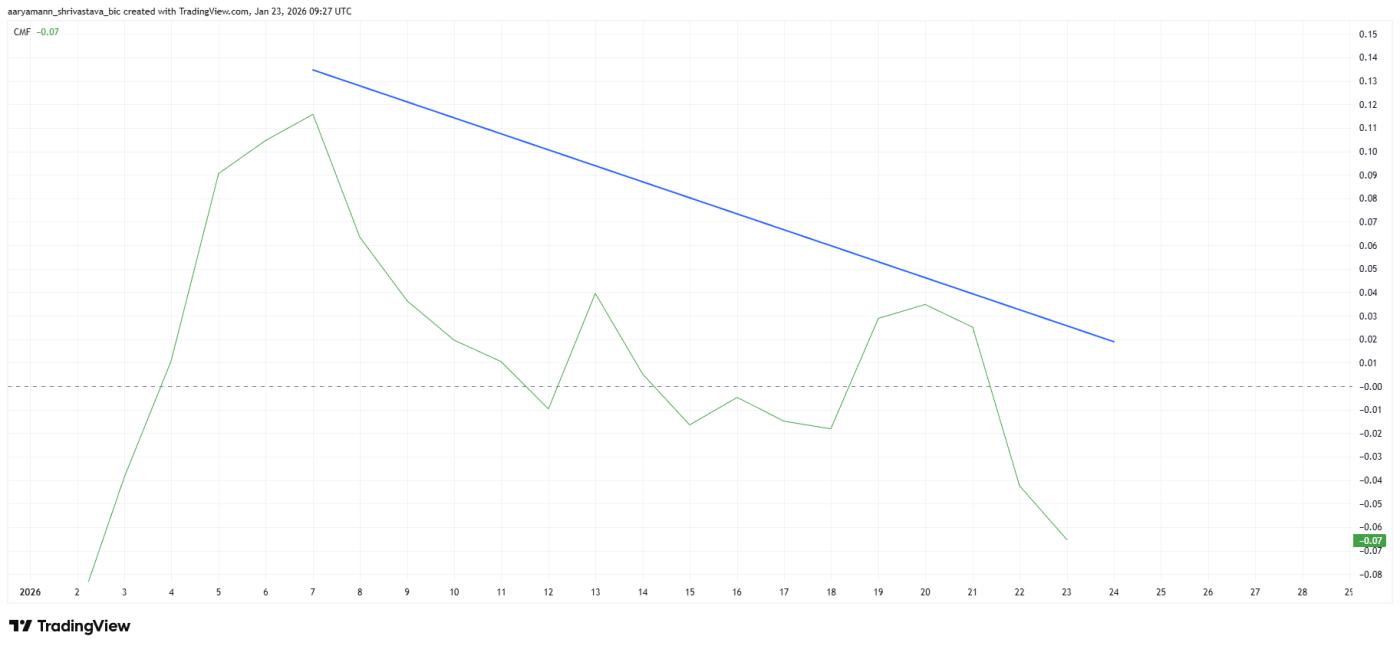 HBAR's CMF indicator. Source: TradingView
HBAR price needs to hold this important support zone.
HBAR is currently trading around $0.108 at the time of writing, hovering near the 23.6% Fibonacci retracement level. This area is Vai in determining the next direction of the price. If this level holds as support, the potential for a recovery will improve and the downtrend may weaken.
If outflows continue, HBAR could lose this support zone. In that case, the price risks falling to near the 2026 Dip of around $0.102. Such a development would prolong the downtrend and further reinforce pessimistic sentiment in both the spot and Derivative markets.
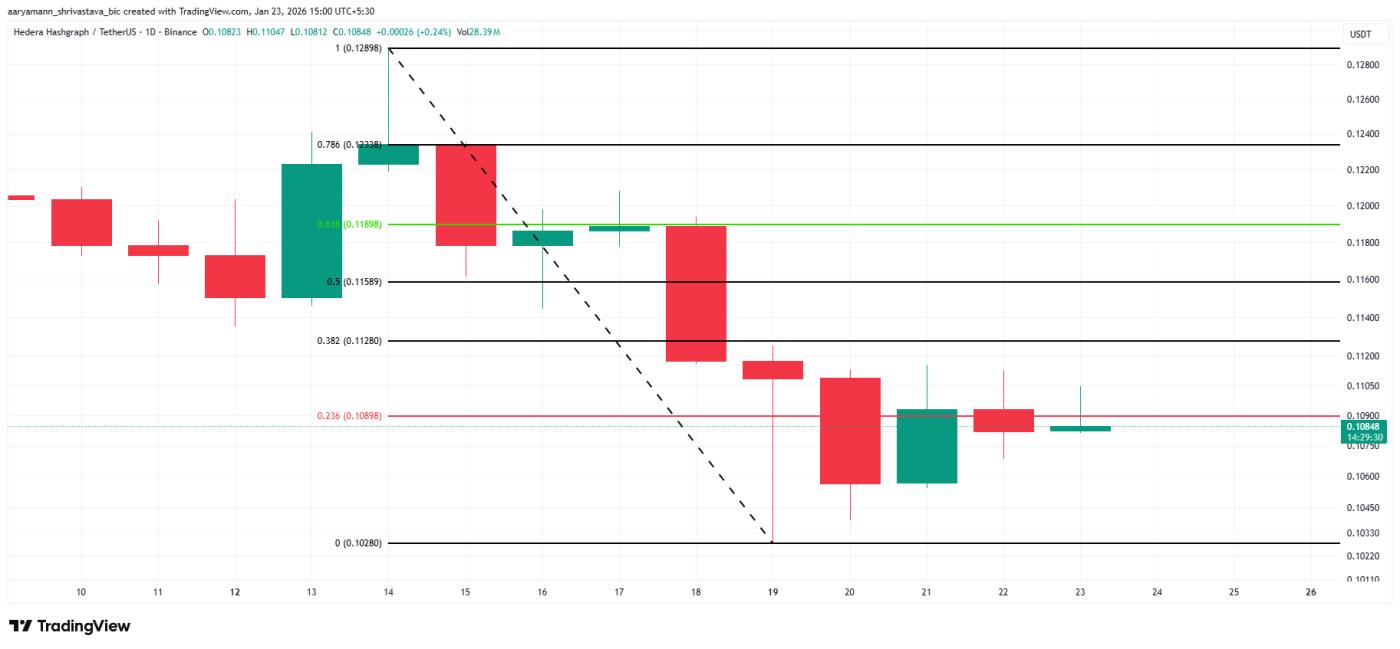 HBAR price analysis. Source: TradingView
A bullish scenario would only occur if HBAR firmly reclaims the 23.6% Fibonacci level. If this level turns into support , HBAR could rise to the 38.2% Fibonacci level near $0.112. Alternatively, if the price breaks above the $0.115 resistance level, many short positions will be liquidated, the negative outlook will be refuted, and a stronger recovery opportunity will open up.