XRP is starting February under significant pressure. The Token has fallen nearly 7% in the last 24 hours and approximately 5% over the past month, reflecting a generally negative market trend. Historically, February is often a difficult month for XRP prices. The data shows a median gain of -8.12% in February, while the Medium decline is -5%. In 2025, the Token also fell nearly 29% during the same period.
This year, technical signals and on-chain data are also showing similar risks accumulating. However, signs of selective accumulation and early momentum signals suggest that a recovery is still possible. Here's what the data shows.
Why was the price correction anticipated?
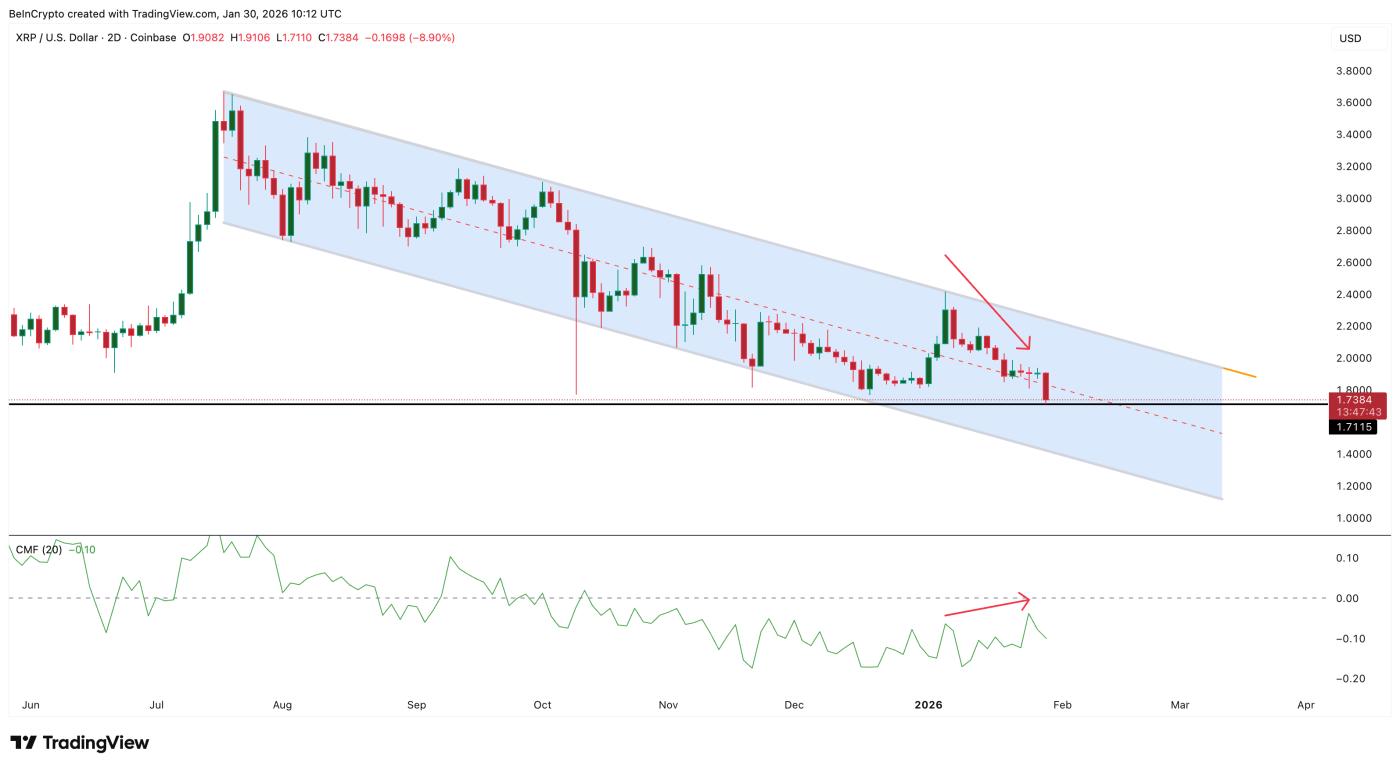
XRP is currently trading within a long-term descending channel pattern on the two-day chart. A descending channel is a negative pattern in which the price consistently creates lower highs and Dip between two parallel trend lines.
Since mid-2025, this pattern has resulted in limited price rallies and a continuous downward push of XRP prices. With February, a typically weak month, approaching, XRP is getting closer to the lower boundary of the price channel, increasing the risk of further declines.
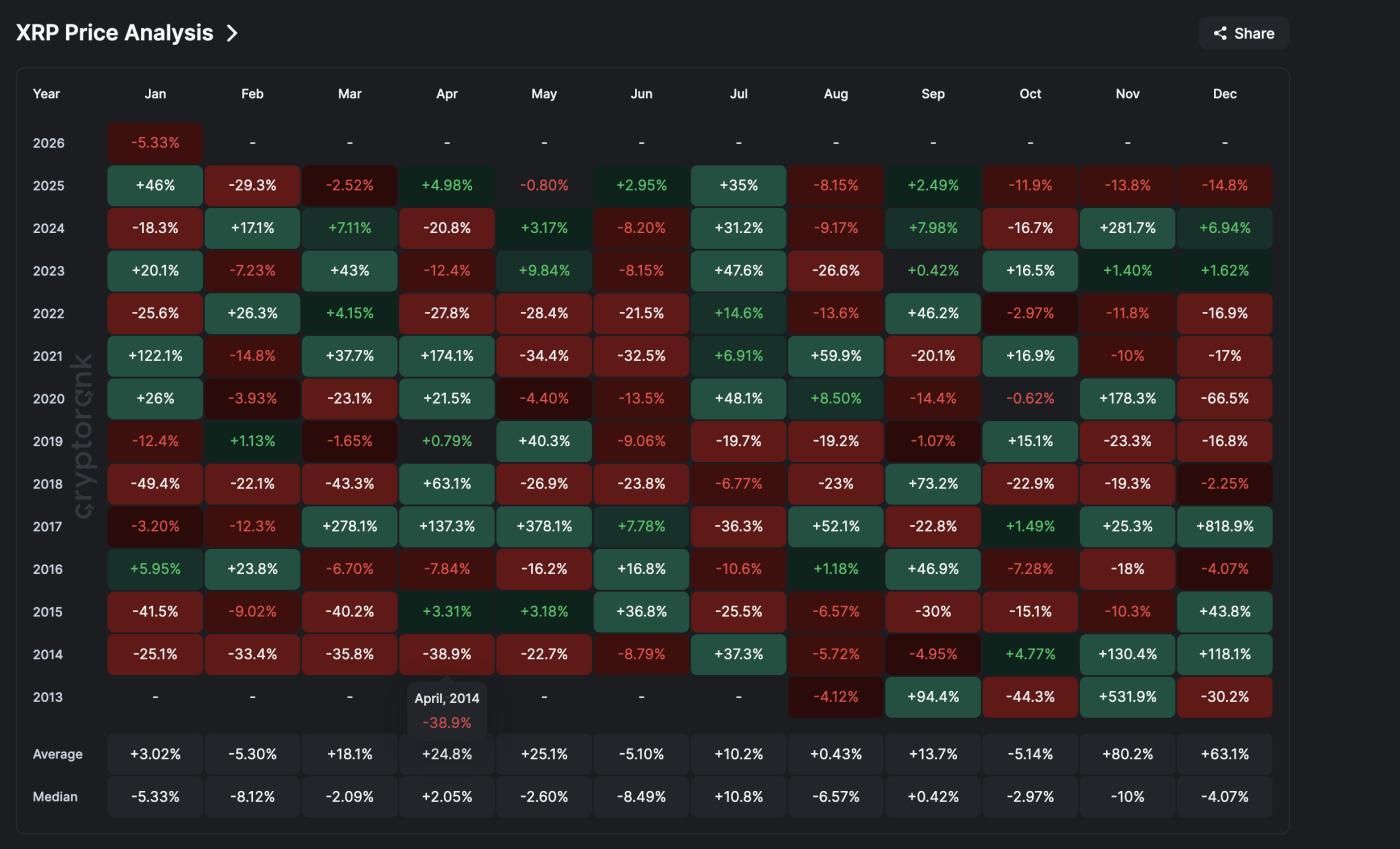 XRP Price History: CryptoRank
Want more Token analysis like this? Sign up for the daily Crypto newsletter from editor-in-chief Harsh Notariya here .
Vasily Shilov, Business Development Director at SwapSpace, believes that while seasonality still plays a role, it is no longer the sole determining factor.
"Currently, ETF Capital are a more reliable indicator of trends," he said.
"If the market remains uncertain on a macroeconomic level, there's a high probability that prices will trade sideways within a narrow range," he added.
However, this negative technical factor did not occur suddenly.
From October 2nd to January 5th, XRP price peaked lower, while the Relative Strength Index (RSI) recorded higher peaks. The RSI is an indicator of momentum strength, showing whether buying or selling pressure is increasing or decreasing.
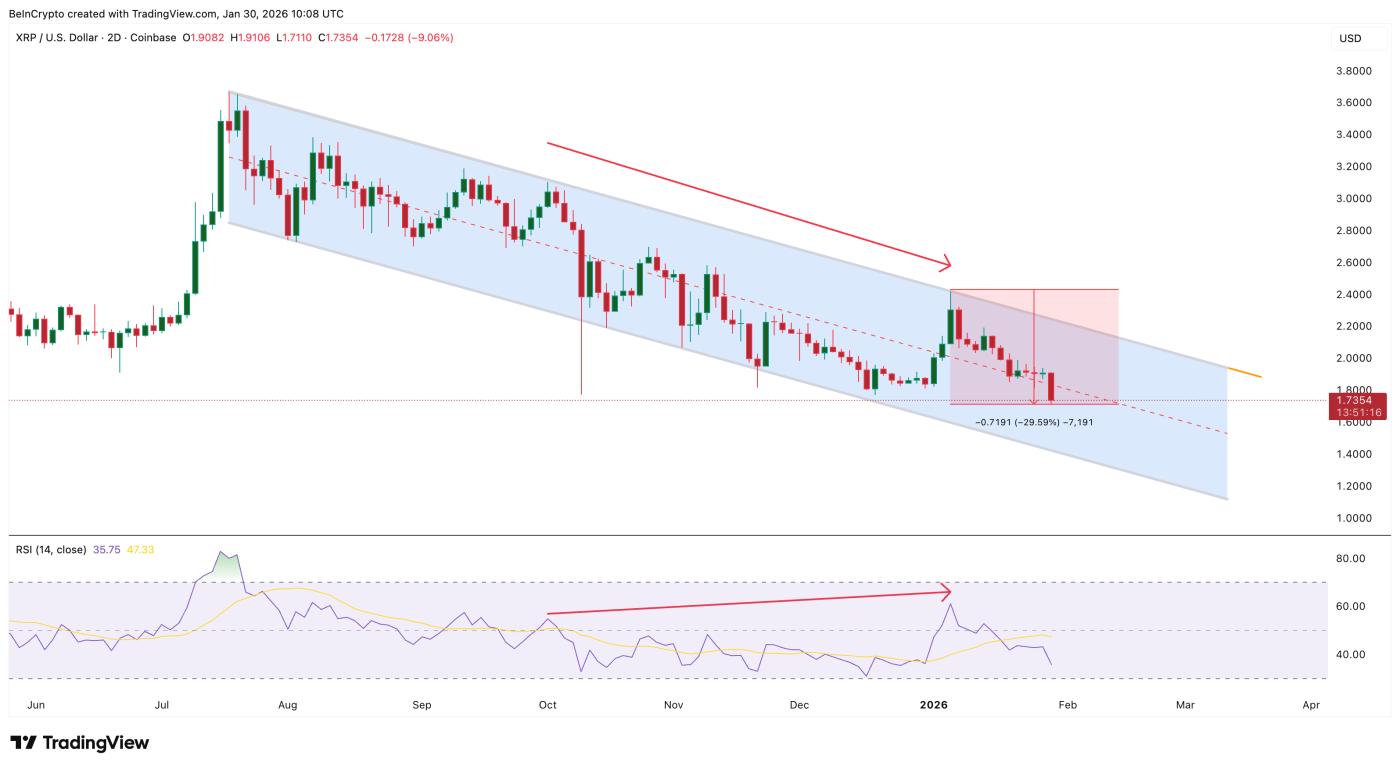 Negative price pattern: TradingView
This inconsistency is known as a hidden bearish divergence, often signaling weakening bullish momentum before a correction. This signal appeared in early January, and subsequently, prices fell by nearly 30%.
Currently, a new scenario is emerging.
From October 10th to January 29th, XRP price formed lower Dip (which is still happening at the time of writing) while the RSI attempted to form higher Dip . This forms the basis for a bullish divergence, potentially signaling the end of a downtrend.
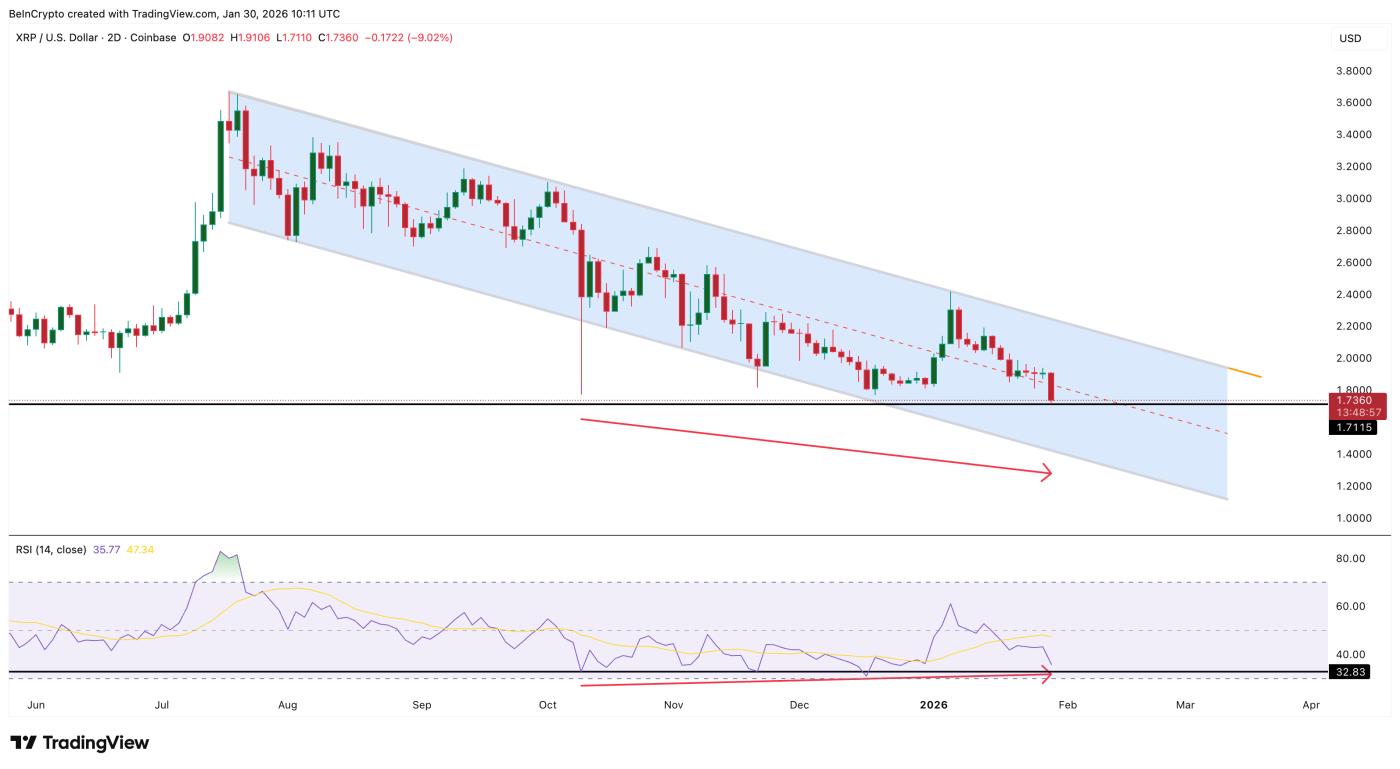 Divergence Formed: TradingView
To confirm this signal:
- The XRP price candle on the next 2-day timeframe must close above $1.71, confirming the lower Dip pattern.
- The RSI must remain above 32.83.
If both of the above conditions are met, the downward momentum will weaken and the likelihood of a recovery will increase. But if they are not met, the downward trend of the price channel will not be broken.
Whale cash flow and activity show mixed signals.
Although XRP price is falling, the flow of money paints a more complex picture.
The Chaikin Money Flow (CMF) indicator, which reflects buying pressure from institutions and large wallets, rose steadily from January 5th to January 25th, despite a price drop. This is a bullish divergence.
This suggests that large investors, possibly institutions, are quietly accumulating XRP while the price is falling.
 CMF is rising: TradingView
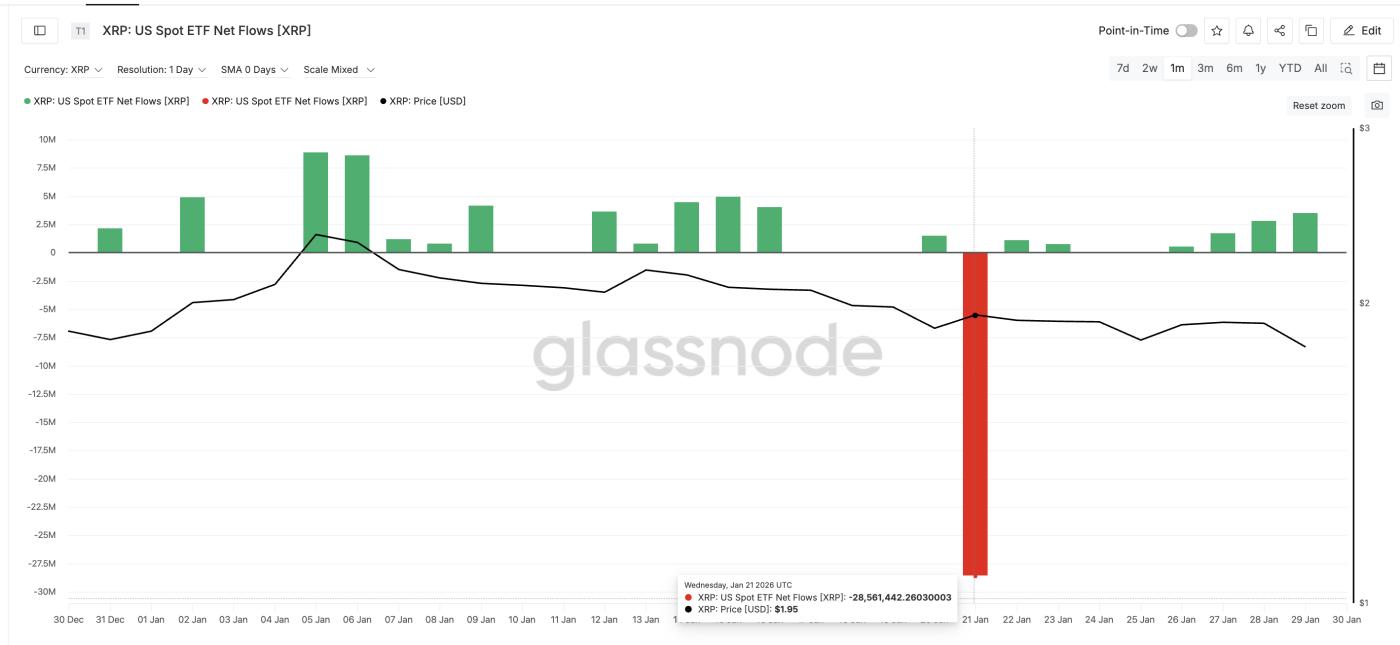
ETF Capital data also supports this trend. Although total ETF Capital in January remained negative due to a sharp outflow on January 21st, Capital stabilized and gradually increased towards the end of the month. The recent green bars indicate that institutions are paying attention again.
 XRP ETF cash flow: Glassnode
Shilov stated that the volatility of the ETF in January reflected caution stemming from macroeconomic factors rather than weakening XRP demand.
He explained that despite macroeconomic pressures causing investors to shift toward safe-haven assets like gold and silver, XRP spot ETFs have attracted over $1.3 billion in inflows since launch and have not recorded a single month of net outflows.
"The scale and sustainability of the Capital inflows suggest that a reversal of the current trend is unlikely," he added.
However, this optimism was challenged by exchange data.
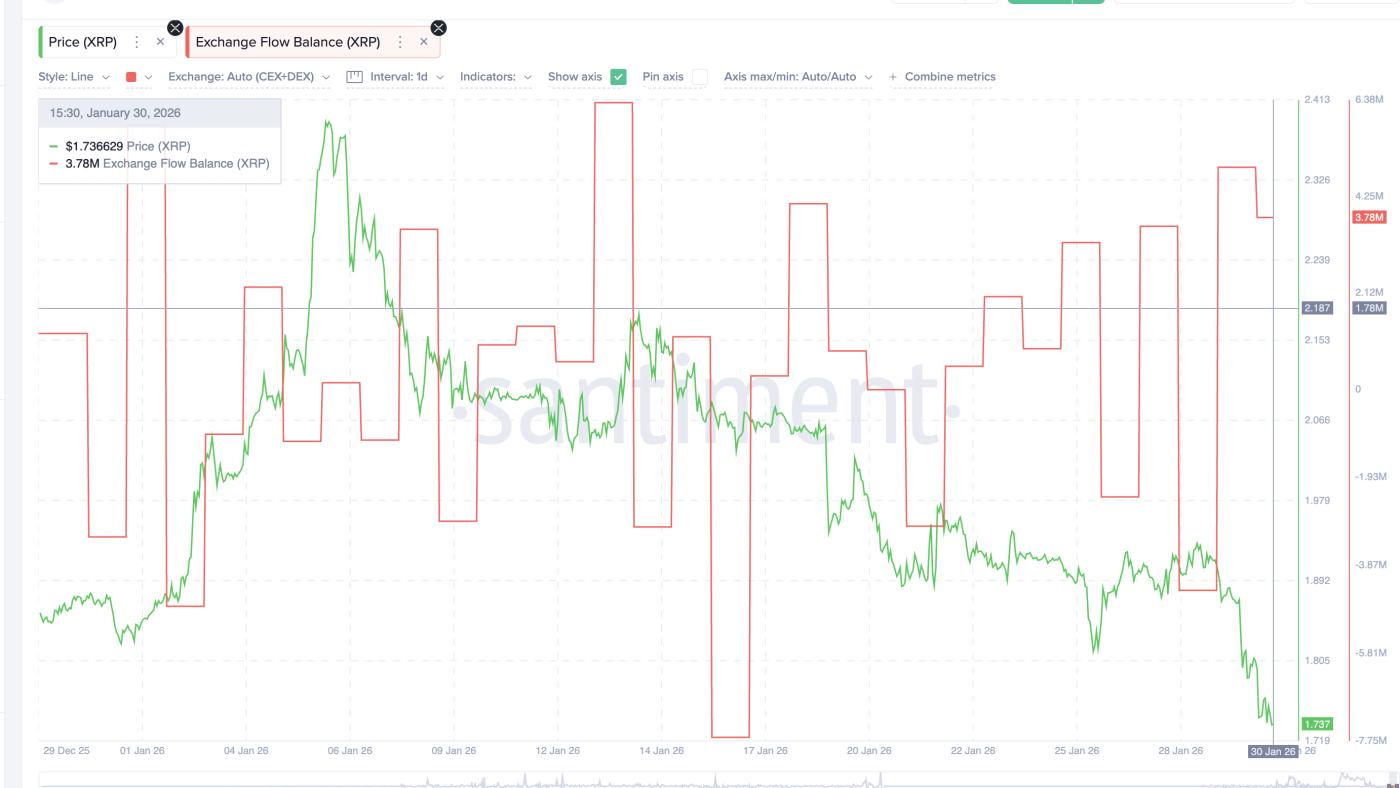
The amount of XRP flowing into exchanges has surged since January 17th, rising from -7.64 million to +3.78 million. Even more noteworthy is the pattern this data has formed.
 XRP flow on exchanges: Santiment
Three consecutive Capital inflow peaks occurred on January 25th, 27th, and 29th. A similar pattern also appeared earlier this month (January 4th, 8th, and 13th). Subsequently, XRP fell from $2.10 to $1.73, representing a decrease of approximately 18%. Therefore, the current Capital inflow pattern is XEM a risk signal despite the optimism surrounding the ETF.
Shilov Chia that demand from ETFs alone is not strong enough to decouple XRP from the overall market fluctuations. Based on SwapSpace trading data, he believes that short-term XRP volatility still depends on Bitcoin trends and macroeconomic risk sentiment, especially when ETF inflows become unstable.
"The trend of BTC, macroeconomic stressors, and the state of Derivative will be the main factors shaping risk appetite in the coming period," he commented.
XRP whales offer an interesting perspective.
Whale behavior further complicates the market.
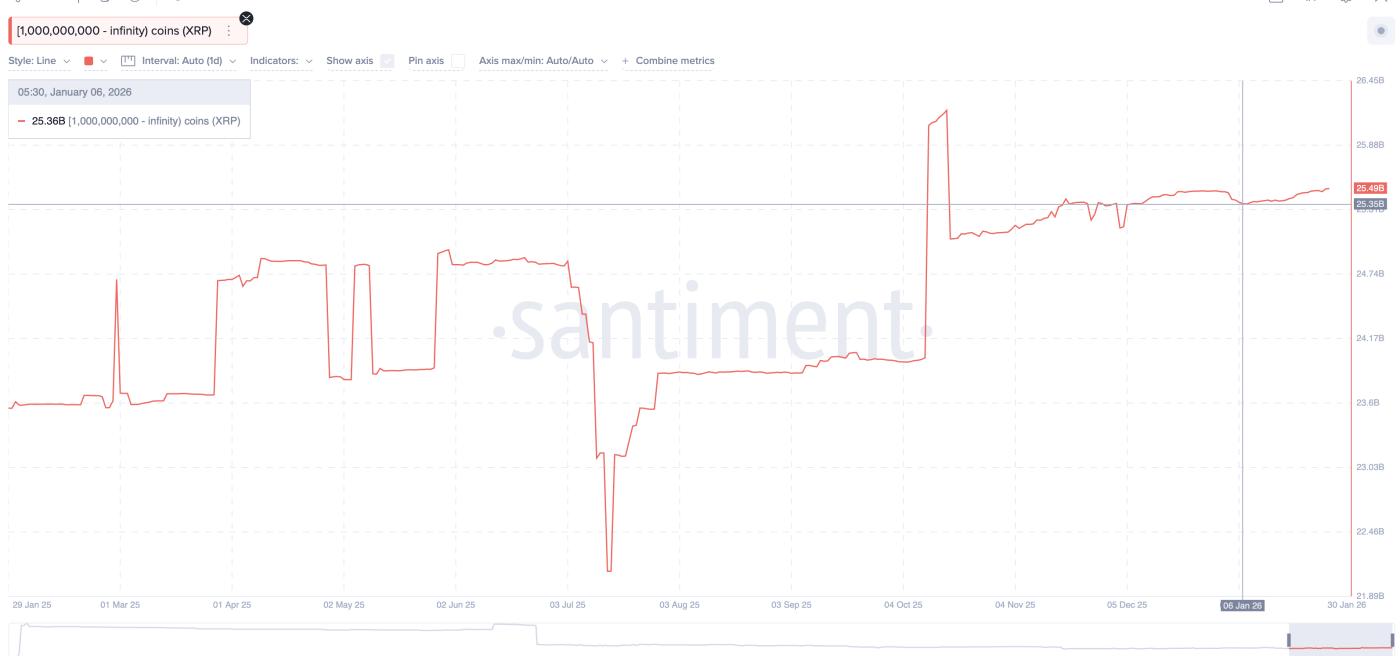
Wallets holding over 1 billion XRP have been steadily increasing their holdings since the beginning of January – the time of the price correction. The amount of XRP held by this group has increased from 23.35 billion to 23.49 billion XRP, demonstrating a large influx of Capital invested during a period of weak prices.
 Whales continue buying: Santiment
Unlike last year, when large whales waited until the end of February to accumulate positions, this time they built their positions earlier. This helps reduce the risk of a sharp decline but does not completely eliminate the risk of a short-term correction.
Shilov noted that the whales' accumulation needs to be viewed in a broader context. He argued that the current action resembles a short-term position adjustment rather than absolute belief in an upward trend.
"Continuous accumulation needs to be maintained in parallel with a stable ETF Capital ," he said.
"Conversely, buying power can dry up very quickly if macroeconomic pressures increase."
Currently, market signals are quite mixed, explaining why XRP only fell by about 5% in January instead of the much deeper drop of nearly 15% seen in December 2025.
Key support levels, downside risks, and XRP price recovery scenarios.
XRP 's price structure now clearly defines key areas. The first area XRP needs to hold is $1.71–$1.69. If two consecutive candlesticks close below this zone, the price channel support will weaken and the likelihood of a sharp correction increases.
If this scenario unfolds, the next major support level will be around $1.46. If it consistently breaks below $1.46, selling pressure could intensify rapidly, and XRP would face the risk of a sharp decline to the $1.24 region.
This scenario occurs when Capital inflows into the exchange continue to increase and demand for ETFs does not improve.
Conversely, on the upside, hopes for a recovery will depend on a resistance level. XRP must reclaim the $1.97 mark if it closes above this level for two consecutive days. This would signal a short-term resistance breakout, indicating that buyers are regaining control. This price zone was highlighted by BeInCrypto experts yesterday.
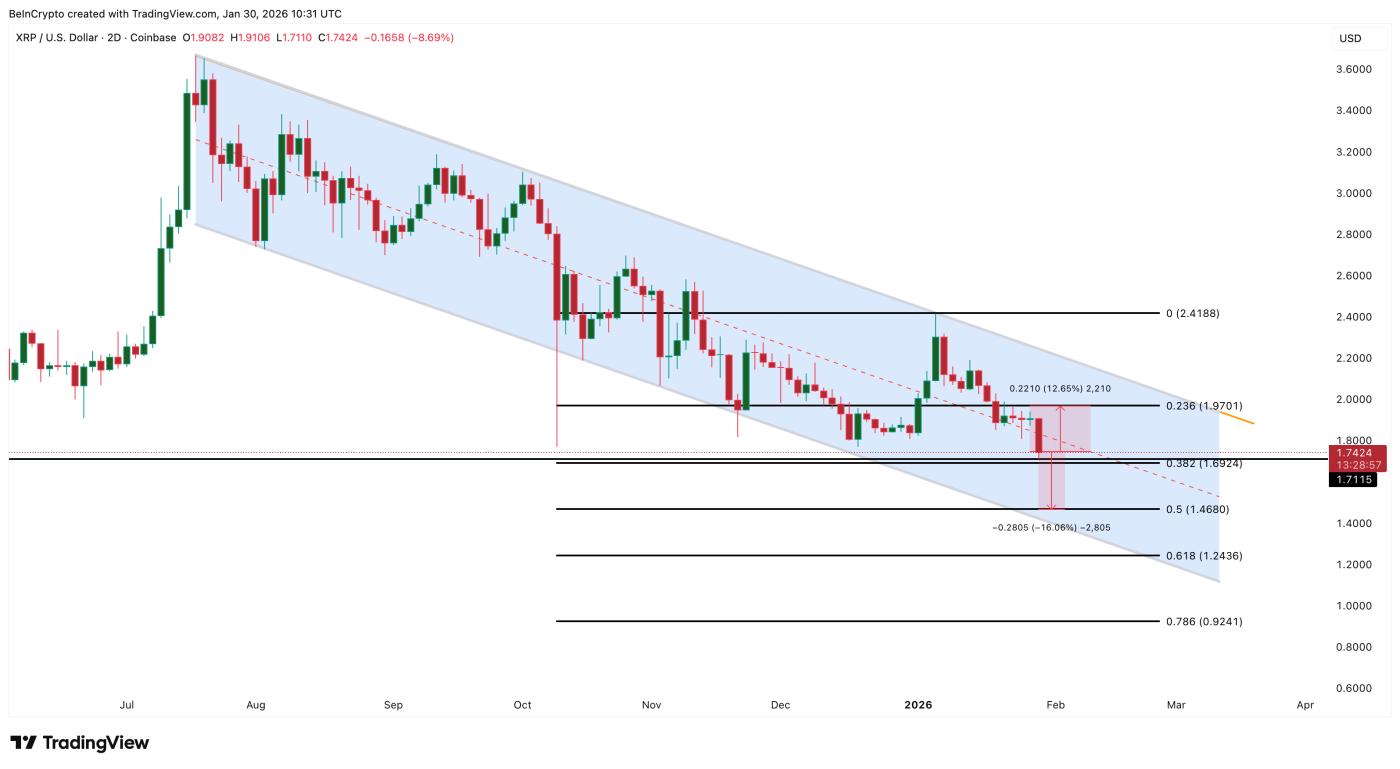 XRP Price Analysis: TradingView
If XRP confirms a breakout above $1.97, the path toward $2.41 will be wide open, coinciding with key Fibonacci resistance levels and channel resistance.
Looking ahead, Shilov believes that a confirming signal for a strong upward trend will be the return of stable ETF Capital similar to those seen during the launch period last November.
"Weekly inflows of between $80 million and $200 million would provide strong momentum for XRP to surpass the $2.10 mark," he said.
He also pointed out a support level that could be broken, which perfectly matches our analysis:
"If the global geopolitical or macroeconomic situation continues to deteriorate, the price of XRP could fall further and push the asset below $1.70," he emphasized.
Currently, the battle is mainly centered around the support zone of $1.69 and the resistance zone of $1.97. Whichever zone is broken first will likely determine the XRP price trend for the remainder of February.