

Market Review
1️⃣ Major Logic Reversal: Warsh = Return of a Strong Dollar?
Old Logic: Trump = Unlimited Money Printing = Collapse of Dollar Credit = Gold & Silver Skyrocket.
New Logic: Warsh = Reshaping Monetary Discipline = Real Quantitative Tightening (QT) = “Revival” of Dollar Credit.
Since the dollar isn’t turning into worthless paper, why would people buy gold at several thousand dollars an ounce to protect their wealth? Gold’s $5 trillion market cap evaporated in two days.
Variable: The Senate confirmation hearing is expected to last until March-April. Republican Senator Thom Tillis is currently opposed; if not confirmed by May, Vice Chair Jefferson will act as Chair.
2️⃣ “Epic” Stampede in Precious Metals: Silver Plunges 37% After Surging 14%
Why such a sharp drop? Two reasons:
First, the implied volatility (IV) of Gold ETF options soared to 46%, and Silver’s even exceeded 60%. This is panic buying at a level seen during the 2008 financial crisis. The market was full of speculators, and the slightest disturbance could trigger a stampede.
Second, the CME (Chicago Mercantile Exchange) and the Shanghai Futures Exchange (SHFE) successively raised margin requirements. This is like being at a casino when the house suddenly says, “The chips are more expensive now,” forcing leveraged funds into liquidation. This mechanical selling pressure accelerated the decline.
3️⃣ The Dollar’s “ICU” and “Resurrection”
Early in the week, the Dollar Index once fell below the 96/97 mark, hitting a four-year low. The probability of a US government shutdown soared, the fiscal stalemate was unresolved, and the world was dumping dollar assets. In that atmosphere, the dollar was like a “rat in the street.” The emergence of Warsh led the market to expect a rescue for the dollar, causing the dollar’s decline to narrow in the second half of the week as shorts covered their positions.
4️⃣ Macro Data: Labor Market “Freezes,” Inflationary Pressures Rise
Employment: ADP new payrolls fell to 7,750, with the consensus forecast for January non-farm payrolls at only 70,000; low job growth and low unemployment (4.4%) maintain a tight balance in the labor market.
Inflation/Trade: The December PPI and Core PPI both rebounded more than expected. The November trade deficit widened to $56.8 billion, driven by a surge in gold and semiconductor imports.
Real Estate: The market weakened again.
5️⃣ January FOMC: Hold Rates Steady, Wait for Data
Decision: Kept interest rates unchanged. Only Miran and Waller supported a rate cut.
Tone: Powell removed the phrase “downside risks to employment,” believing that risks to both inflation and employment are diminishing. The baseline path is “no rate hikes,” but a “wait-and-see” approach is still needed.
6️⃣ Fiscal Crisis: Government Enters “Technical Shutdown”
Current Situation: Due to partisan disagreements over ICE enforcement conflicts, the appropriations bill missed the January 30 midnight deadline, and the government has officially shut down.
Expectation: If the House passes a compromise bill on Monday and it is signed by the President, operations could resume on Tuesday.
US Stocks — Sentiment Peaks, Follow-Through from Capital is Lacking
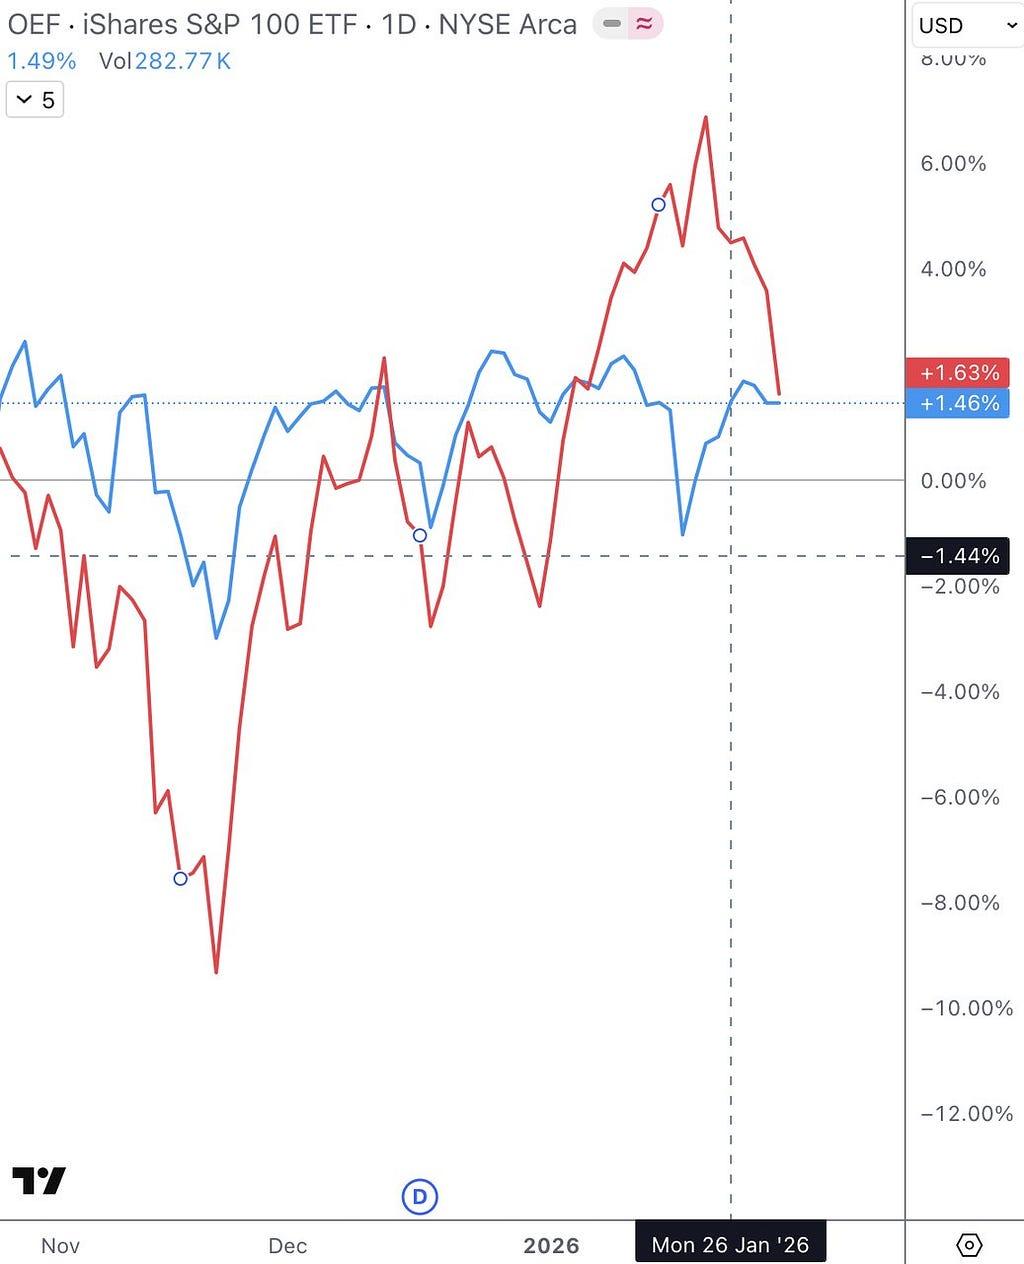
1️⃣ Index Divergence: Giants Hold the Line, Small Caps Flee
The large-cap OEF (blue line) remains at a relatively high level, with big tech huddling together for warmth. The small-cap IWO (red line) has already given back all its year-to-date gains.
This is not a healthy bull market. Without the smaller stocks following, the giants can’t dance alone for long.
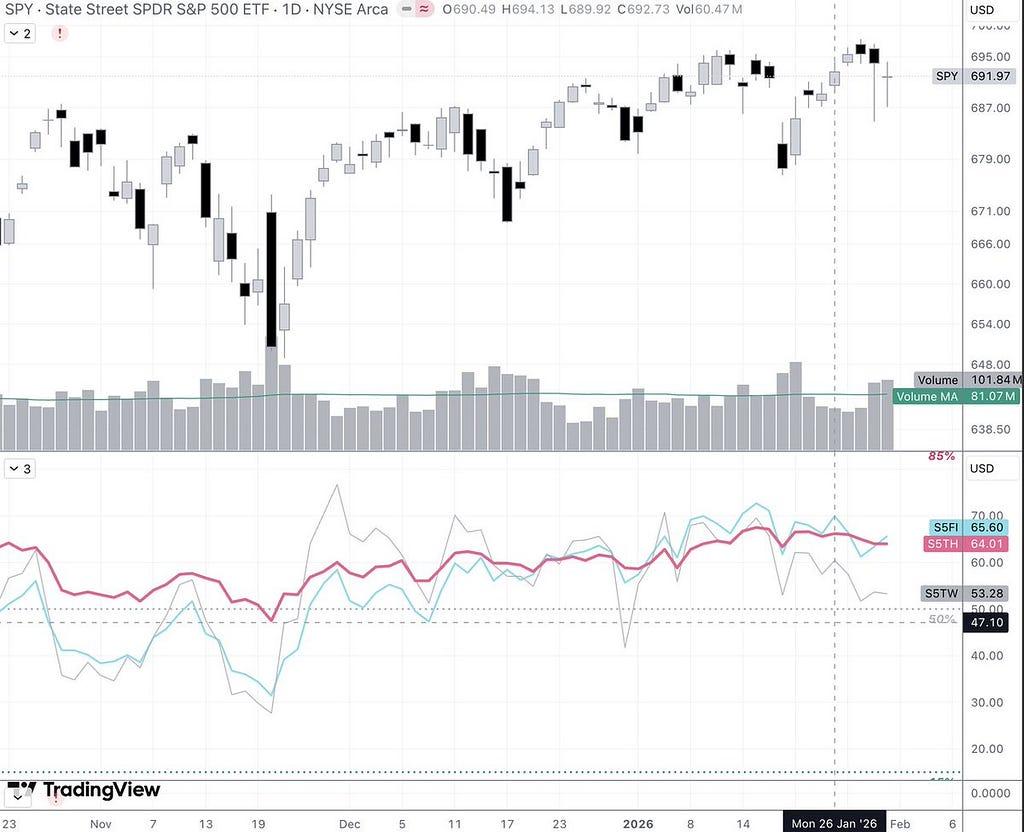
2️⃣ Breadth Collapse: Half of the Stocks are “Swimming Naked”
Moving Average Breadth: The number of stocks above their 20/50/200-day moving averages is declining across the board. With only half the stocks rising, this “single-plank bridge” bull market is extremely difficult to participate in.
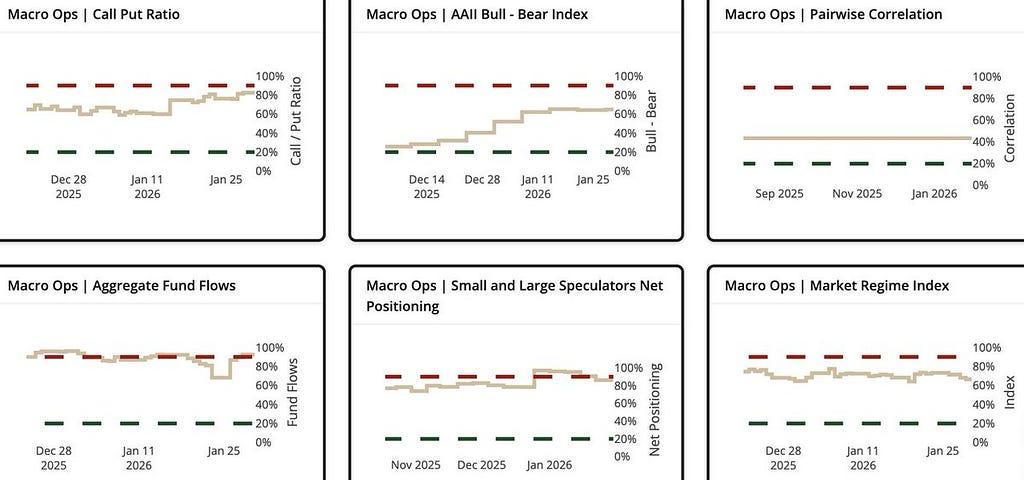
3️⃣ Sentiment Indicators: Greed is “Maxed Out”
Trend Fragility Index: 87%! This is a contrarian indicator. Historically, whenever this value exceeds 90%, it has basically signaled a medium-term top. Current market sentiment is more optimistic than it has been 87% of the time over the past three years.
Aggregate Fund Flows: 93%! It’s off the charts. The money has all rushed in, and there is no more “new money” in the market to take over.
AAII Retail Investor Sentiment: 65% bearish (contrarian indicator)? Don’t be misled. This reflects retail investors’ fear of the recent sell-off, but combined with an 81% Call Put Ratio, speculative players (buying call options) are still in the game.
Market Regime Index: 66%. Not yet at panic levels signaling a crash, but transitioning from stable to overheating.
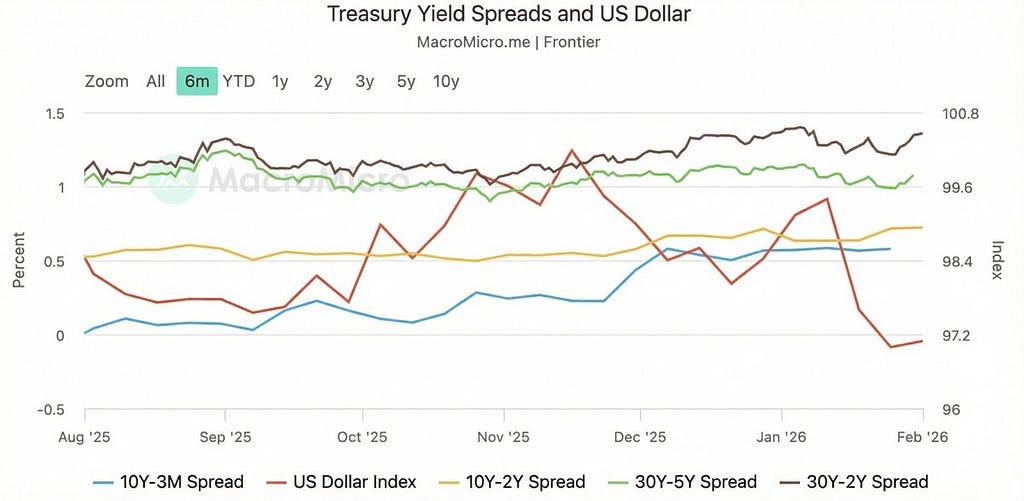
US Treasuries- Risk-Averse Sentiment Rises
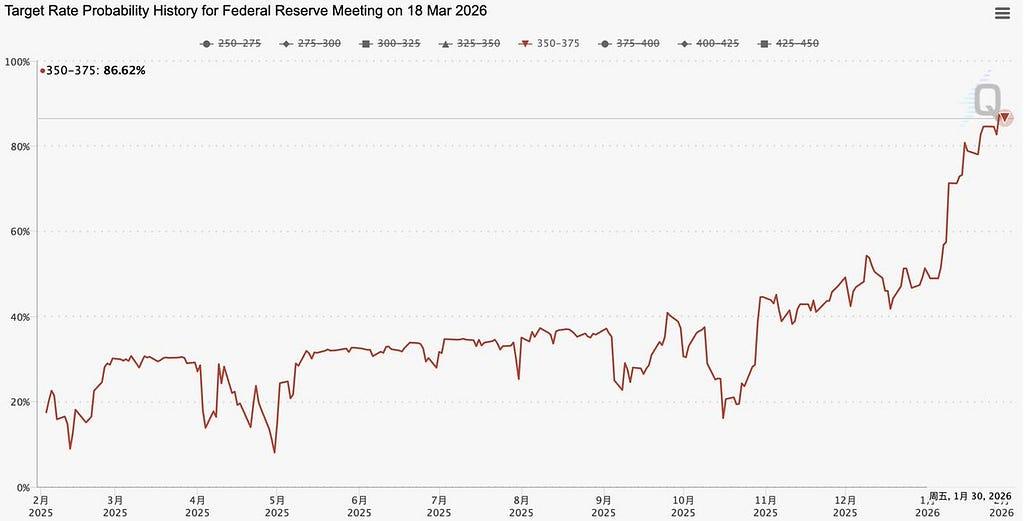
1️⃣ Rates: The CME FedWatch Tool shows an 87.2% probability of rates remaining unchanged at 3.50%-3.75% in March. The predicted probability for this rate range has risen steeply since the end of 2025, soaring from around 40% to nearly 90% currently.
2️⃣ Spreads: Long- and short-term bond spreads have all widened slightly. The 10Y-3M spread rose to 0.58%, the 10Y-2Y to 0.72%, and the 30Y-2Y to 1.36%. While spreads are rebounding, the Dollar Index is still hovering at a low of 97.09.
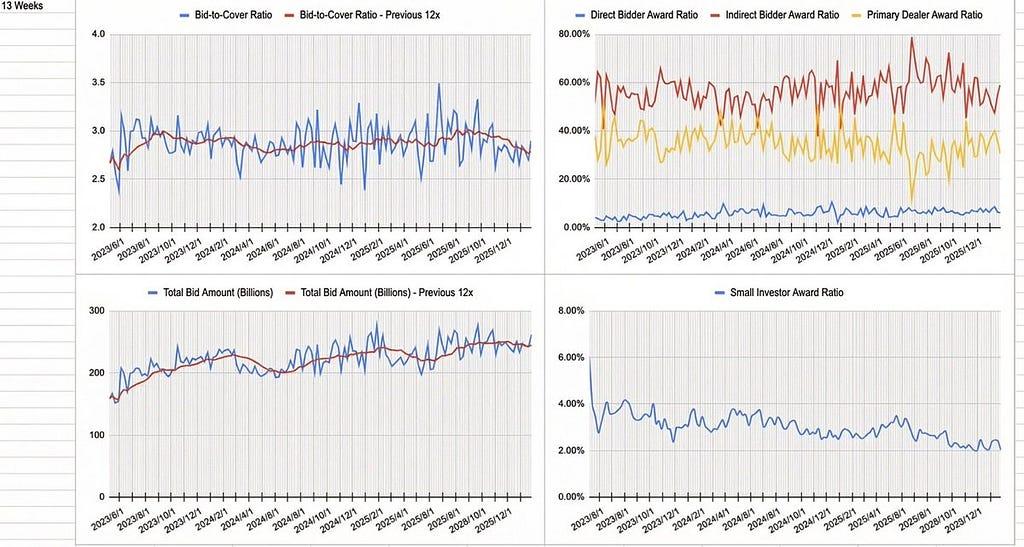
3️⃣ Treasury Auctions: A Scramble for Bonds, Red-Hot Market
1.Strong Demand: The 13-week short-term bond issuance saw ample market demand, with total bid amounts remaining consistently high.
2.Player Composition: International indirect bidders (like foreign central banks) have a very high interest in US Treasuries, and the dollar’s appeal as a safe-haven asset remains strong.
Signal: Due to strong demand, primary dealers were forced to take on a smaller share, indicating very abundant liquidity.
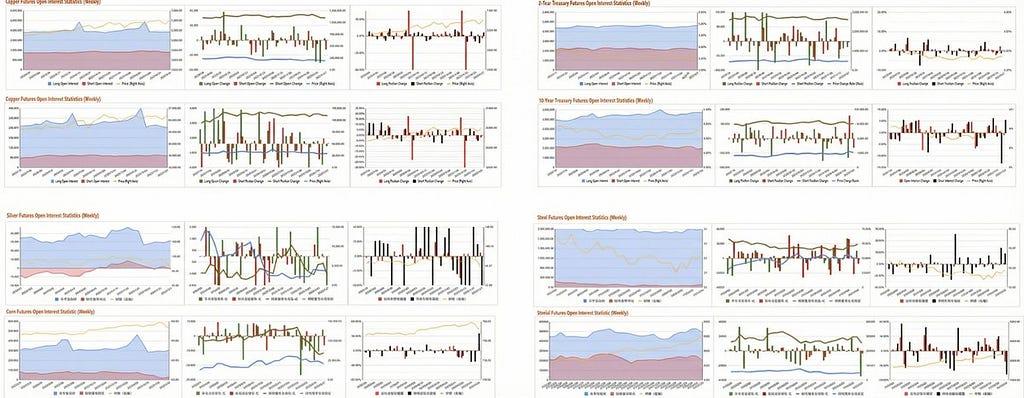
Positioning Across Assets — CFTC Futures Positioning Chart
Exiting US Stocks and Gold, Piling into Crude Oil!
1️⃣ US Stocks: Don’t Be Fooled by the Rally!
In the Nasdaq, smart money is “taking profits” at high levels, while the S&P is being propped up solely by short covering. This kind of rally that lures in bulls is the most dangerous; a major correction is highly likely next week. Don’t be the one buying at the top.
2️⃣ US Treasure/Dollar: Clear Exit Signal. Dollar bulls are fleeing in droves, and 10-year Treasury shorts have lost their nerve.
3️⃣ Gold: Smart Money is “Taking Profits.” Although gold prices look strong, data shows that major long positions have begun to be significantly reduced. This divergence between price and positioning is a dangerous signal.
4️⃣ Crude Oil: The Only “Truly Strong” Asset. US oil is the only asset in this report showing a simultaneous rise in both price and volume. Bulls are piling in with real money. The upward momentum is extremely strong.
Positioning Across Assets — Candlestick Charts — Divergence Correction, Crude Oil Dances Alone
1.Stock Index Futures: Bullish “False Fire,” Retreating to Key Support
S&P: Price-volume divergence. Positioning is extremely thin above 6,900, a weak foundation. Keep a close eye on 6,870 (MA60); a break below confirms a daily-level correction.
Nasdaq: Momentum exhaustion. A double top divergence (MOM+MFI) at the highs is confirmed. Retail is charging in, institutions are slowing down. The area above 25,500 is full of trapped longs, with pressure like a mountain. A break below 25,200 will trigger a waterfall decline, testing the MA60 support around 24,500.
US Treasuries: Suppression Continues
2-Year: Bottoming phase. Firmly suppressed by the MA120, moving sideways.
10-Year: Pure bearish alignment. No signs of bottoming at all. The upward pressure on yields remains a “death knell” for tech stocks. Only consider going long on risk assets once the 10-year breaks above its MA60.
Commodities: Crude Oil Takes the Crown, Gold & Silver Have “Fear of Heights”
WTI Crude Oil: The Bull King returns! Violently broke through the MA120. The 60–62 positioning zone has become a solid floor. The uptrend is set.
Gold: Tired of rising, taking a break. Gold is still in its main uptrend. Look to buy on dips to the MA20; the overall trend is intact.
Silver: Extreme volatility. Money Flow Index (MFI) is becoming chaotic, with many positioning vacuums, making it prone to stampedes. If it fails to reclaim the 80 level, there is a risk of a sharp drop back to the MA60.
Positioning Across Assets — Options Data
🚨 Core Warning
S&P 500: Can’t Rise Anymore! Although everyone is still bullish (Skew is high), a red bar of position reduction (negative Impulse) appeared on 1/30. To put it bluntly, large players have already started to withdraw at the highs. A fall back to 6900 is highly likely in early February. Don’t be left holding the bag.
Nasdaq: The Weakest of All! Tech stocks are now in a “Negative Gamma” state, with no brakes, only an accelerator. Once it breaks below the 25,600 bear stronghold, the stampede effect will be terrifying.
WTI Crude Oil: Mad Dog Rally, Flash Crash Imminent! Retail investors have gone crazy chasing highs (Skew broke the 0.35 theoretical limit), but institutions secretly pulled out back on 1/29. This kind of chart is most prone to a “long squeeze.” Oil prices could collapse from around 70 back below 60 at any moment.
10-Year Treasury: Bottomless Pit! The street is full of bears; there are no buyers at all. The settlement price has already fallen below the neutral line, with no signs of stopping.
✅ Core Opportunity
Japanese Yen: Depreciation is Over, Reversal! The trendline finally reversed on 1/23, and a strong buying impulse erupted on 1/30. Market makers have already adjusted their expectations. The yen is set to begin a violent rebound mode in February.
Gold & Silver: Classic Institutional Accumulation Push! The impulse in gold on 1/30 was extremely exaggerated; these are the footprints of big money entering the market. Silver is even crazier, directly breaking through the upper resistance level. February still belongs to gold and silver; any pullback is a gift.
This Week’s Outlook:
Don’t Get Burned by the “New Warsh Fire”
Everyone is betting on the “three fires” of the new Fed Chair, Warsh: more rate cuts + more aggressive QT? Honestly, don’t get your hopes up. Warsh’s appointment is not a “savior”; it might actually amplify volatility. At his core, Warsh is more stubborn than Powell (he looks at long-term trends, not short-term data) and will likely pour cold water on the hawks. Don’t get carried away by the headlines.
1️⃣ Macro: Rate Cut Expectations Still “Frozen”
Non-Farm Payrolls (2/6): Expected to be +70k, possibly even as low as +15k. As long as the unemployment rate stays around the 4.4% “soft target,” the Fed cannot turn hawkish. Everyone will have to remain in the “no jobs, no layoffs” icehouse.
BOE/ECB (2/5): Expected to do nothing. The suspense now is, facing inflation below 2%, who will be the first to start cutting rates in the spring.
2️⃣ Earnings: The “Makeup Remover” for AI Monetization
Google/Amazon: Everyone just wants to see the AI contribution from their cloud businesses. If there’s no real profit to show, the AI valuation logic will have its “makeup removed” next week.
3️⃣ Why Warsh Can’t Put Out the Fire (Three Hard Logics)
The market is now calling for rate cuts + QT, but the logic is full of flaws:
Liquidity has collapsed: The interbank market has already gone from “abundant liquidity” to “tight money,” and the SRF is already providing emergency relief. Forcing QT at this time is asking for a repeat of the 2019 repo market collapse.
Authority is locked: The core of QT involves complex regulatory frameworks like Basel 3. The Chair doesn’t have the final say; Congress does.
The “Gratitude” Trap: Although he has to show deference to Trump, he must prove to the FOMC voting members that he is not a “puppet.” His best stance this week is to do less and watch more, to act with inaction.
4️⃣ Off-the-books Move: Government’s “Technical” Shutdown
The two parties are stuck on appropriations because of trivial issues like “shootings + masks.” As long as the House bill is signed on Monday, work can resume on Tuesday. Instead of worrying about the shutdown, worry about the silver margin (CME raised to 15%). Historical pattern: Whenever an exchange moves to deleverage, it’s basically a signal of a short-term top. This ~30% pullback in silver might just be the beginning.