

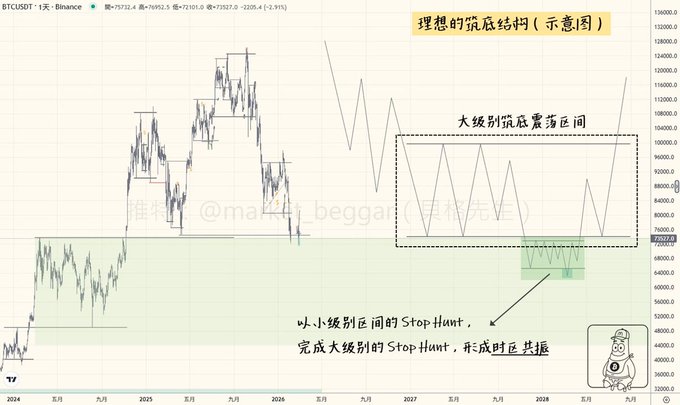
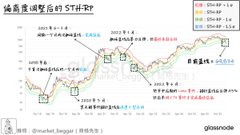
Technical Analysis 101: The Ideal Bottom Structure from a Liquidity Perspective 🪤 BTC has been in a relentless downtrend lately, and everyone’s asking the same thing: when is it time to buy the dip? I’ve already shared my trading plans and thoughts on the market’s next moves several times this week—check the thread for a recap at the end if you’re interested. Today, let’s tackle a hot topic: “What does an ideal bottom structure actually look like?” 💬 TL;DR: This post dives into bottom structures purely from a liquidity point of view—just my personal bias. Every TA school has its own take on bottoms, so this is not financial advice, just how I see it. If you want the deep-dive on concepts I mention, check the links or the summary at the end. // First, looking at things through the lens of “liquidity magnetism,” here’s what makes an ideal bottom: 🔺 Prolonged consolidation: Enough time for proper accumulation/distribution. The longer the chop, the more consensus and shakeout. 🔺 No uncleared liquidity left below the consolidation zone. 📖 In-depth Stop Hunt Mechanics: x.com/market_beggar/status/190... Recent price action proves point #2. Quick recap: After BTC’s local bottom during the dump on Nov 21, 2025, we had a 2-month chop fest. I was tracking that structure and posting real-time updates. But in the end, tons of liquidity was left uncollected below the range—creating a liquidity magnet and setting up for further downside risk. And you know what happened next: price nuked the range lows, failed to form a real bottom ❌ For reference, here’s my analysis from back then: 📖 The Gravitational Pull of Liquidity (2026/01/21) x.com/market_beggar/status/201... 📖 Rising Downside Risk & The Calm Before the Storm (2026/01/26) x.com/market_beggar/status/201... // Given current market conditions, whether we get: ➡️ Scenario 2: Stop hunt at 74K ➡️ Scenario 3: Even deeper correction From a liquidity perspective, we want the bottoming structure to tick both boxes above. Say the bottom forms around the “deviation-adjusted STH-RP model blue line 🔵”, then ideally, the chart should look like this: ✅ Sideways range forms near the blue line ✅ Before the bottom is set, we get a proper stop hunt on the range low ✅ Since this is a higher timeframe structure, price might not instantly reclaim after sweeping the lows ✅ Small range forms below the main range, with another stop hunt for confluence 🚫 What we DON’T want: price mooning straight up while leaving a liquidity cluster below 🚫 What we DON’T want: a bottom forming too quickly, without proper accumulation/chop 📖 “The Power of the Blue Line”: BTC’s Strong Support & Historical Recap x.com/market_beggar/status/201... Same logic applies if we see a sideways range at other price levels—monitor with the same principles. For stop hunt confirmation, check the threads at the end—I mainly look for strong Taker activity, but won’t go into details here. // The 2-month chop after Nov 21, 2025, was a textbook example of a “bad” bottom—left a liquidity magnet below, and you saw what happened. Going forward, wherever the bottoming range forms and whenever the Taker steps in, the ideal structure has to check those boxes. That’s when I’ll be looking to ape in with size 🔋 Finally, here’s a roundup of all my recent analysis—my entire playbook is basically public. Dive in if you want more details: 📖 “74K Inevitable”: New Liquidity Magnet Zone Forming (Full Trade Plan Inside) x.com/market_beggar/status/201... 📖 “Gap Filling”: 74K Target Hit, Where’s the Bottom for BTC? x.com/market_beggar/status/201... // If you want to get hands-on with liquidity-based trading, I’ve written detailed guides before—here’s the collection, hope it helps: 📖 2 Entry Methods in My Personal Perps Swing System x.com/market_beggar/status/194... 📖 RektProof Model Translation & My Take x.com/market_beggar/status/194... 📖 Receipts Included: How I Nailed Two ETH Pumps with Liquidity Analysis x.com/market_beggar/status/195... That’s it for today, hope you found this useful 🫡
This article is machine translated
Show original

貝格先生
@market_beggar
02-03
「藍線的神威」:聊 BTC 下方的強力支撐位 & 歷史覆盤📊
誠如昨日的分析帖所言(下方引文),BTC 現已在下方約 74.5K 的位置,
再次形成了新的 Equal Lows,也就是 liquidity 聚集區,
我也因此判定未來有高概率重返 74.5K。
接著此話題,今天再來和深入聊聊目前最接近現價的模型強支撐位👇: x.com/market_beggar/…
From Twitter
Disclaimer: The content above is only the author's opinion which does not represent any position of Followin, and is not intended as, and shall not be understood or construed as, investment advice from Followin.
Like
Add to Favorites
Comments
Share


