
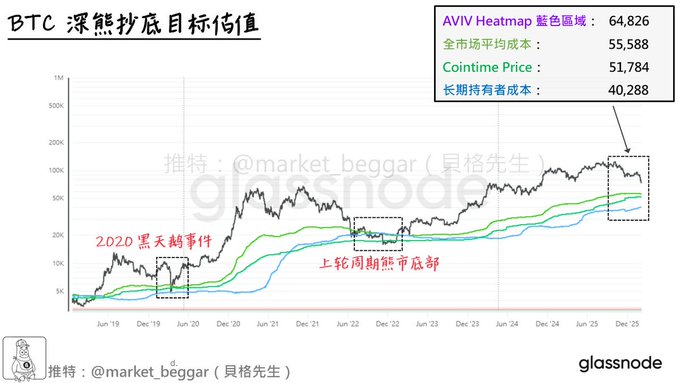
Latest BTC Deep Bear Valuation Data: Cheap BTC Is Almost Here 💎 Yesterday, BTC saw an extremely rare “single-day drop of over 10%,” with massive volume on the daily chart—a nearly 10,000-point crash that silently wiped out the market. Unfortunately, if you were hoping for Scenario 2, it’s probably time to let go. The market remains tough, so let’s get ready to weather the crypto winter 👇: Check the attached chart—there are 3 colored indicator lines: ➡️ Realized Price (market-wide average cost) ➡️ Cointime Price (time-weighted market average cost) ➡️ LTH-RP (long-term holders’ average cost) And of course, the AVIV Heatmap—the “cycle thermometer”—is here too, so I’ve marked the blue zone border 🔵 for reference and comparison. Historically, aside from AVIV (which is a “zone” concept), the other three lines have been 100% win-rate deep bear bottom indicators. In other words, even if price dips below them, the bear market bottom never strays far. If you’re new or don’t know these indicators, check out the detailed guides below 👇: 📖 AVIV Heatmap: x.com/market_beggar/status/194...… 📖 Realized Price: x.com/market_beggar/status/186...… 📖 Cointime Price: x.com/market_beggar/status/187...… 📖 LTH-RP: x.com/market_beggar/status/186...… Now, for today’s numbers: 🔸 AVIV Heatmap Blue Zone: 64,826 🔸 Realized Price: 55,588 🔸 Cointime Price: 51,784 🔸 LTH-RP: 40,288 🎞 Bonus: STH-RP model blue line (deviation-adjusted) ≈ 69K 📖 “Power of the Blue Line”: Strong BTC support levels & historical review x.com/market_beggar/status/201...… Yesterday’s crash pulled BTC much closer to deep bear valuations. That means out of my 2 planned scenarios (x.com/market_beggar/status/201...…), there’s only one path left—no signs of a 74.5K stop hunt reversal. Still, if you’re a spot holder and believe in BTC’s long-term value, there’s no need for despair. Prices are getting closer and closer to these valuation models. In plain English: BTC is getting cheaper and is fast approaching the “super golden pit” ☄️ Heads up: BTC is now at the “deviation-adjusted STH-RP model blue line 🔵.” Historically, this blue line is strong support, but rebounds aren’t always instant. For more, check the links above for detailed analysis 🔗. TL;DR: From a cycle trading perspective, and referencing my “74K is a must” analysis (x.com/market_beggar/status/201...…), there’s a solid chance this cycle’s bottom will be in the 49–74K range. IMO, current prices are prime for DCA 💰 📝 Cycle Trading: Buy only at bear bottoms, sell at bull tops—no trades in-between. I can’t predict the short- or mid-term, but from a long-term view, BTC has dropped over 45% from ATH. Combine that with the deep bear models and the “49–74K” mega accumulation zone, and my take is: “Buying here and holding patiently is a positive EV move 🔋” Of course, this is just my personal bias—not investment advice ⚠️. First rule of crypto: “Take responsibility for your own wallet.” I’m just sharing my thoughts—the final call is yours. That’s all for today—hope it helps 🫡 // 【Shill Time】 “If you’re sitting on a pile of stablecoins and don’t want to catch the bottom yet...💰” Here’s a solid yield option: Bitget Wallet Onchain Finance ✅ Long-term APY = 10%, sourced from AAVE + Bitget Wallet subsidies ✅ Stablecoin yield (USDC), minimum deposit 1 USDC, redeem anytime ✅ Transparent, no re-staking, no circular lending—low risk maintained Interested? Register with my invite code below 👇 Invite code: “3jTNi6” (manual binding required)
This article is machine translated
Show original

貝格先生
@market_beggar
01-19
BTC 深熊極端估值最新數據📊
由於目前 BTC 線型和 2022 年的下跌中繼愈來愈相似,
我在上週五專門寫了一篇長文(詳見下方引文),
和各位說明為何我認為現在並不如 2022 年那般悲觀。
我其中一項論證便是:「逐步抬升的深熊抄底線」,
今天就來和各位更新一下,目前各項深熊估值的最新數據👇: x.com/market_beggar/…

From Twitter
Disclaimer: The content above is only the author's opinion which does not represent any position of Followin, and is not intended as, and shall not be understood or construed as, investment advice from Followin.
Like
Add to Favorites
Comments
Share
Relevant content