

We've been marking the boat to find the sword again and again; is it time to buy at the buy the dips?
Written by: ChandlerZ, Foresight News
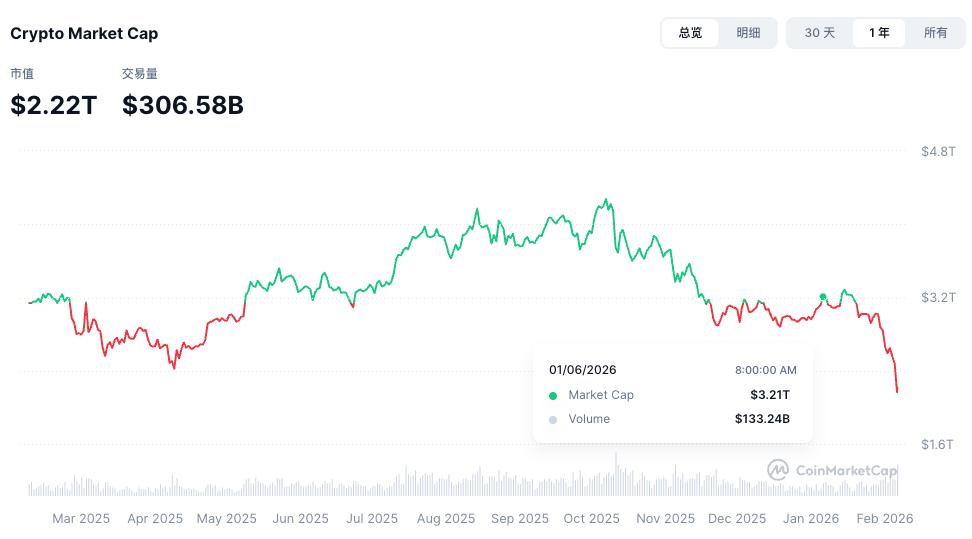
Starting at 8:00 AM on February 5th, Bitcoin plummeted from $73,000, reaching a low of $60,000 around 8:00 AM on February 6th, a drop of nearly 18% in 24 hours. It has since rebounded to around $64,000. As a result, Bitcoin's price has fallen back below the $69,000 mark, the peak of the 2021 bull market.
The Altcoin market saw widespread declines, with ETH falling from $2,200 to a low of $1,750 and SOL dropping from $92 to below $68. CoinMarket data shows that the total market capitalization of the crypto market fell from $3.21 trillion to $2.22 trillion in just one month, a loss of $1 trillion.
According to Coinglass data, the total liquidation amount in the crypto market reached $2.688 billion in the past 24 hours, of which $2.3 billion was long positions liquidated.
In global markets, the S&P 500 fell 84.32 points, or 1.23%, the Nasdaq fell 1.59%, and Bitcoin Treasury Strategy fell 17% in a single day, currently trading at $106.99, down more than 76% from its high in July 2025; spot gold fell 4%, briefly dipping below $4,700, and silver plummeted 19%, approaching the $70 mark.
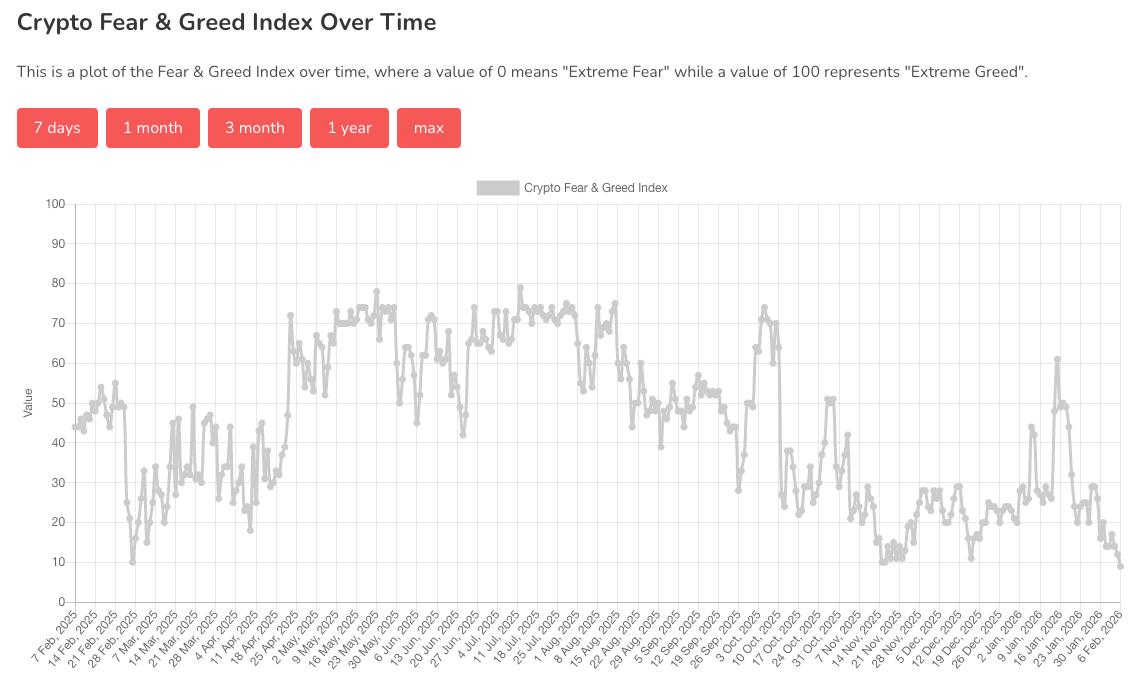
According to data from Alternative.me, the cryptocurrency fear and greed index dropped to 9 today (compared to 12 "extreme fear" yesterday), near a one-year low, indicating that the market is in a state of "extreme fear".
For many traders, the $69,000 level carries the memories of the previous bull market, and a drop below it carries significant implications. In the historical narrative of the crypto market, the bottom of each bear market has been higher than the peak of the previous bull market—this is almost considered an ironclad rule. However, the market movement in 2022 challenged this cycle for the first time. After Bitcoin reached an all-time high in November 2021, it entered a prolonged downward trend.
This round of price action has also broken through the peak of the previous bull market. This repetition seems to confirm that regardless of changes in the macroeconomic and market environment, Bitcoin's four-year cycle is still ongoing. Similar to the drop below $20,000 in 2022, the breach of the key psychological level of $69,000 is another blow to market confidence. What happened after the last drop? Can it provide some insights for our "tracing the boat to find the sword" strategy? Should we buy the dips?
After the last drop below the peak
In mid-June 2022, after a 220-day decline from its peak, the price of Bitcoin fell below $20,000, a psychological level near the peak of the 2017 bull market. This period was characterized by a significant single-month drop; in June 2022, Bitcoin fell by nearly 43%, marking a rare monthly pullback in recent years.
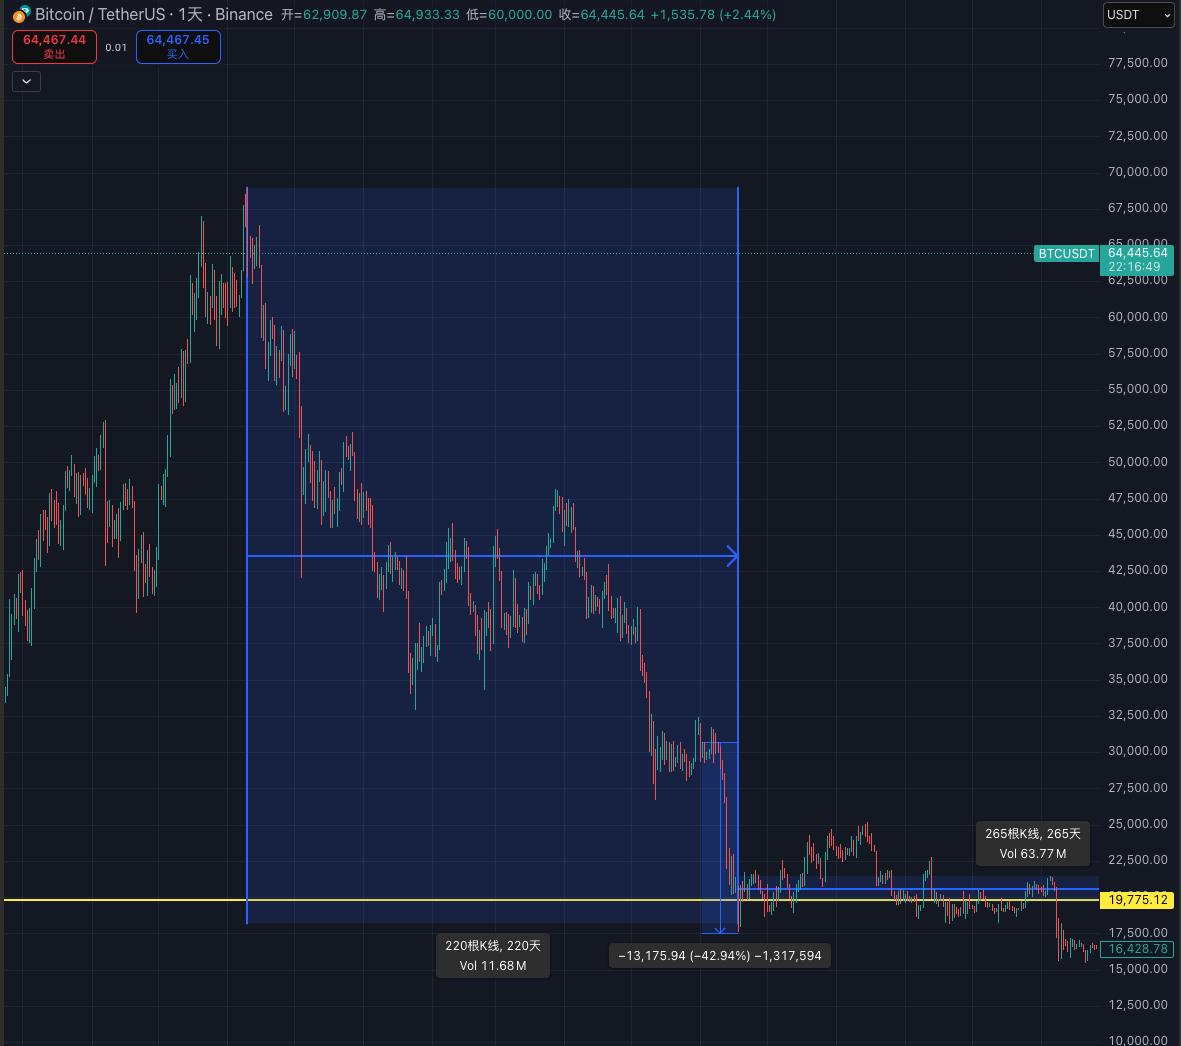
The impact of this event was enormous. It meant that investors who bought near the peak of the 2017 bull market and held on were now facing paper losses. Market confidence was severely damaged, and the cyclical belief that "bear markets won't fall below previous highs" was shattered for the first time by the mainstream market cycle.
After breaking below this level, the market did not immediately find support. Selling pressure continued to emerge, and the price of Bitcoin continued to decline, hitting a low of approximately $17,600 around June 18th. At this point, market panic reached its peak. On-chain data showed signs of whale addresses reducing their holdings, and long-term holders also began to waver, with various fear and greed indices pointing to "extreme fear." The market during this phase was characterized by price declines accompanied by a significant increase in trading volume, indicating that a large number of investors chose to exit the market.
The combined effect of macroeconomic headwinds and industry implosion
The price collapse was not an isolated event; it was the result of a concentrated outbreak of macroeconomic headwinds and internal industry risks.
First, at the macro level, the Federal Reserve, in response to soaring inflation, initiated its most aggressive interest rate hike cycle in decades. Global liquidity tightened rapidly, and all risk assets, including US stocks and Bitcoin, faced significant valuation pressure. Under a strong dollar cycle, Bitcoin exhibited a high positive correlation with tech stocks such as the Nasdaq, both initiating a downward trend.
Secondly, within the crypto industry, a series of black swan events followed one after another. From the collapse of the Terra/LUNA algorithmic stablecoin in May to the liquidity crises and eventual bankruptcies of well-known institutions such as Three Arrows Capital and Celsius in June, market leverage was violently wiped out. These forced liquidations and shutdowns created a death spiral, providing direct selling pressure for the decline in Bitcoin prices. The drop below $20,000 was a direct consequence of the concentrated explosion of these internal risks.
What happened next?
From falling below $20,000 in June 2022 to reaching the final low of this bear market (around $15,500) after the FTX exchange crash in November of the same year, the market experienced a five-month-long bottoming-out period. During this time, prices attempted to rebound multiple times, but failed to effectively hold above $20,000, indicating extremely fragile market confidence.
The collapse of FTX was the final blow, completing the market's final deleveraging process. A key market signal is that despite the extreme panic triggered by the FTX crash, Bitcoin's price did not fall significantly below the lows reached in June by institutions like Three Arrows Capital, indicating a significant strengthening of market support at that price level.
It can be argued that the market completed the core phase of this bear market's power shift and stress test in the $17,000 to $20,000 range. The subsequent price action entered a prolonged period of consolidation and recovery with shrinking trading volume. It wasn't until early 2023, with the slowdown in expectations of macroeconomic interest rate hikes and the market beginning to speculate on new narratives, that Bitcoin regained the $20,000 mark and began a new upward cycle. This was 210 days after it first fell below $20,000.
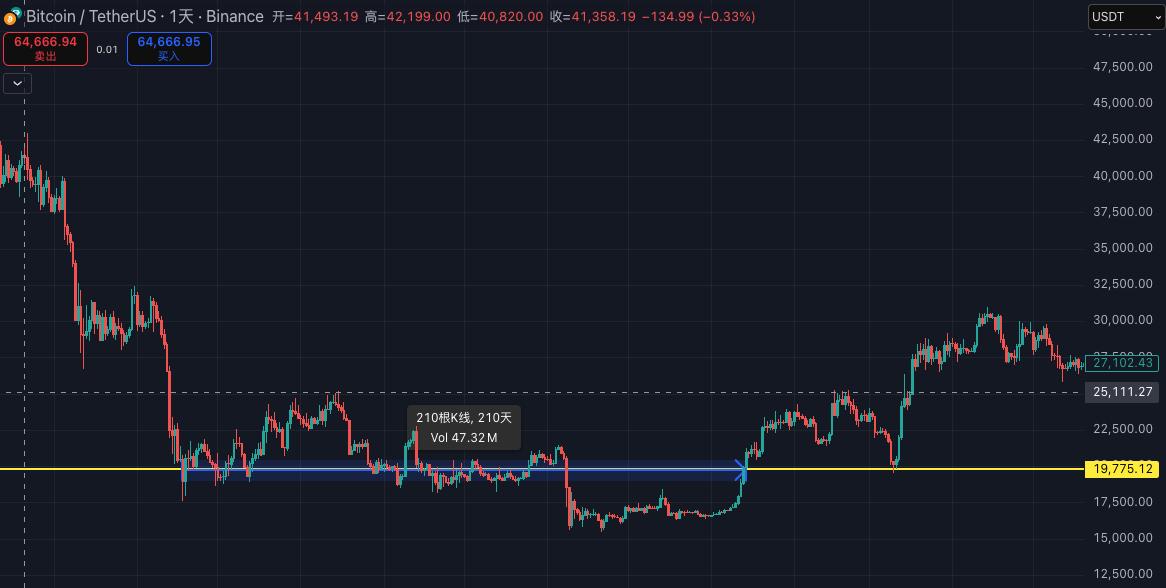
A break below a support level doesn't immediately signal a bottom. Typically, it first experiences a prolonged period of consolidation and failed rebounds, followed by a deeper decline due to credit shocks or liquidity events, eventually forming a bottom in a lower range. It then takes several months to a year or more to recover and return to the previous high range. This scenario is very typical of the path observed from 2022 to 2023.
Is it a good time to buy the dips? How buy the dips it?
Trying to buy at the very buy the dips without careful consideration is always dangerous. When a key, long-term support level is broken for the first time, it usually means that a violent panic sell-off has just begun, not ended. While the prices in June 2022 were tempting, the market's downward momentum was far from exhausted. The true bottom of a bear market is less a precise price point and more a long and arduous period of time.
This bottoming phase has distinct characteristics. After a sharp decline, the market enters a flat phase characterized by continuously shrinking trading volume and narrowing price fluctuations. At this point, the market atmosphere has shifted from initial panic to utter numbness and despair. Social media is no longer buzzing with get-rich-quick stories; instead, there's a profound silence, and even the most steadfast holders begin to question their existence. This period of market apathy, with no one paying attention, is often the most prominent psychological feature of the bottoming phase.
True bottom confirmation often requires a final stress test, frequently marked by the collapse of large institutions. The FTX crash in November 2022 played this role. When this industry giant fell, the market dipped again, but didn't create a new low significantly lower than six months prior. A high-confidence signal is when the market shows resistance to potentially fatal bad news, indicating that potential sellers have largely exited and the market has completed a thorough turnover. After this, although confidence recovers slowly, the downside potential is very limited, forming a broad and solid bottoming area.
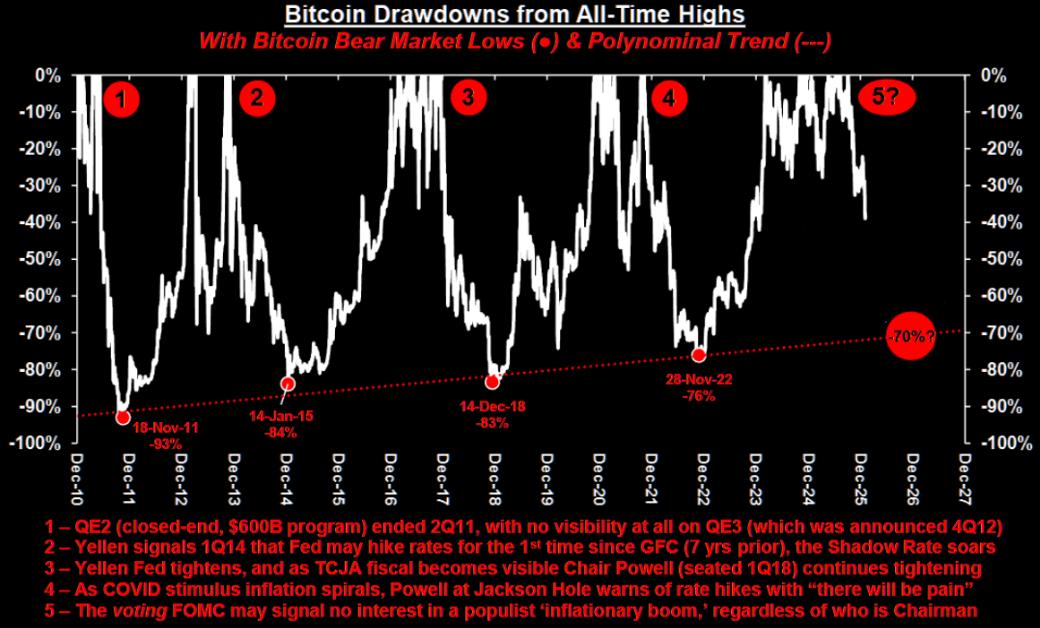
If we analyze the depth of retracements from historical highs to bear market lows, the four lows marked in the chart correspond to approximately 93% retracement in 2011, 84% in 2015, 83% in 2018, and 76% in 2022. Intuitively, the deepest declines in bear markets are gradually converging. Following this trend, it's speculated that the bottom of this bear market might be around a 70% retracement.
Regarding how to buy the dips, analyst Phyrex Ni offered a perspective from a human psychology standpoint. Phyrex stated that one can use the VIX fear index to determine the timing of buy the dips Bitcoin at the bottom, a strategy he has long used. Buy the dips data has shown that this method is effective, especially when market sentiment is extremely negative.
The buy the dips for VIX can be divided into several stages:
- When VIX < 20, the fluctuations are generally within the normal range.
- When VIX < 25, we have entered the early stages of panic. This may not be the best time to buy the dips, but it can be used for observation, especially for assets that have fallen significantly.
- VIX > 25 is a relatively rare occurrence, and such events are often event-driven, such as the two instances in October and November 2025, one due to a shutdown and the other due to tariffs. Rebounds are usually observed after these events end. Position building can begin during this phase, depending on the situation.
- VIX > 30 is a rare occurrence, usually representing extreme events with a more pronounced scare effect on the market. These are often times when buying success rates are higher.
- When VIX > 40, the market has started spreading bearish sentiment. When this happens, it's a good time to increase investment. All backtesting data shows that investing in BTC in this range is very stable, but it's still quite difficult for it to exceed 40.
- A VIX > 50 is a very rare occurrence. The last time it happened was in April 2025 when the US made adjustments, especially the tariff war with China. Historical backtesting data shows that when the VIX exceeds 50, it often shows a sharp upward trend in a short period of time.
Phyrex states that the current VIX is 22.56, which is considered an observation zone. Whether to buy or not within this range is not a major issue and can be decided based on individual circumstances. However, a VIX above 25 or 30 would indeed be a more prudent time, but such instances of exceeding 30 have been relatively rare in the last two or three years.


