

Coincidence? I don't think so.
✅ 68.4K
✅ 64.7K
✅ 60.6K

IT Tech
@IT_Tech_PL
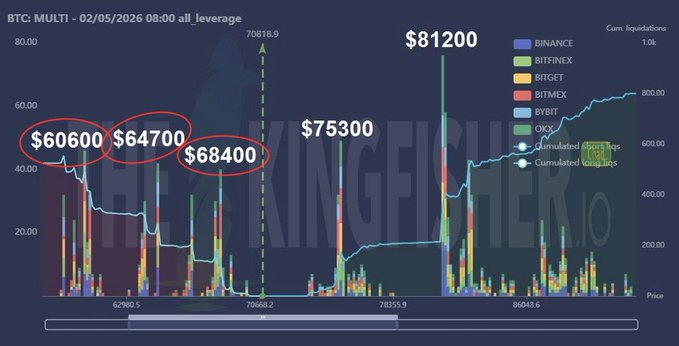
$BTC is trading like a liquidity hunt.
On the all-leverage liquidation map, the biggest pools sit below price:
• 81.2K
• 75.3K
• 68.4K
• 64.7K
• 60.6K
📊 Lose support and downside is the easier move. That’s where the stacked long leverage gets forced out.
✨ Takeaway:
Liquidity maps are useful, but they’re magnets — not destiny.
Indeed. They are like a roadmap.
From Twitter
Disclaimer: The content above is only the author's opinion which does not represent any position of Followin, and is not intended as, and shall not be understood or construed as, investment advice from Followin.
Like
Add to Favorites
Comments
Share
Relevant content


