

Author: @XinGPT
Original link: https://x.com/xingpt/status/2019792494444359955
Disclaimer: This article is a reprint. Readers can obtain more information through the original link. If the author has any objection to the reprint format, please contact us and we will modify it according to the author's request. This reprint is for information sharing only and does not constitute any investment advice, nor does it represent Wu Blockchain views or positions.
With the Spring Festival approaching, a series of sharp declines followed. First, gold and silver prices collapsed from their highs, then cryptocurrencies began to fall like a flood without any support, breaking through all key support levels. Finally, US stocks, Hong Kong stocks, and A-shares all plummeted. Losses occurred day and night, and losses continued on both sides. Assets were allocated to different sectors, and all of them failed.
Fortunately, I had basically liquidated my crypto assets, but I couldn't escape the stock market crash. Some stocks, such as Figma and XPeng Motors, saw my holdings drop by more than 70% (not 70% of my total assets, forgive me for using clickbait in the title).
There are several interpretations in the market:
• Some people say that Anthropic's legal AI is so powerful that specialized software will no longer be needed, and large models will suffice, which is why the software's stock price has plummeted.
While Google's financial results were good, its capital expenditure guidance was too high, exceeding market expectations by 50%.
It is said that the incoming Federal Reserve Chairman Warsh is a hawk who wants to maintain a strong dollar, so he will not easily cut interest rates and may even reduce the balance sheet.
I think all of the above is bullshit.
Analysts often find seemingly reasonable reasons for market declines, but these reasons are often just noise, obscuring the market's true core themes and operating logic.
No matter how powerful Anthropic's legal AI is, how much revenue has it generated? Is its revenue projected to surpass SAP's? Are software vendors like SAP just sitting back and waiting to be disrupted?
• If Google's capital expenditures are high, you say you're worried about cash flow; if capital expenditures are low, you'll definitely worry about insufficient spending, a lack of funds in the AI upstream and downstream industry chain, and Google AI falling behind.
• Warsh's statement is even more absurd. He hasn't even taken office yet, and he's already fantasizing about what he'll do after taking office. You're even more delusional than a retail investor. Even if Warsh takes office, it will be very difficult to completely overturn the Fed's previous policy stance. After all, the terrible employment data is there, and it's hard for him to be hawkish.
I believe this downturn is a result of tight liquidity and high valuations causing violent market fluctuations: just like when Alex was climbing Taipei 101, the higher he climbed, the greater the impact of the wind. On flat ground, you feel a gentle breeze, but when you reach a hundred meters in the air, the stronger the wind is, the more your heart races.
What is the current valuation level of US stocks?
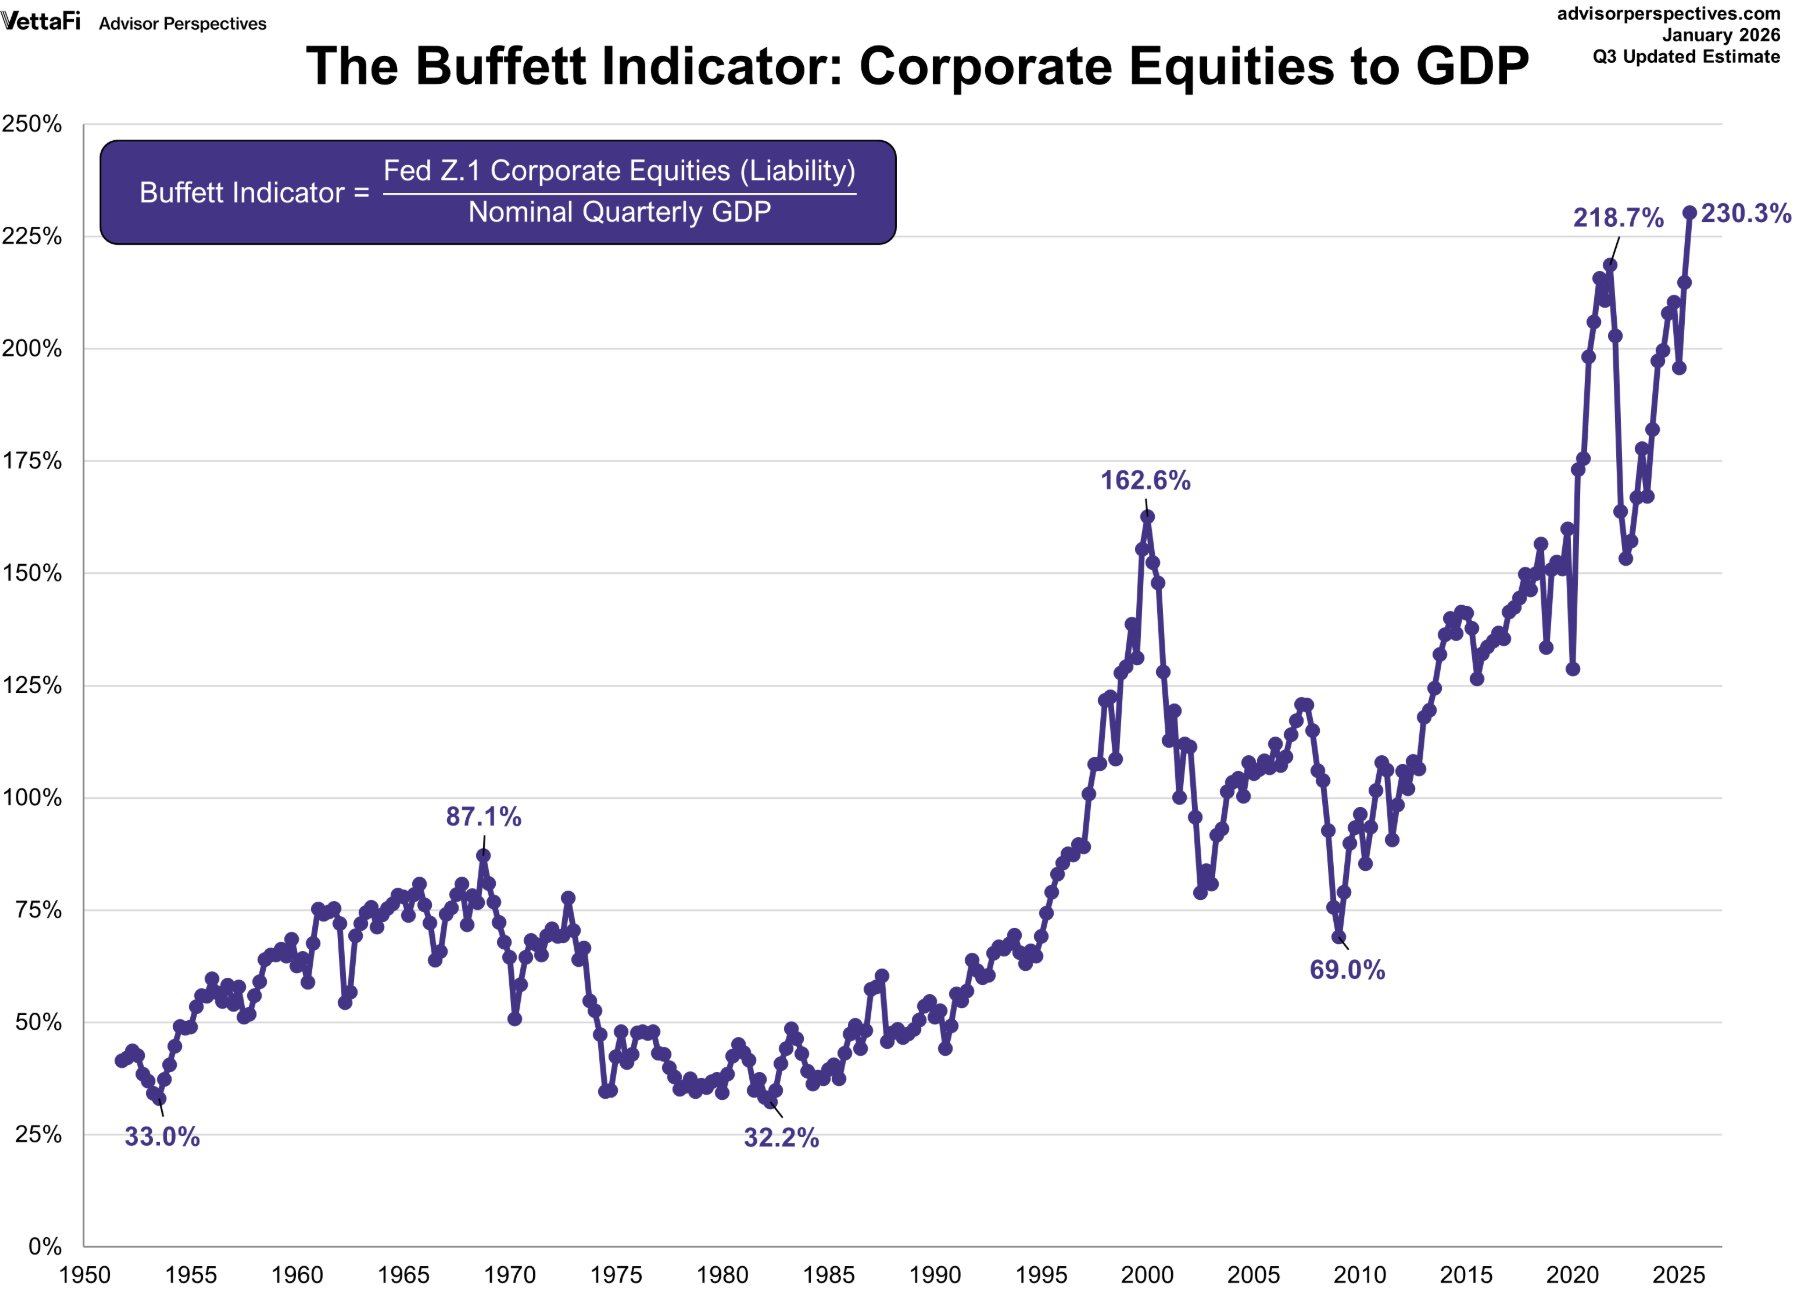
One of Buffett's metrics is the ratio of total stock market capitalization to GDP. Buffett believes that a ratio of 75%-90% is reasonable, while a ratio exceeding 120% or higher is considered severely overvalued, akin to "playing with fire."
It's worth noting that the current figure is 230%.
Of course, we all know that a high valuation doesn't necessarily mean a market crash. The Buffett Indicator, due to the lag in GDP data collection, may not actually be as exaggerated as it seems.
However, the stock is no longer in an undervalued range, which will definitely amplify market volatility, as institutions with substantial profits may take profits at any time.
The S&P 500 Forward P/E ratio is 22.0x, compared to the 30-year average of 17.1x. 22.0x is approximately (22.0 - 17.1) / (20.4 - 17.1) ≈ +1.5 standard deviations. This means the valuation is in the "significantly expensive" range, already above the "+1σ line" (20.4x), and close to the 25.2x P/E ratio during the dot-com bubble of 2000.
Meanwhile, the tight liquidity situation, like a strong wind from high above, is sweeping towards the market.
1. The first blow to tightening liquidity came from Japanese government bonds.
Every jump in Japanese government bond yields is draining liquidity from global markets.
Because Japan is the world's largest creditor nation, its long-standing zero-interest-rate policy has spurred a massive "yen carry trade." Global investors borrow low-cost yen to invest in high-yield overseas assets (such as US stocks).
If Japanese bond yields rise rapidly and spreads narrow, the attractiveness of arbitrage trading decreases or even results in losses, triggering a massive wave of liquidations: investors will need to sell overseas assets to obtain yen to repay loans. This process will lead to global deleveraging and asset sell-offs.
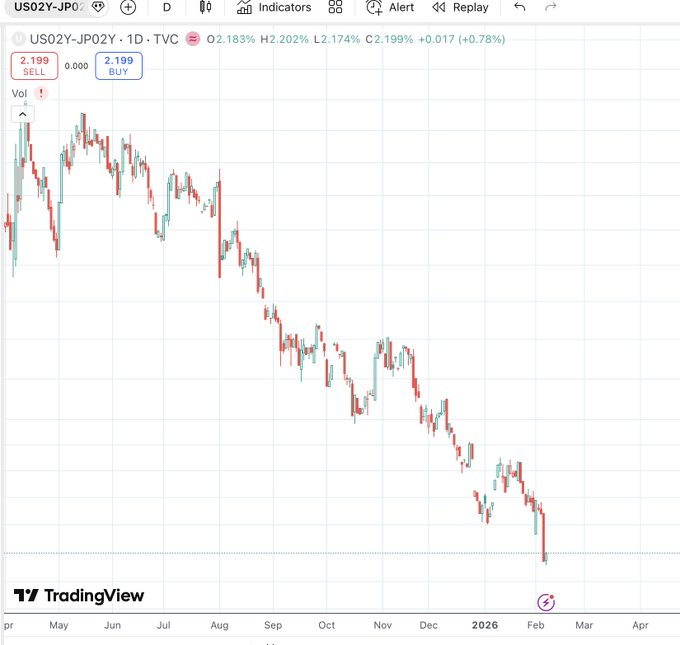
As can be seen, the short-to-medium term interest rate spread in early February, which is the 2-year US dollar interest rate minus the 2-year Japanese yen interest rate, has fallen significantly; this means that carry trades that rely heavily on arbitrage need to continue to reduce leverage and consolidate funds.
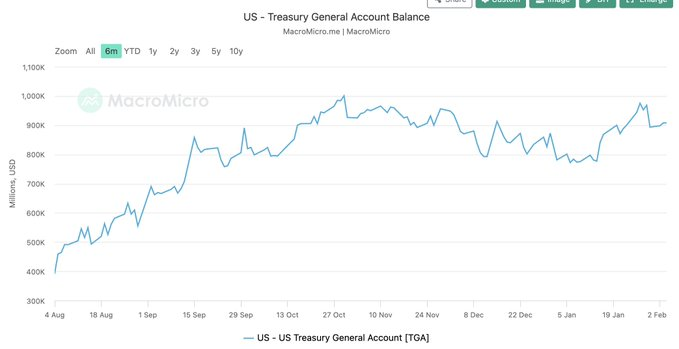
2. TGA Accounts and Treasury Bond Issuance: A Decisive Measures
The U.S. Treasury General Account (TGA) is a key variable affecting market liquidity. When the Treasury increases the TGA balance through bond issuance or taxation, it's equivalent to withdrawing funds from the financial system, leading to a decrease in bank reserves and thus tightening liquidity. Conversely, when the Treasury spends (reducing the TGA balance), it injects liquidity into the market.
In early February 2026, the market was facing the dual pressures of TGA restructuring and large-scale government bond issuance:
• High TGA Balance: As of early February, the TGA balance remained at a high level of approximately $893.2 billion. The U.S. Treasury plans to maintain the balance at $850 billion by the end of March and reach a peak of approximately $1.025 trillion by the end of the tax season in April. This means that the Treasury will continue to withdraw funds from the market.
• Large-scale Treasury bond issuance: In early February, the Treasury announced a large-scale quarterly refinancing plan to supplement TGA and finance the fiscal deficit, further exacerbating the tight liquidity situation in the market.
This "drastic measure" directly led to a decrease in bank reserves, forcing financial institutions to tighten credit and sell assets to obtain liquidity, thereby triggering a chain reaction in the market.
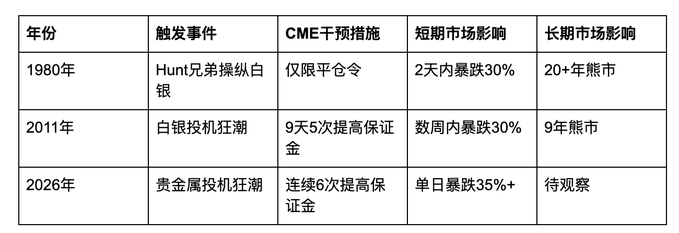
3. CME Raises Margin Requirements: A Historic "Deleveraging"
When extreme volatility occurs in the precious metals market, the Chicago Mercantile Exchange (CME) forces the market to deleverage by raising margin requirements for futures contracts, a move that has historically played the role of a bull market terminator on many occasions.
The precious metals crash in early February 2026 was highly correlated with the CME's continuous intervention. After silver prices hit record highs, the CME raised margin requirements for gold and silver futures six times in a row, with the initial margin for silver increasing from 11% to 18%. For long positions that had already suffered heavy losses, this was tantamount to "rubbing salt into the wound," directly triggering a stampede of liquidations.
The following are some of the most notable increases in margin requirements in history and their subsequent effects:
The liquidity issue needs to be addressed by focusing on liquidity.
In addition to studying the fundamentals of US stock companies and the macro-level statements from the Federal Reserve meetings, I believe the following liquidity indicators deserve close attention:
1) Settlement layer funds (water level)
Net liquidity = Total assets of the Federal Reserve - TGA - ON RRP (overnight reverse repo)
It is a directional indicator of "cash available in the market." A decline in net liquidity generally means that the funding environment is tightening.
2) Short-term funding costs (Are funds expensive?)
SOFR (Overnight Financing Rate)
An abnormal rise in SOFR indicates that short-term funds are becoming more expensive, making the market more prone to volatility.
3) Interest rate fluctuations (can market making and leverage withstand them?)
MOVE (US Treasury Volatility Index)
An upward movement in MOVE implies greater interest rate volatility, reduced balance sheet expansion by intermediaries, decreased leverage, and a greater likelihood of risky assets experiencing passive declines.
4) The global deleveraging chain (one of the most common reasons for a "sudden tightening")
USDJPY (Will there be a rapid appreciation of the Japanese yen?)
US2Y - JP2Y spread (is the carry trade base narrowing?)
The appreciation of the yen, coupled with the narrowing of spreads, resembles the start of a carry trade deleveraging process.
5) Credit Confirmation (Has the tightness already spread to the financing side?)
HY OAS (High Yield Credit Spread)
The widening of the HY OAS indicates a deteriorating financing environment, making it easier for the decline in risky assets to spread.
Original link: https://x.com/xingpt/status/2019792494444359955
Disclaimer: This article is a reprint. Readers can obtain more information through the original link. If the author has any objection to the reprint format, please contact us and we will modify it according to the author's request. This reprint is for information sharing only and does not constitute any investment advice, nor does it represent Wu Blockchain views or positions.
With the Spring Festival approaching, a series of sharp declines followed. First, gold and silver prices collapsed from their highs, then cryptocurrencies began to fall like a flood without any support, breaking through all key support levels. Finally, US stocks, Hong Kong stocks, and A-shares all plummeted. Losses occurred day and night, and losses continued on both sides. Assets were allocated to different sectors, and all of them failed.
Fortunately, I had basically liquidated my crypto assets, but I couldn't escape the stock market crash. Some stocks, such as Figma and XPeng Motors, saw my holdings drop by more than 70% (not 70% of my total assets, forgive me for using clickbait in the title).
There are several interpretations in the market:
• Some people say that Anthropic's legal AI is so powerful that specialized software will no longer be needed, and large models will suffice, which is why the software's stock price has plummeted.
While Google's financial results were good, its capital expenditure guidance was too high, exceeding market expectations by 50%.
It is said that the incoming Federal Reserve Chairman Warsh is a hawk who wants to maintain a strong dollar, so he will not easily cut interest rates and may even reduce the balance sheet.
I think all of the above is bullshit.
Analysts often find seemingly reasonable reasons for market declines, but these reasons are often just noise, obscuring the market's true core themes and operating logic.
No matter how powerful Anthropic's legal AI is, how much revenue has it generated? Is its revenue projected to surpass SAP's? Are software vendors like SAP just sitting back and waiting to be disrupted?
• If Google's capital expenditures are high, you say you're worried about cash flow; if capital expenditures are low, you'll definitely worry about insufficient spending, a lack of funds in the AI upstream and downstream industry chain, and Google AI falling behind.
• Warsh's statement is even more absurd. He hasn't even taken office yet, and he's already fantasizing about what he'll do after taking office. You're even more delusional than a retail investor. Even if Warsh takes office, it will be very difficult to completely overturn the Fed's previous policy stance. After all, the terrible employment data is there, and it's hard for him to be hawkish.
I believe this downturn is a result of tight liquidity and high valuations causing violent market fluctuations: just like when Alex was climbing Taipei 101, the higher he climbed, the greater the impact of the wind. On flat ground, you feel a gentle breeze, but when you reach a hundred meters in the air, the stronger the wind is, the more your heart races.
What is the current valuation level of US stocks?
One of Buffett's metrics is the ratio of total stock market capitalization to GDP. Buffett believes that a ratio of 75%-90% is reasonable, while a ratio exceeding 120% or higher is considered severely overvalued, akin to "playing with fire."
It's worth noting that the current figure is 230%.
Of course, we all know that a high valuation doesn't necessarily mean a market crash. The Buffett Indicator, due to the lag in GDP data collection, may not actually be as exaggerated as it seems.
However, the stock is no longer in an undervalued range, which will definitely amplify market volatility, as institutions with substantial profits may take profits at any time.
The S&P 500 Forward P/E ratio is 22.0x, compared to the 30-year average of 17.1x. 22.0x is approximately (22.0 - 17.1) / (20.4 - 17.1) ≈ +1.5 standard deviations. This means the valuation is in the "significantly expensive" range, already above the "+1σ line" (20.4x), and close to the 25.2x P/E ratio during the dot-com bubble of 2000.
Meanwhile, the tight liquidity situation, like a strong wind from high above, is sweeping towards the market.
1. The first blow to tightening liquidity came from Japanese government bonds.
Every jump in Japanese government bond yields is draining liquidity from global markets.
Because Japan is the world's largest creditor nation, its long-standing zero-interest-rate policy has spurred a massive "yen carry trade." Global investors borrow low-cost yen to invest in high-yield overseas assets (such as US stocks).
If Japanese bond yields rise rapidly and spreads narrow, the attractiveness of arbitrage trading decreases or even results in losses, triggering a massive wave of liquidations: investors will need to sell overseas assets to obtain yen to repay loans. This process will lead to global deleveraging and asset sell-offs.
As can be seen, the short-to-medium term interest rate spread in early February, which is the 2-year US dollar interest rate minus the 2-year Japanese yen interest rate, has fallen significantly; this means that carry trades that rely heavily on arbitrage need to continue to reduce leverage and consolidate funds.
2. TGA Accounts and Treasury Bond Issuance: A Decisive Measures
The U.S. Treasury General Account (TGA) is a key variable affecting market liquidity. When the Treasury increases the TGA balance through bond issuance or taxation, it's equivalent to withdrawing funds from the financial system, leading to a decrease in bank reserves and thus tightening liquidity. Conversely, when the Treasury spends (reducing the TGA balance), it injects liquidity into the market.
In early February 2026, the market was facing the dual pressures of TGA restructuring and large-scale government bond issuance:
• High TGA Balance: As of early February, the TGA balance remained at a high level of approximately $893.2 billion. The U.S. Treasury plans to maintain the balance at $850 billion by the end of March and reach a peak of approximately $1.025 trillion by the end of the tax season in April. This means that the Treasury will continue to withdraw funds from the market.
• Large-scale Treasury bond issuance: In early February, the Treasury announced a large-scale quarterly refinancing plan to supplement TGA and finance the fiscal deficit, further exacerbating the tight liquidity situation in the market.
This "drastic measure" directly led to a decrease in bank reserves, forcing financial institutions to tighten credit and sell assets to obtain liquidity, thereby triggering a chain reaction in the market.
3. CME Raises Margin Requirements: A Historic "Deleveraging"
When extreme volatility occurs in the precious metals market, the Chicago Mercantile Exchange (CME) forces the market to deleverage by raising margin requirements for futures contracts, a move that has historically played the role of a bull market terminator on many occasions.
The precious metals crash in early February 2026 was highly correlated with the CME's continuous intervention. After silver prices hit record highs, the CME raised margin requirements for gold and silver futures six times in a row, with the initial margin for silver increasing from 11% to 18%. For long positions that had already suffered heavy losses, this was tantamount to "rubbing salt into the wound," directly triggering a stampede of liquidations.
The following are some of the most notable increases in margin requirements in history and their subsequent effects:
The liquidity issue needs to be addressed by focusing on liquidity.
In addition to studying the fundamentals of US stock companies and the macro-level statements from the Federal Reserve meetings, I believe the following liquidity indicators deserve close attention:
1) Settlement layer funds (water level)
Net liquidity = Total assets of the Federal Reserve - TGA - ON RRP (overnight reverse repo)
It is a directional indicator of "cash available in the market." A decline in net liquidity generally means that the funding environment is tightening.
2) Short-term funding costs (Are funds expensive?)
SOFR (Overnight Financing Rate)
An abnormal rise in SOFR indicates that short-term funds are becoming more expensive, making the market more prone to volatility.
3) Interest rate fluctuations (can market making and leverage withstand them?)
MOVE (US Treasury Volatility Index)
An upward movement in MOVE implies greater interest rate volatility, reduced balance sheet expansion by intermediaries, decreased leverage, and a greater likelihood of risky assets experiencing passive declines.
4) The global deleveraging chain (one of the most common reasons for a "sudden tightening")
USDJPY (Will there be a rapid appreciation of the Japanese yen?)
US2Y - JP2Y spread (is the carry trade base narrowing?)
The appreciation of the yen, coupled with the narrowing of spreads, resembles the start of a carry trade deleveraging process.
5) Credit Confirmation (Has the tightness already spread to the financing side?)
HY OAS (High Yield Credit Spread)
The widening of the HY OAS indicates a deteriorating financing environment, making it easier for the decline in risky assets to spread.


