
This article is machine translated
Show original
This provides the air force with a 100% accurate warning signal for the US stock market: a red flag is flashing.
The SPX ÷ (30-year/2-year US Treasury yield) ratio:
Peaked in 2000 → Dot-com bubble burst
Peaked in 2007 → Subprime crisis
Peaked in 2018 → Christmas crash
Peaked in 2020 → Pandemic crash
Each time, a systemic shock occurred within 1-4 months.
Without exception.
Current status:
✅ The ratio has turned downwards from a high level
✅ RSI has fallen below the strong zone
✅ SPX is still hitting new highs. The bond market is no longer supporting the stock market.
Are you still fully invested?
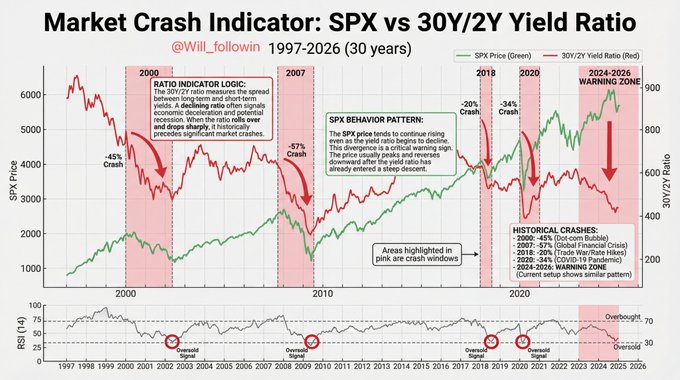
Adding a technical detail: this ratio is essentially the reciprocal of the stock market risk premium. When the 30Y/2Y yield spread narrows (the curve flattens), the denominator decreases, and the ratio spikes, indicating that the market is overdrawing on the future. Historically, every time the denominator falls from a high level, it has been accompanied by a liquidity crisis. I suggest everyone take a look at the current TED spread and VIX term structure.
From Twitter
Disclaimer: The content above is only the author's opinion which does not represent any position of Followin, and is not intended as, and shall not be understood or construed as, investment advice from Followin.
Like
Add to Favorites
Comments
Share
Relevant content