
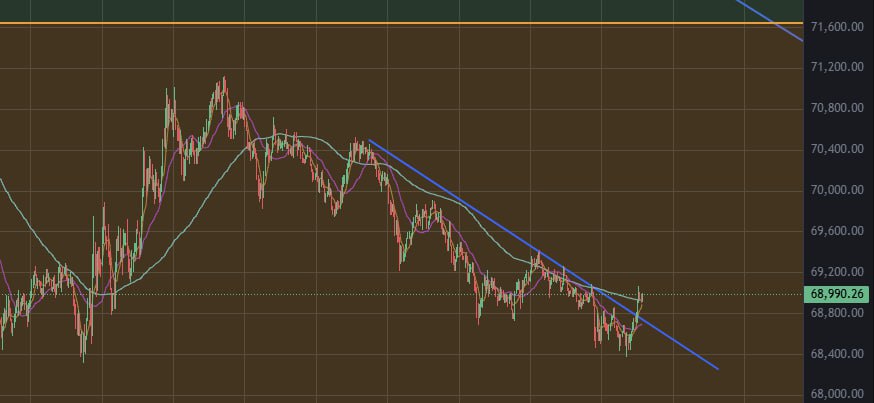
Bitcoin 15-minute chart: 68k to 72k range. It's at the bottom of the box. I entered long when the short-term downtrend broke. Today, I plan to take a longer-term view of the trend.
This article is machine translated
Show original
Sector:

Telegram
Disclaimer: The content above is only the author's opinion which does not represent any position of Followin, and is not intended as, and shall not be understood or construed as, investment advice from Followin.
Like
Add to Favorites
Comments
Share
Relevant content