

Bitcoin is still defending its position in the $60,000 to $72,000 range, while selling pressure in the $82,000 to $97,000 range is limiting any potential rebound. Capital outflows, sluggish spot trading, and cooling futures markets all indicate insufficient demand, forcing prices to react passively rather than actively break through resistance levels.
summary
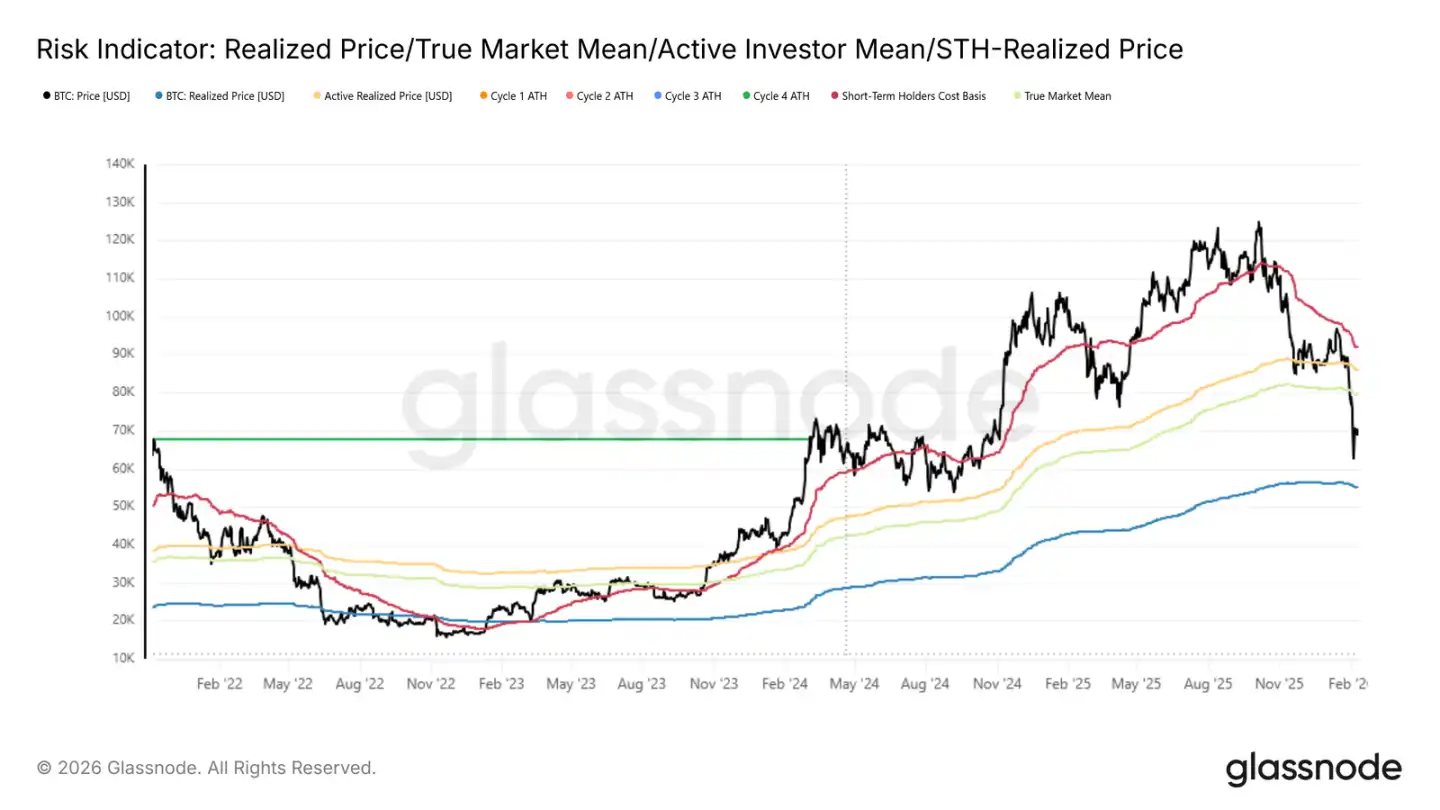
Bitcoin is stuck between its real market average (approximately $79,200) and realized price (approximately $55,000). After the structure weakened, the market has remained defensive, with selling pressure continuing in the $60,000 to $72,000 range.
• A large number of shares have been accumulated between $82,000 and $97,000 and between $100,000 and $117,000, and are currently at a loss. A rebound to these levels will encounter significant resistance.
Short-term holders generally suffer losses, new entrants lack confidence, and upward momentum is difficult to sustain.
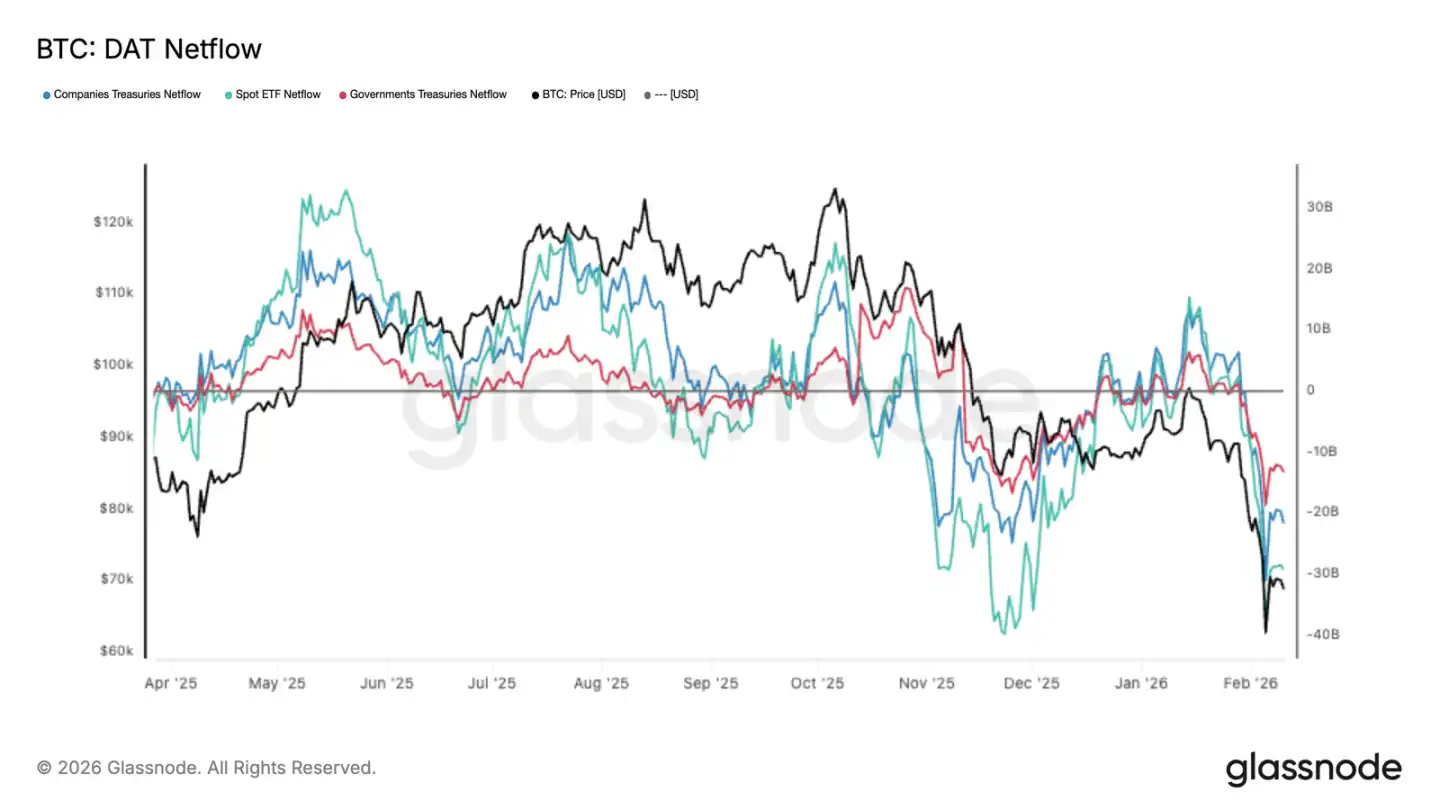
• The simultaneous net outflow of digital asset holdings by various institutions is not an isolated phenomenon, but rather a reflection of an overall contraction of risk exposure and insufficient absorption capacity in the spot market.
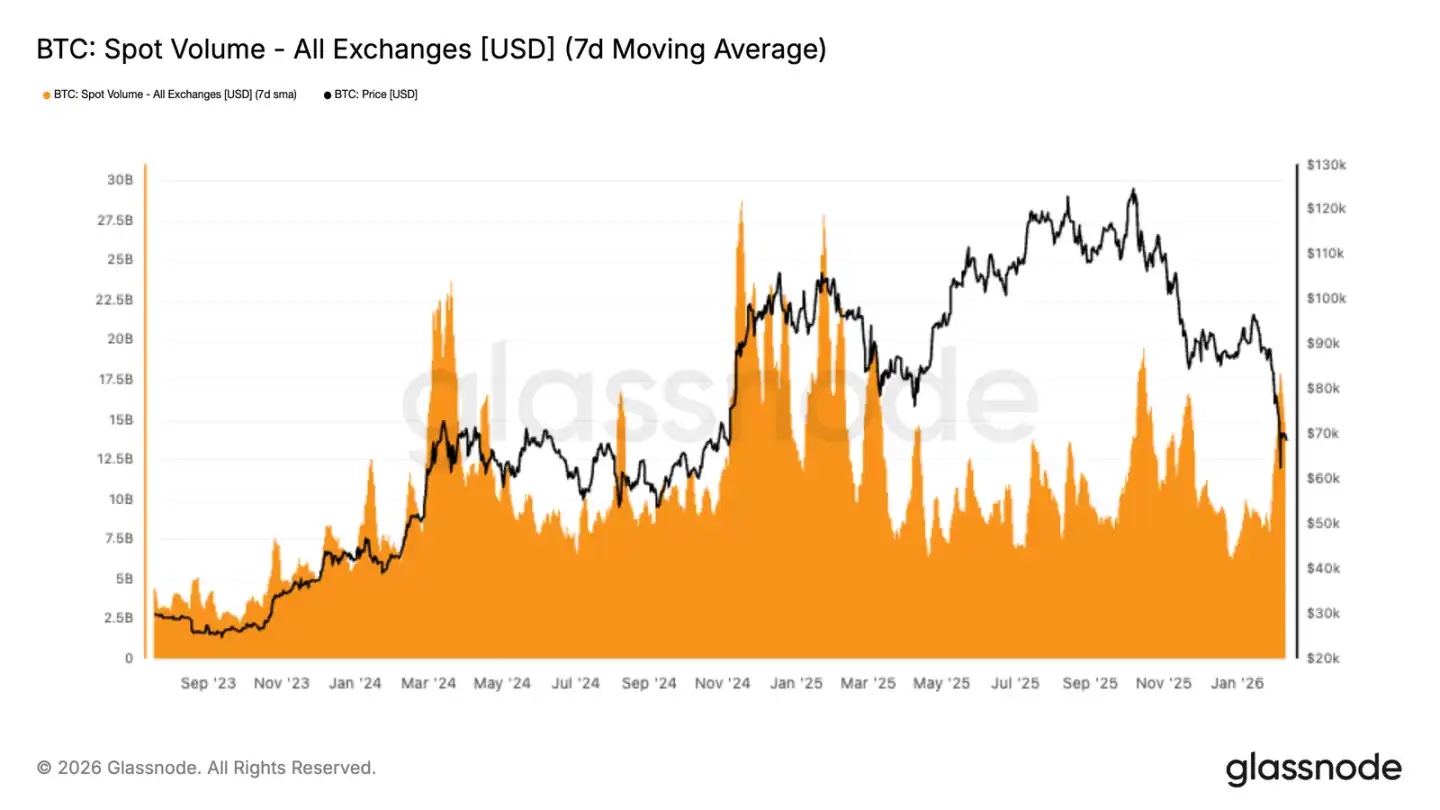
• The spot trading volume only increased during the decline and then quickly decreased, indicating that everyone was reacting passively rather than actively buy the dips.
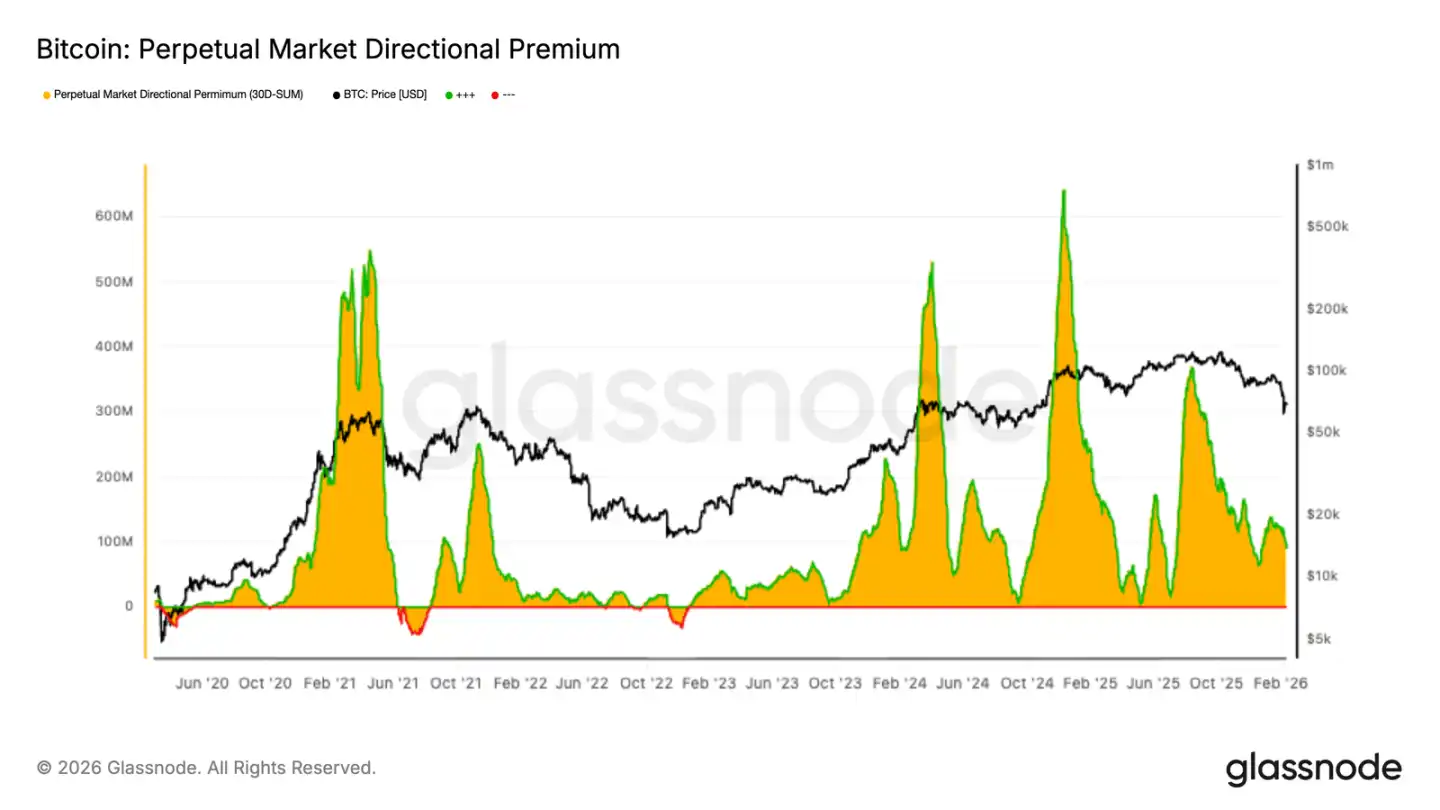
• Perpetual contracts have cooled down, premiums have been compressed, leveraged players have withdrawn, and speculative sentiment has subsided.
Implied volatility indicates that the market is still buying protection, a typical defensive stance.
• The position structure in the options market also makes prices prone to fluctuations and limited in range, given the already tight liquidity.
On-chain insights
After hitting a new high last October, Bitcoin went through three phases: first, a sharp drop, repeatedly testing the real market average; then, it traded sideways until the end of January this year; and most recently, it entered the third phase—falling below the real market average and accelerating towards $60,000.
New trading range
The upper limit of the third phase range is the real market average of 79,200, and the lower limit is the realized price of 55,000, a structure very similar to that of the first half of 2022.
Similar to the second quarter of 2022, prices are likely to fluctuate within this range, requiring time to settle as new buyers gradually enter the market and take over the goods.
To break this situation in the short term, the market either needs to be extremely strong—directly recovering the true market average of 79,200 and regaining strength—or extremely weak—an event like LUNA or FTX occurs, causing the realized price to plummet below 55,000. If neither of these extremes occurs, the most likely path for the market is to continue grinding within the range.
Range trading
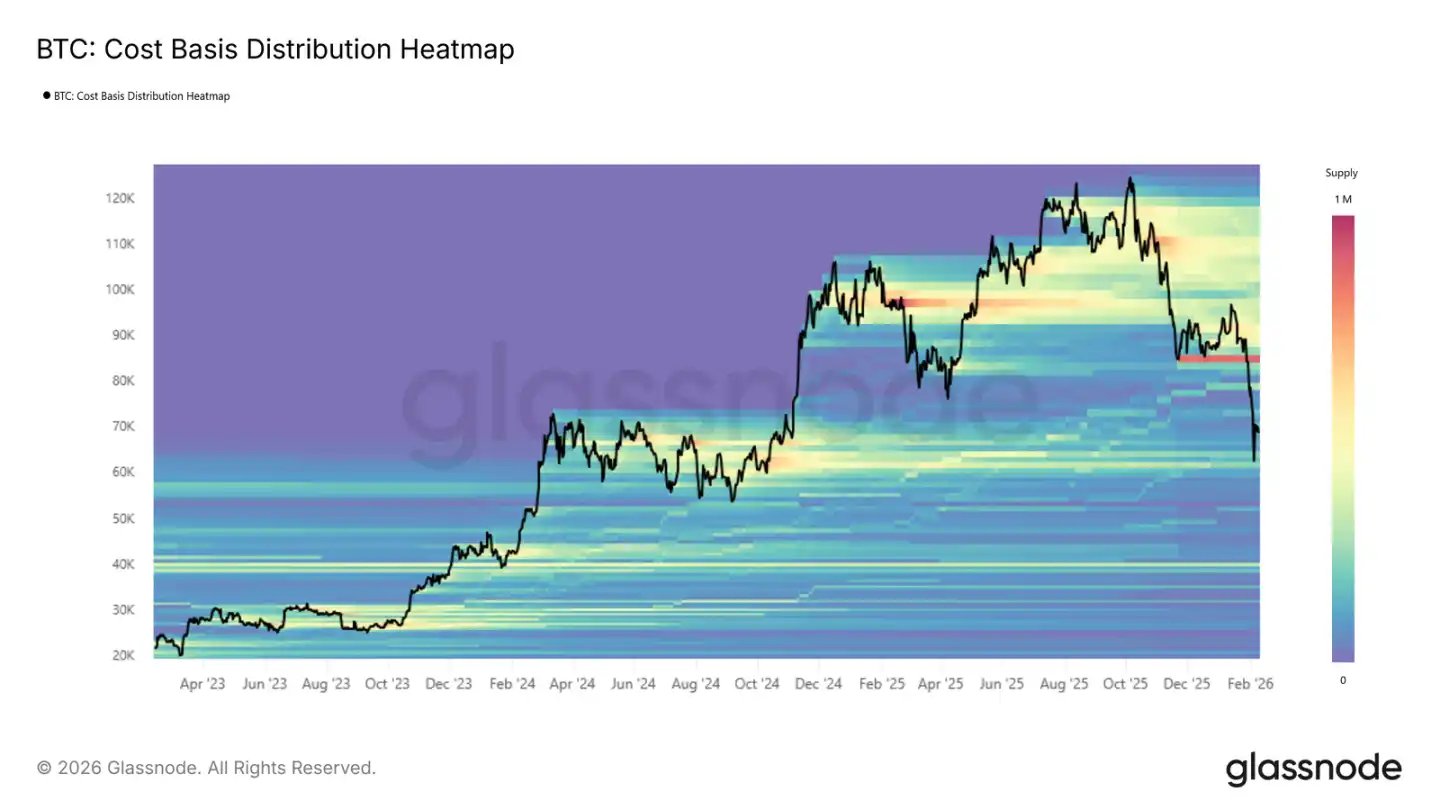
So far, the $60,000 to $72,000 range is still facing selling pressure. This range was a densely traded area in the first half of 2024, and the fact that it has held firm again indicates that there are indeed buyers at this level.
Ideally, if the market can continue to hold and accumulate shares here, just like in previous strong accumulation phases, then it can lay a solid foundation for the next wave of upward movement.
But this depends on how determined the buyers are. In the range of 60,000 to 72,000, how much real money buyers are willing to spend will determine whether the market stabilizes or falls further.
Selling pressure
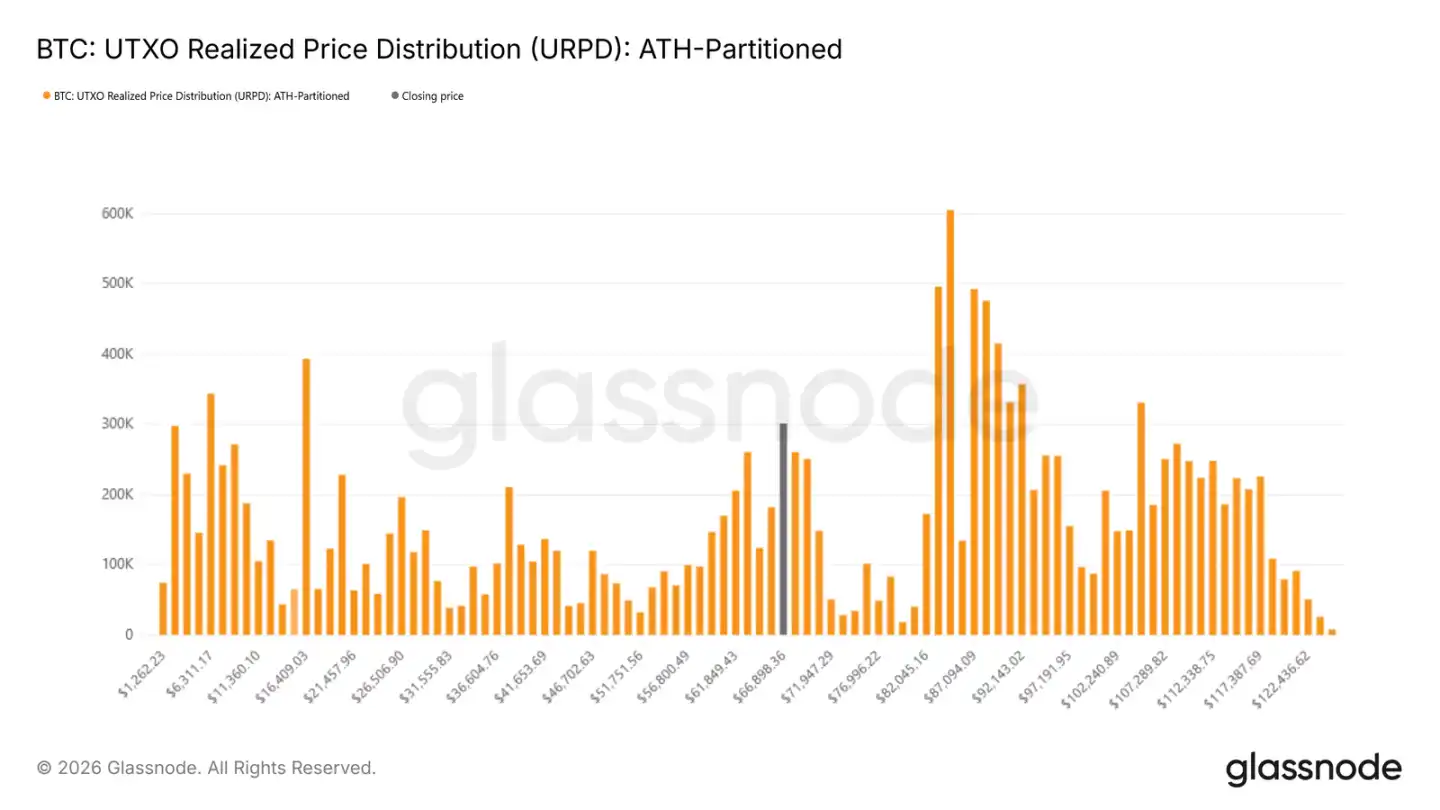
Whether the 60,000 to 72,000 range is truly showing strength can be analyzed using cost distribution. UTXO's price distribution data shows the concentration of shares at each price level. Indeed, the price found support in the densely traded area formed in the first half of 2024—60,000 to 72,000—indicating that those who bought at that time did not exit at that level and are still holding their positions.
However, selling pressure remains heavy. There is a very dense concentration of trapped investors in the 82,000 to 97,000 and 100,000 to 117,000 price ranges. If prices fail to rise for an extended period or another wave of decline occurs, these investors may be unable to withstand the pressure and cut their losses, creating new selling pressure.
Where is the top of the bear market rally?
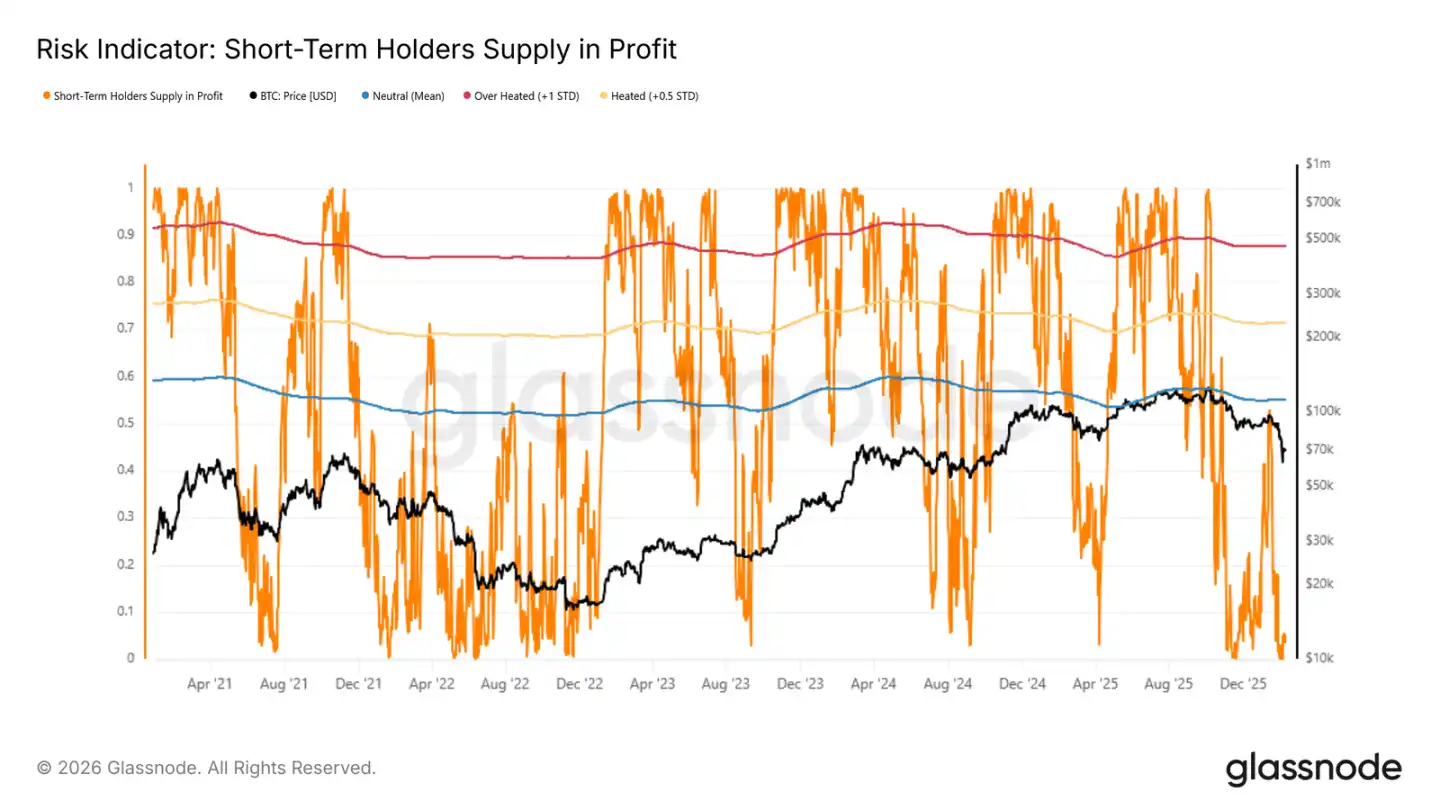
Since the market is likely to trade within a range, identifying the interim tops and bottoms is crucial. In a bear market, rallies are often seen as exit opportunities by recent buyers. Therefore, when these buyers accumulate substantial unrealized profits, a local top is often imminent.
The short-term holder profitability ratio is a good indicator for monitoring this. Historically, bear market rallies often stall when this indicator reaches its mean within +0.5 standard deviations. Currently, this figure is only 4.9%, indicating that the vast majority of recent entrants are still holding losses. With so few profitable investors, it's difficult to rely on them to drive the market down, but it also suggests a weak market with little new money entering, making a sustained rebound unlikely.
Off-chain insights
Institutional funds are withdrawing
The flow of funds into digital assets has recently turned very negative, with ETFs, corporations, and governments all experiencing net outflows. Bitcoin has also hit a new low. ETFs are the main players, but corporations and governments are also reducing their holdings. This is not just a matter of one institution adjusting its portfolio; it's a contraction across the entire market.
The outflow is huge, and the spot market simply can't absorb it. It's not that a certain type of capital is rotating, but rather that there's a comprehensive reduction in holdings. Unless this outflow of funds stabilizes, prices will continue to be dragged down by selling pressure. How much it can fall depends on when willing buyers enter the market.
Spot trading volume is sluggish
When the price fell to the low of 70,000, spot trading volume surged, and the 7-day moving average also rebounded. However, this volume was generated during the price drop, indicating that people were reacting passively rather than actively buy the dips. Moreover, the volume contracted immediately after the surge, suggesting that while some were watching, no one was buying.
This indicates that the buying power is not keeping up with the selling power. The current trading volume is not accumulation, but rather turnover and margin calls. Without sustained buying pressure, prices can easily be driven further down. The current spot volume is merely a panic-driven reaction, not a sign of stabilization.
Futures premium falls
The premium for perpetual contracts has been reduced, essentially returning to neutral. This indicates that leveraged traders have stopped their aggressive trading, unlike before when they dared to chase both long and short positions. High premiums often indicate strong consensus on the market's direction; the absence of premiums suggests the market has no clear direction.
The contraction in premiums reflects the overall sluggishness of the derivatives market, with risk appetite declining along with volatility. No one is shorting, and no one dares to go long; directional capital is scarce. Derivatives are no longer providing momentum; only the spot market is moving on its own. The current futures market sends only one signal: caution, no more playing.
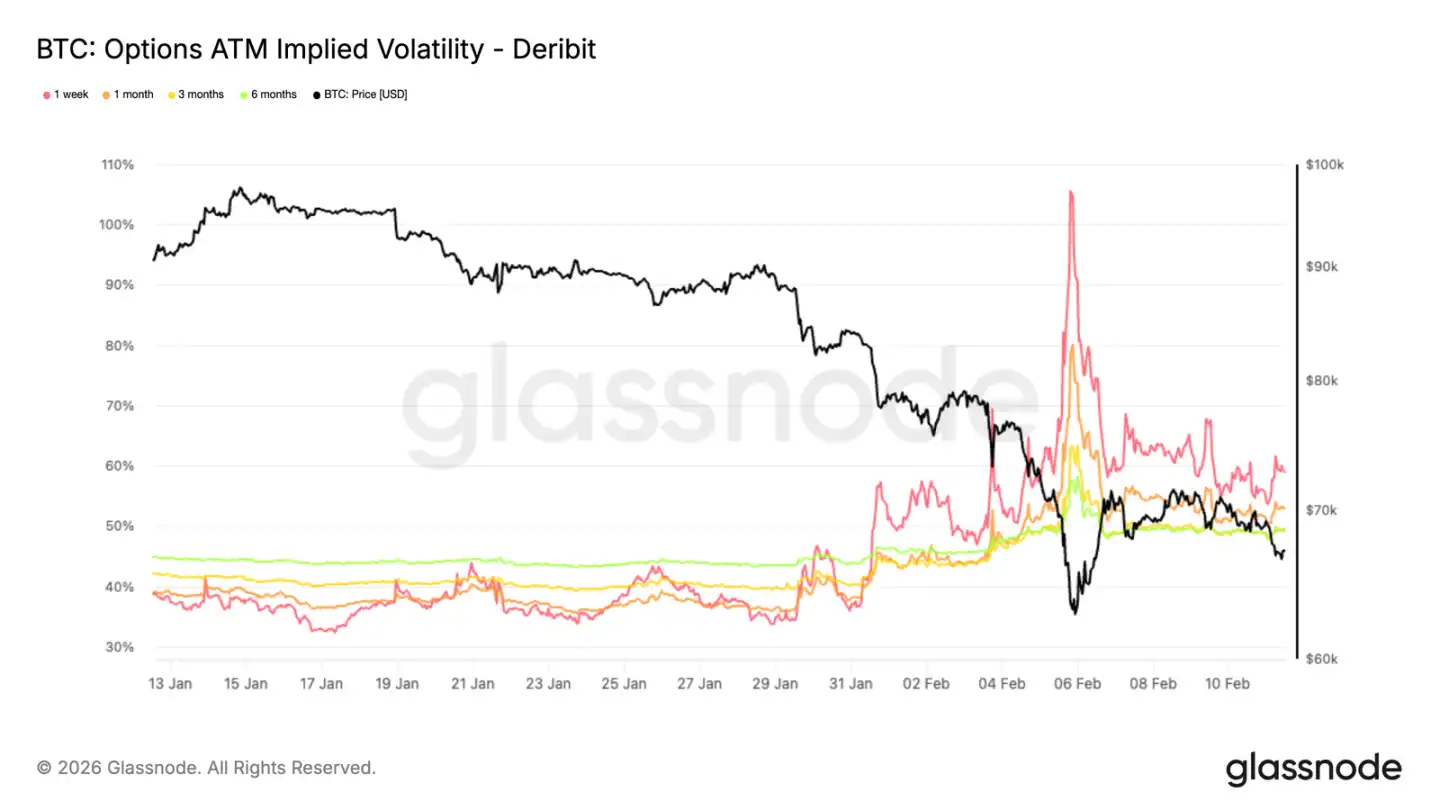
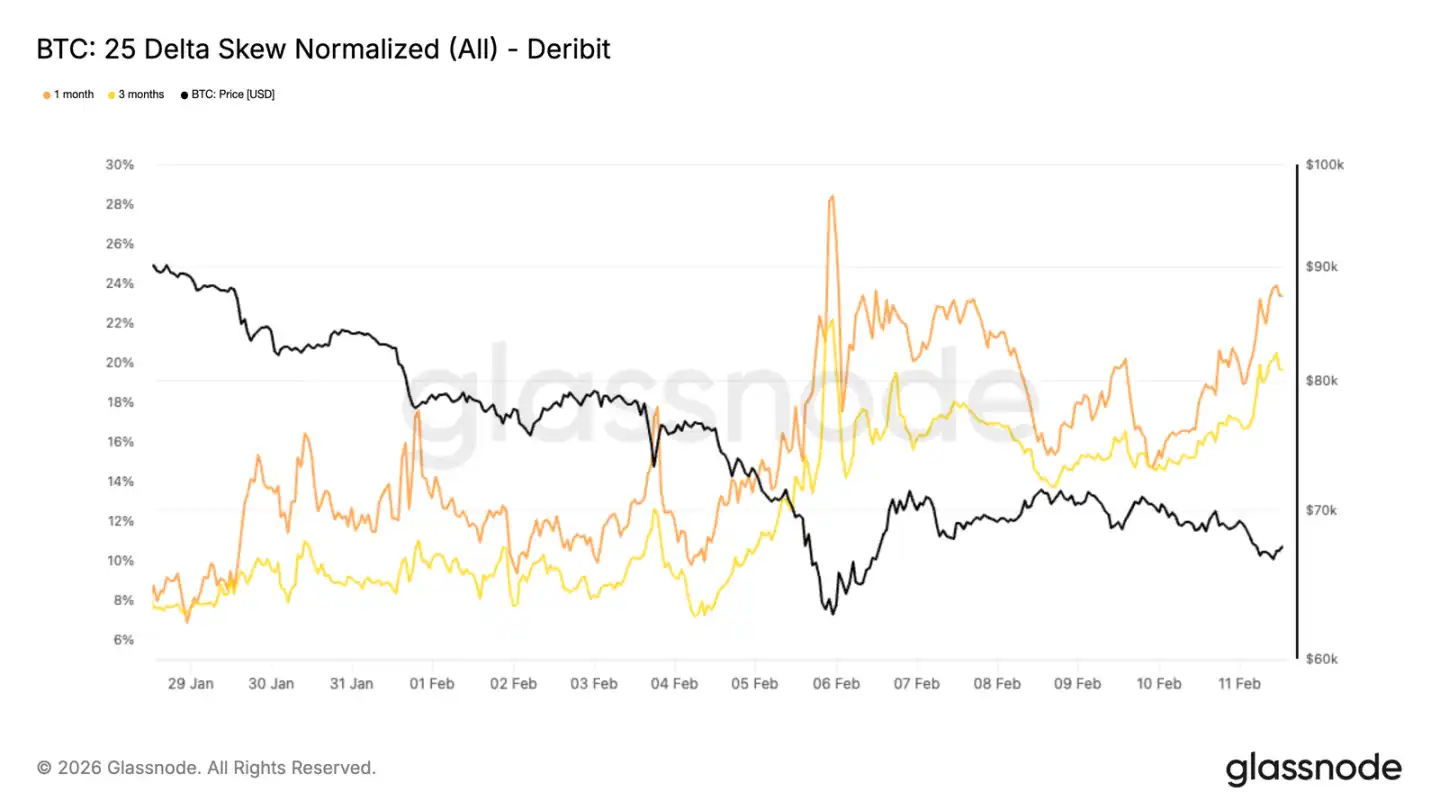
Implied volatility – risk pricing has changed
After this round of decline, the volatility structure is clearly different. Looking at the 1-month at-the-money implied volatility makes it clear that long-term volatility has been repriced: 6-month volatility has increased by 5 points, and 3-month volatility has increased by 9 points.
The most dramatic jump was in the front end, with implied volatility surging by over 20 basis points in one week. Implied volatility reflects the market's expectation of future volatility, and such a large jump couldn't be temporary. The entire term structure is being repriced for risk.
Although prices dropped somewhat afterward, they remained relatively high across all maturities, indicating that the market felt uncertainty would persist and that the situation wouldn't be resolved once the decline ended.
A delta skew of 25 indicates continued downward demand.
Overall volatility has increased, but where the money flows depends on the skewness. The 25-delta skewness of the 1-month and 3-month contracts plummeted during the days of decline, indicating that all the money was being used to buy put options.
Friday saw a slight rebound, but put option premiums remain high, essentially returning to levels seen during the days of sharpest declines. The 25-delta skewness compares the implied volatility of out-of-the-money puts and calls; a negative skewness indicates puts are more expensive than calls, suggesting investors are more willing to buy for protection. On January 28th, the skewness for 1-month and 3-month puts was approximately 8% premium; now it has reached 23% and 19%, respectively.
The entire surface is still tilted towards the put option; despite the rebound, the fear hasn't dissipated.
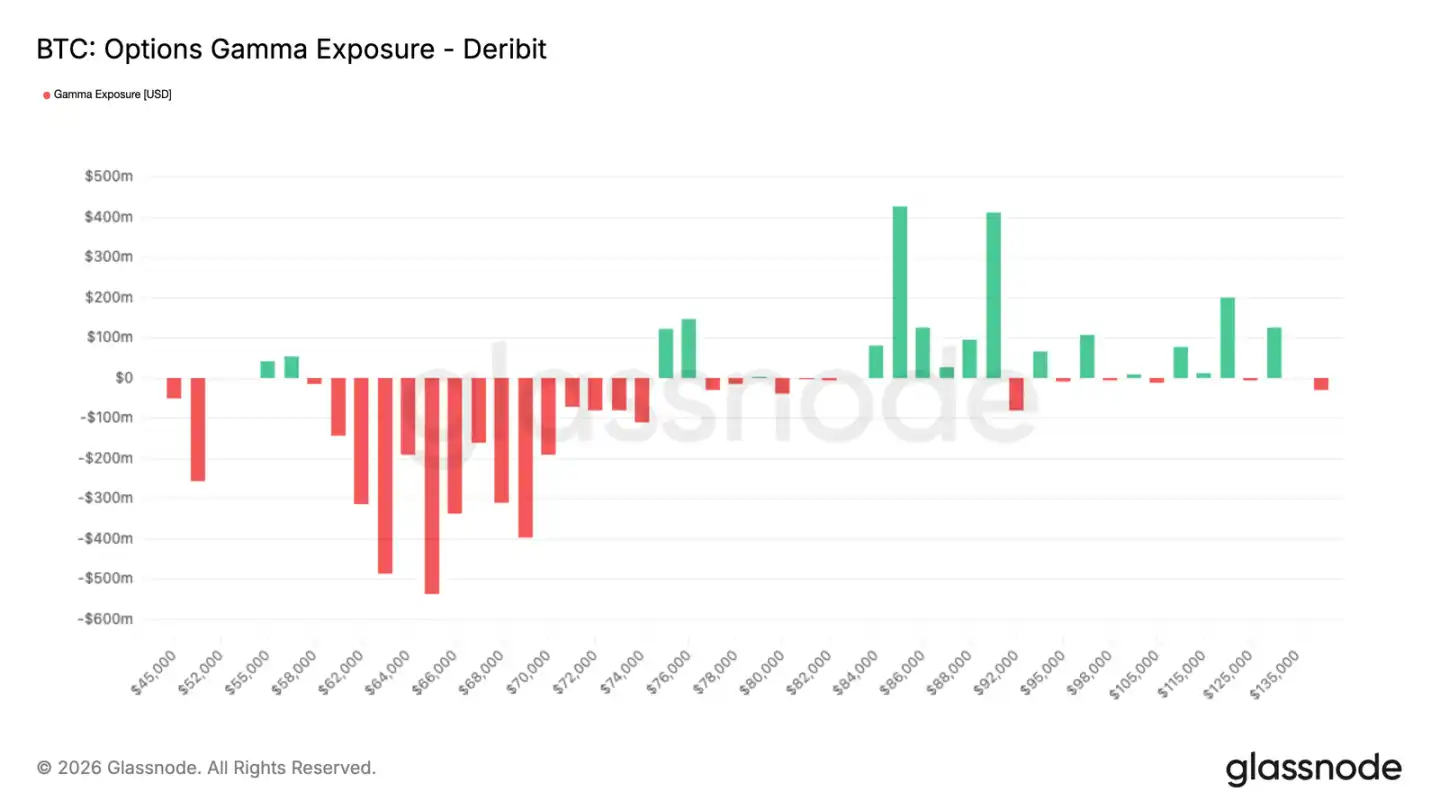
Market maker gamma - price rebound
This defensive options flow leaves a trace on market makers' positions. When market makers are shorting gamma, they will buy when prices rise and sell when prices fall, amplifying volatility rather than smoothing it out.
The previous surge in put buying has left market makers struggling to recover. While the rebound has lasted a few days, it hasn't eliminated this sensitivity. As a result, the market is very fragile; both upward and downward movements can be accelerated by hedging orders, with a greater probability of a downward plunge.
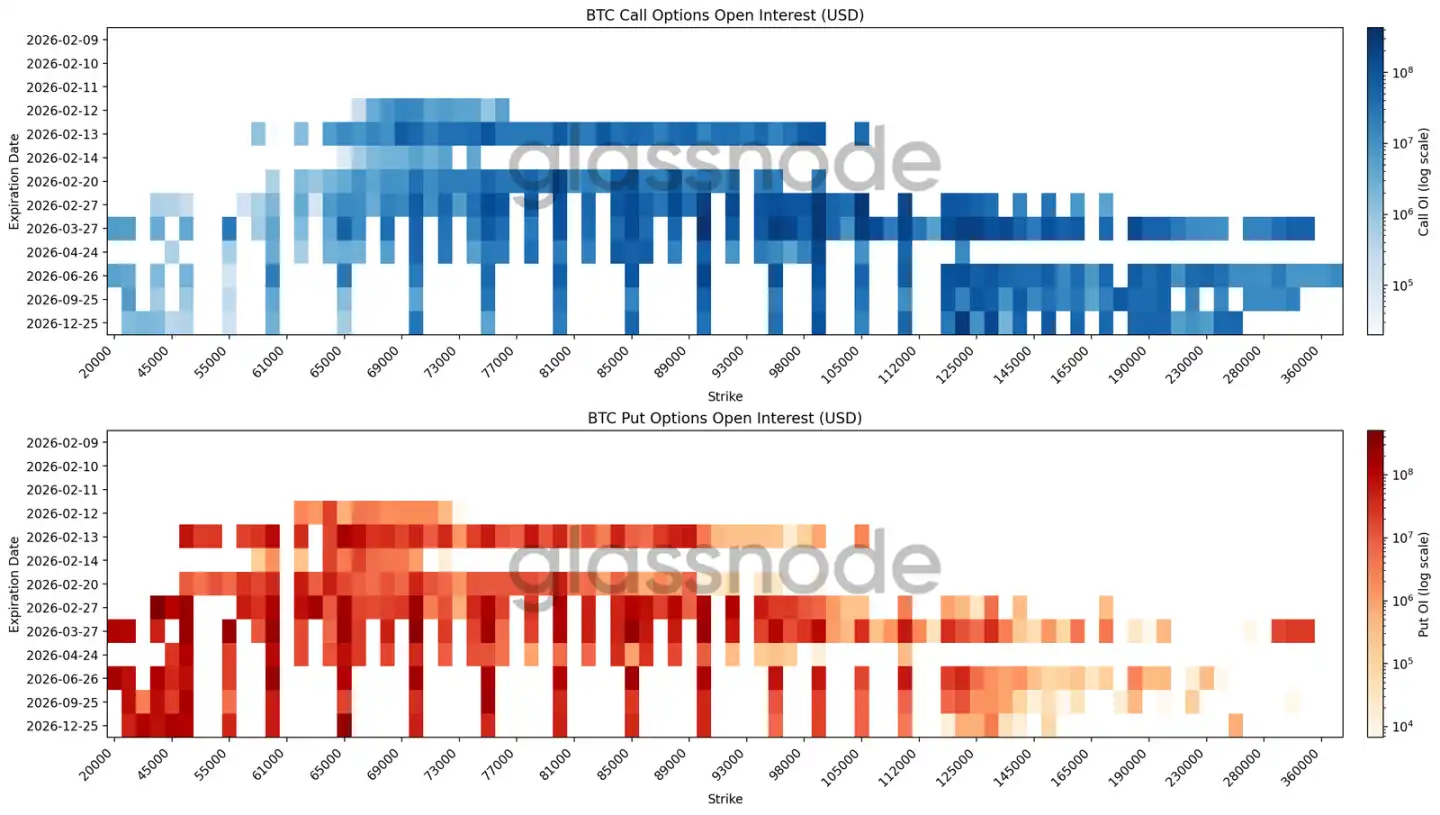
The open interest heatmap shows a wide range of hedging.
The latest heatmap overlays the open interest of BTC options at each strike price and expiration date, making it easy to see where the money is concentrated and where there might be pricing pressure.
For contracts expiring in February, the largest buy orders are between $60,000 and $70,000. Looking further ahead, for year-end and longer contracts, there are ample buy orders between $50,000 and $30,000.
This isn't betting on a specific point in time; it's about multiple periods of downward protection. Furthermore, it's not precisely betting on a single price level, but rather covering an entire range – a typical range hedging strategy. Open interest in calls is concentrated above 120,000, with a focus on the second half of the year. Those with short-term bullish positions are cashing out, while those with long-term bearish positions are holding on as tail risk; this is where the deep negative skew comes from.
The entire position structure is defensive, not a bet on a reversal.
in conclusion
Bitcoin is currently in a defensive position, with the price trapped between several key cost levels, and crucial support and resistance zones being repeatedly tested. The $60,000 to $72,000 range is still seeing selling pressure, but there's heavy overhead selling pressure, short-term holders are losing money, and confidence is weak. In this situation, any rebound is likely to be suppressed; sustained buying is needed to stabilize the price.
Off-chain data also corroborates this cautious assessment. Institutions are withdrawing, and spot transactions are passive, not active accumulation. In derivatives, speculative sentiment has subsided, but hedging is still underway, and the market-making structure makes prices volatile and difficult to directionally.
Overall, the market is in a period of equilibrium under pressure. Liquidity is thin, participation is scattered, and the positioning structure is defensive. For a trend to change, either there needs to be a surge in spot buying or a return of risk appetite. Until then, volatility will be driven by short-term position arbitrage, not a trend.


