

- Bitcoin Cash price held near $500 as bulls battled intraday sell-off pressure.
- The altcoin could retest key resistance levels amid Bitcoin’s gains.
- However, Standard Chartered forecasts $BTC could drop to $50k, and $BCH will likely mirror this.
Bitcoin Cash ($BCH) price is demonstrating notable resilience, with bulls holding near the $500 mark as the broader cryptocurrency market downturn hits sentiment.
On February 12, 2026, the $BCH price hovered between $496 and $523, down nearly 3% in the past 24 hours but still within range of this crucial level.
Bitcoin Cash price holds $500 amid $BTC struggle
The resilience comes as the broader crypto market faces pressure, including from macroeconomic factors.
Sell-off across the sector has seen Bitcoin struggle to reclaim the $70,000 mark, and on Thursday, Standard Chartered analyst Geoff Kendrick highlighted the bank’s forecast for $BTC in 2026.
Specifically, Standard Chartered has now slashed its 2026 target to $100,000 per Bitcoin, citing potential further pain before prices recover.
Amid downward pressure, the bank sees bears pushing $BTC to support around $50,000.
Kendrick said in a note to clients that Ethereum will also likely drop to $1,400 before rebounding to highs of $4,000 in 2026.
While $BCH remains near $500 and has held above the $450 support, this outlook for $BTC and ETH suggests the coin could be at risk of further decline.
Negative sentiment will cascade to other Bitcoin-related tokens.
$BCH price technical outlook and forecast for 2026
Bitcoin Cash price fell to around $468 on October 10, 2025, and to $454 on Feb. 5, 2026.
The two dates highlight the last two major sell-off events across the crypto market. If prices fall past this support base, a retest of June 2025 lows at $385 could follow.
Before this, Bitcoin Cash had rallied from $268 to $443 between April 9 and May 23.
From a technical perspective, $BCH’s weekly chart indicates that the price currently hovers above a key horizontal support level.
The uptick between March and September 2025, and between November 2025 and early January 2026, also put prices above the middle line of a broader parallel channel.
The resistance level of this pattern lies near $700, while support is around $264.
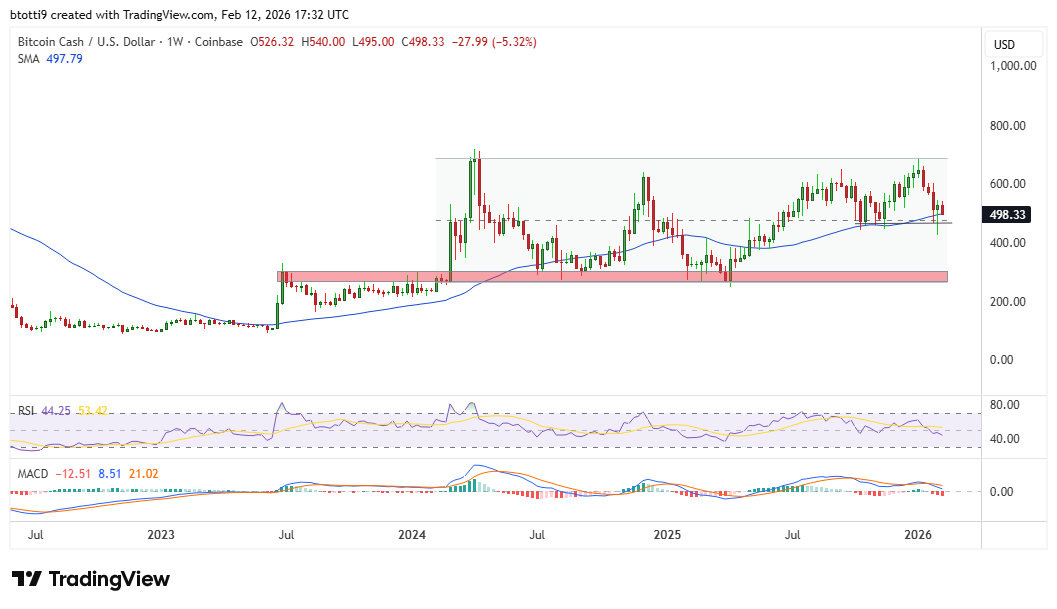 $BCH Price Chart">
Currently, $BCH’s price hovers at the 50-day moving average of $597, which has acted as support since Oct. 10, 2025.
If the price drops below the 50-day SMA, bulls could be in trouble. The weekly RSI sits in the neutral 40-50 zone. However, it is likely to suggest potential bearish acceleration before a rebound.
Meanwhile, the MACD indicator shows strengthening bearish momentum after a bearish crossover in mid-January.
A weekly close above $510 could allow buyers a relief rally towards the channel resistance. However, if prices slip under $425, a revisit of $300-$260 could be next.


