Original author: Glassnode
Original translation by AididiaoJP, Foresight News
Bitcoin has stabilized around $70,000, with improved fund flows and easing selling pressure. However, low spot trading volume, coupled with supply pressure above the market, indicates that stronger demand is still needed to drive a sustained market recovery.
summary
- Bitcoin stabilized after a sharp sell-off that hit around $67,000 and rebounded to around $70,000, but the upward momentum remains hesitant.
- Unrealized losses have increased, but have not yet deviated from the historical normal range, indicating that there is pressure in the market, but it has not yet entered a stage of complete surrender.
- A large supply of short-term holders is concentrated between approximately $93,000 and $97,000, forming a key resistance area above.
- Realized losses remain high, but there are no signs of panic, indicating that the current phase is one of orderly risk reduction rather than panic selling.
- Spot trading volume remained sluggish, and there was no significant increase in volume during the price rebound, reflecting a lack of market confidence and only selective buy the dips behavior.
- After a period of continuous net outflows, U.S. spot exchange-traded funds (ETFs) saw a slight net inflow, indicating that institutional funds may be starting to re-enter the market.
- The funding rate for perpetual contracts remains in negative territory, reflecting continued bearish sentiment in the market and cautious positioning in derivatives.
- The relatively low level of open interest in futures contracts indicates that the leverage expansion supporting this rebound is relatively limited.
- In the options market, skewness indicators have stabilized, and implied volatility has fluctuated within a range, indicating a decrease in the demand for hedging downside risk.
- Market makers' Gamma positions turned slightly positive, indicating improved liquidity and a more balanced market structure.
On-chain insights
Higher and lower points, heavy overhead pressure
Despite ongoing geopolitical tensions and uncertainty in stock, energy, and commodity markets, Bitcoin has consistently hit higher highs and lower lows since early March, building a somewhat constructive structure within the $60,000 to $70,000 range.
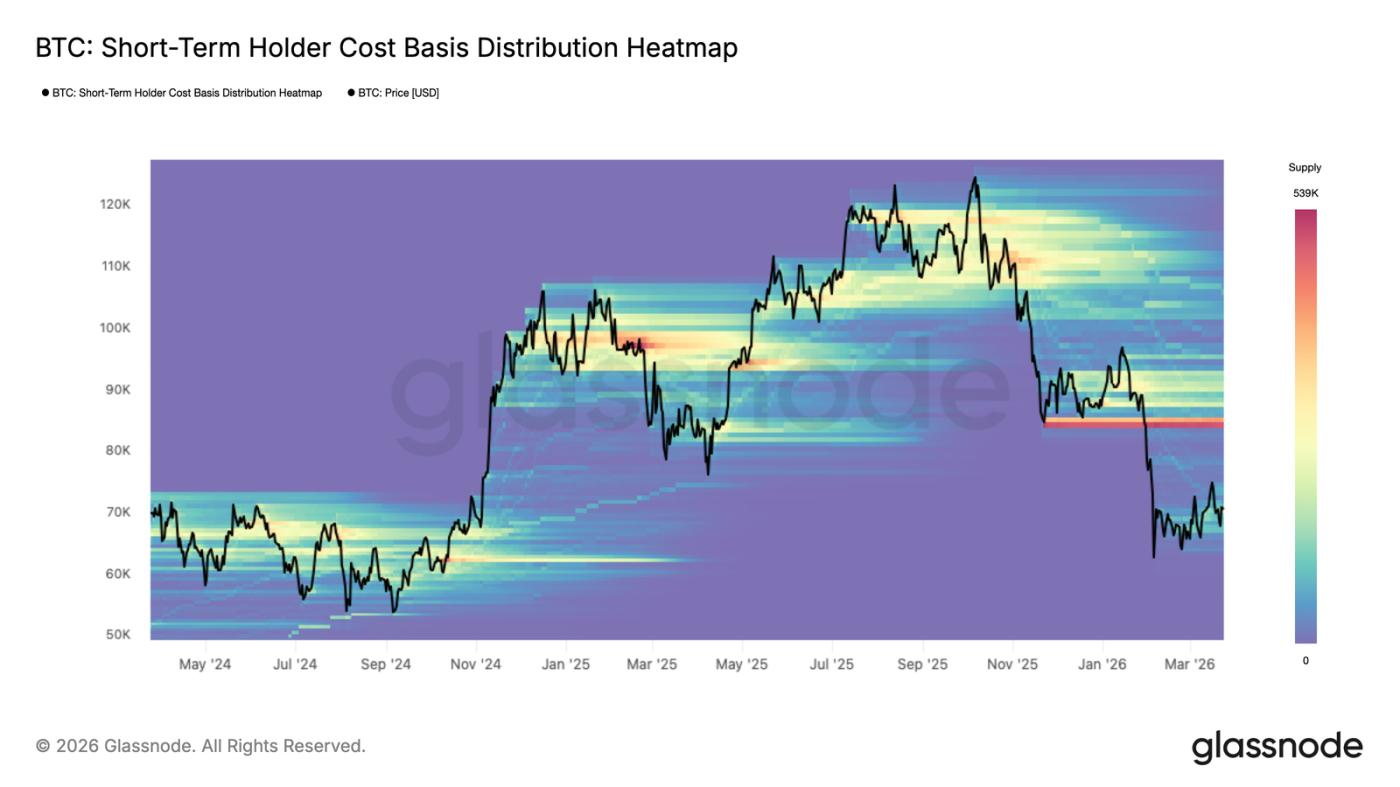
If the current resilience can be maintained, the market is expected to lay a relatively solid foundation for a long-term upward trend. The heatmap of short-term holders' cost base distribution shows areas of concentrated supply in recent periods, helping to identify potential supply and demand locations from the perspective of new entrants.
Within the current price range, a new accumulation zone is gradually forming, small in scale but sufficient to explain some of the recent upward momentum. However, in the medium term, a more prominent risk lies in the large supply of short-term holders above $84,000. Whether prices subsequently rise back to this area or face renewed market pressure, this group could amplify selling pressure.
medium-term range
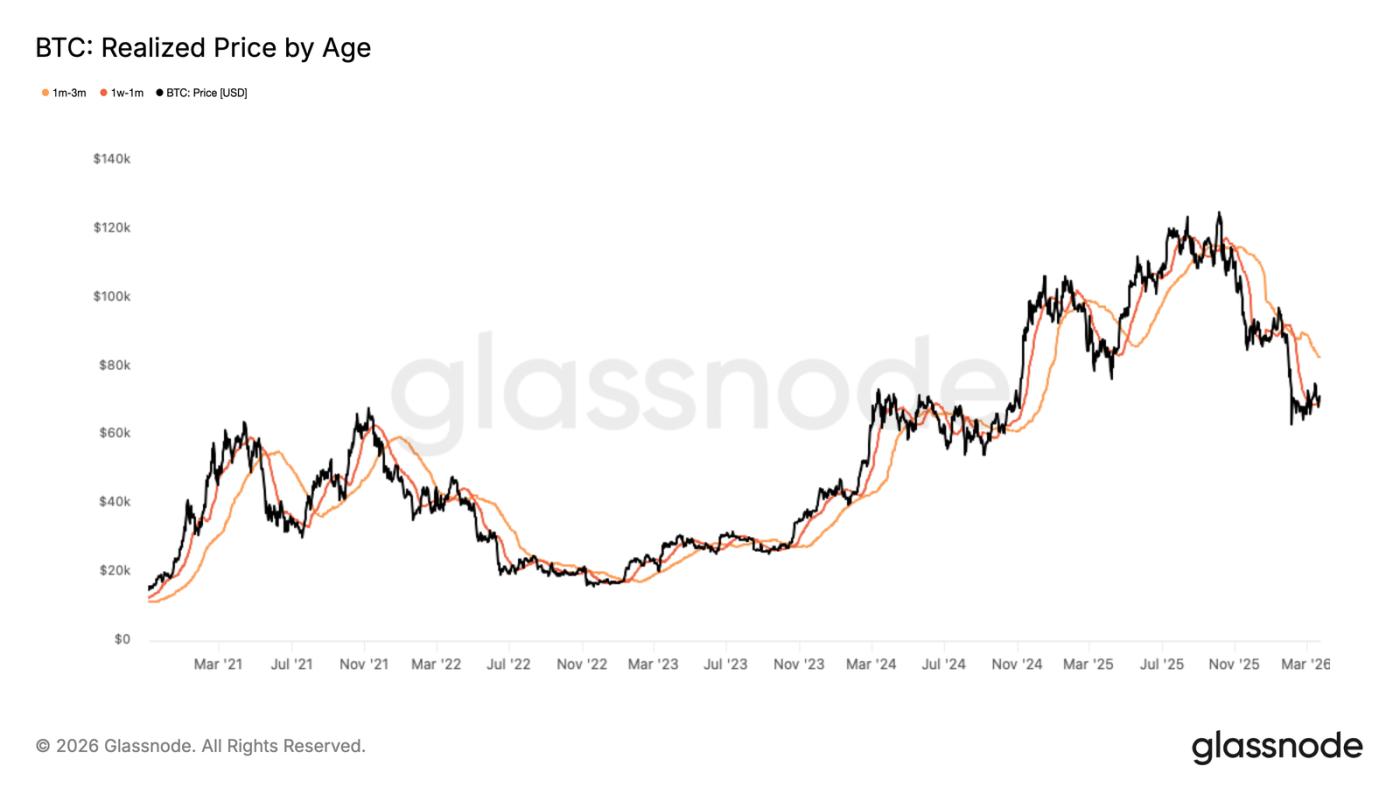
Building upon the aforementioned supply dynamics, the realized price breakdown by holding period provides a more granular perspective, revealing the distribution of cost bases among different investor groups. This indicator tracks the average purchase price of tokens with different holding periods, helping to define near-term support and resistance levels from an investor behavior perspective.
Currently, the group holding for 1 week to 1 month has a cost base of approximately $70,200, forming an emerging support level; the group holding for 1 month to 3 months has a cost base of approximately $82,200, further reinforcing the aforementioned upward resistance.
In summary, the two price levels mentioned above together define the most likely range for price movement in the medium term. However, given the still limited size of the current accumulation zone, the strength of the $70,200 support level remains to be tested. Until a more solid buying base is established, the possibility of prices falling below this level should be closely monitored.
Fear intensifies, but surrender has not yet been made.
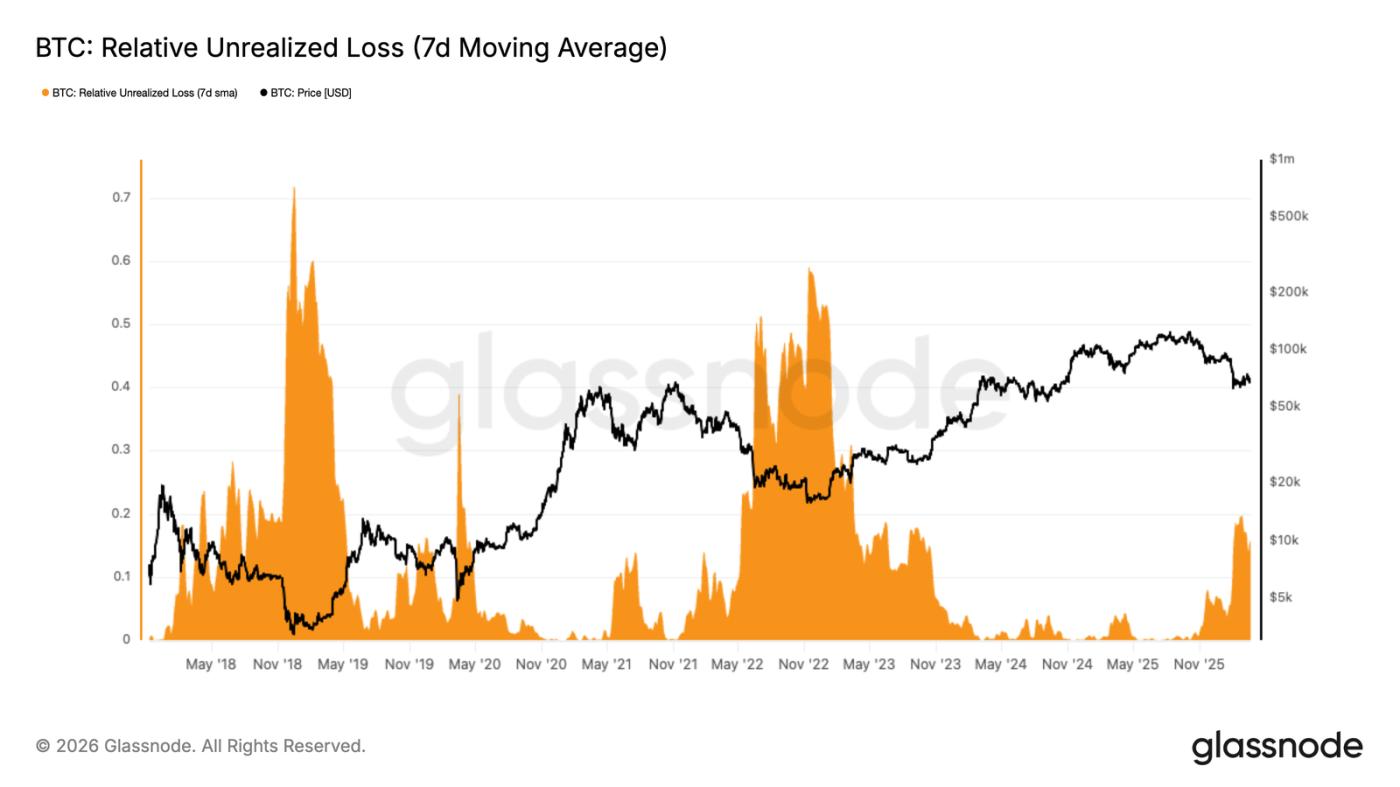
Expanding outwards from the aforementioned refined cost-based indicators, profit and loss indicators offer a more macro-level cyclical perspective by exploring the balance between greed and fear in the market. Relative unrealized losses, which measure the total value of unrealized losses held by all investors relative to market capitalization, are an important indicator for assessing potential selling pressure and market sentiment.
Over the past two months, this indicator has remained consistently above 15% of market capitalization, with a structure similar to that of the second quarter of 2022. This suggests that current market sentiment is highly fearful, but far from the level of complete capitulation seen during extreme stress events like the FTX crash. Historically, mitigating the current level of unrealized losses typically requires time, further price adjustments, or both. While a rapid V-shaped reversal is theoretically possible, given the scale of the current unrealized losses, this would require a sustained and strong influx of new funds in the short term.
Depletion of profit liquidity
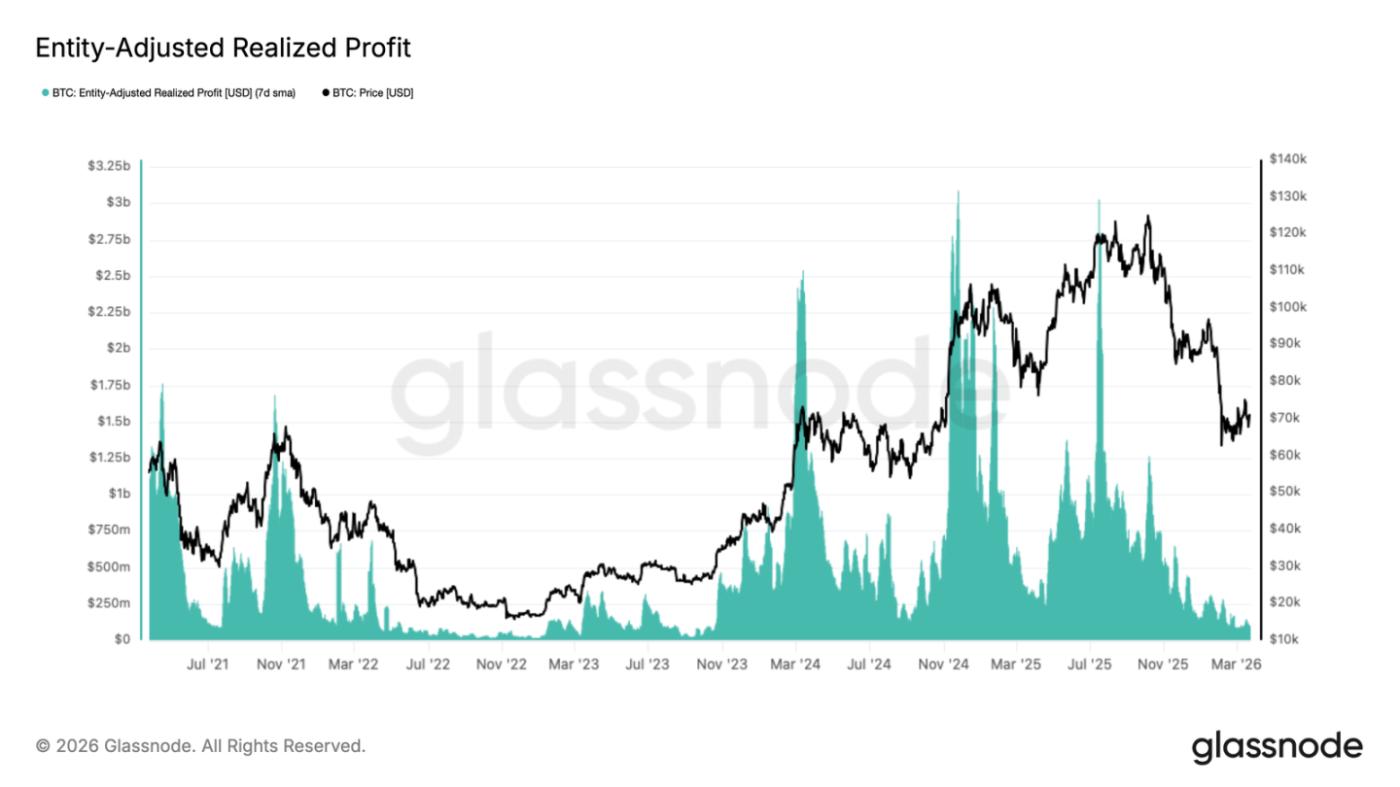
Against the backdrop of heightened fears of unfulfilled expectations, realized profitability has contracted significantly since the fourth quarter of 2025, further confirming the weak demand situation.
Realized profits adjusted for entities (smoothed using a 7-day simple moving average) exclude internal exchange transfers, thus more accurately reflecting actual profit-taking activity within the network. This metric has fallen from a daily peak of approximately $3 billion in July 2025 to less than $100 million currently, a drop of over 96%. Such a significant contraction is typical of the later stages of a bear market, where sellers holding profitable positions have largely exited the market, and on-chain liquidity has fallen to cyclical lows. While this environment reduces short-term selling pressure, it also reflects a lack of new capital inflows needed to support a sustained market recovery.
Off-chain insights
Spot trading volume remains sluggish
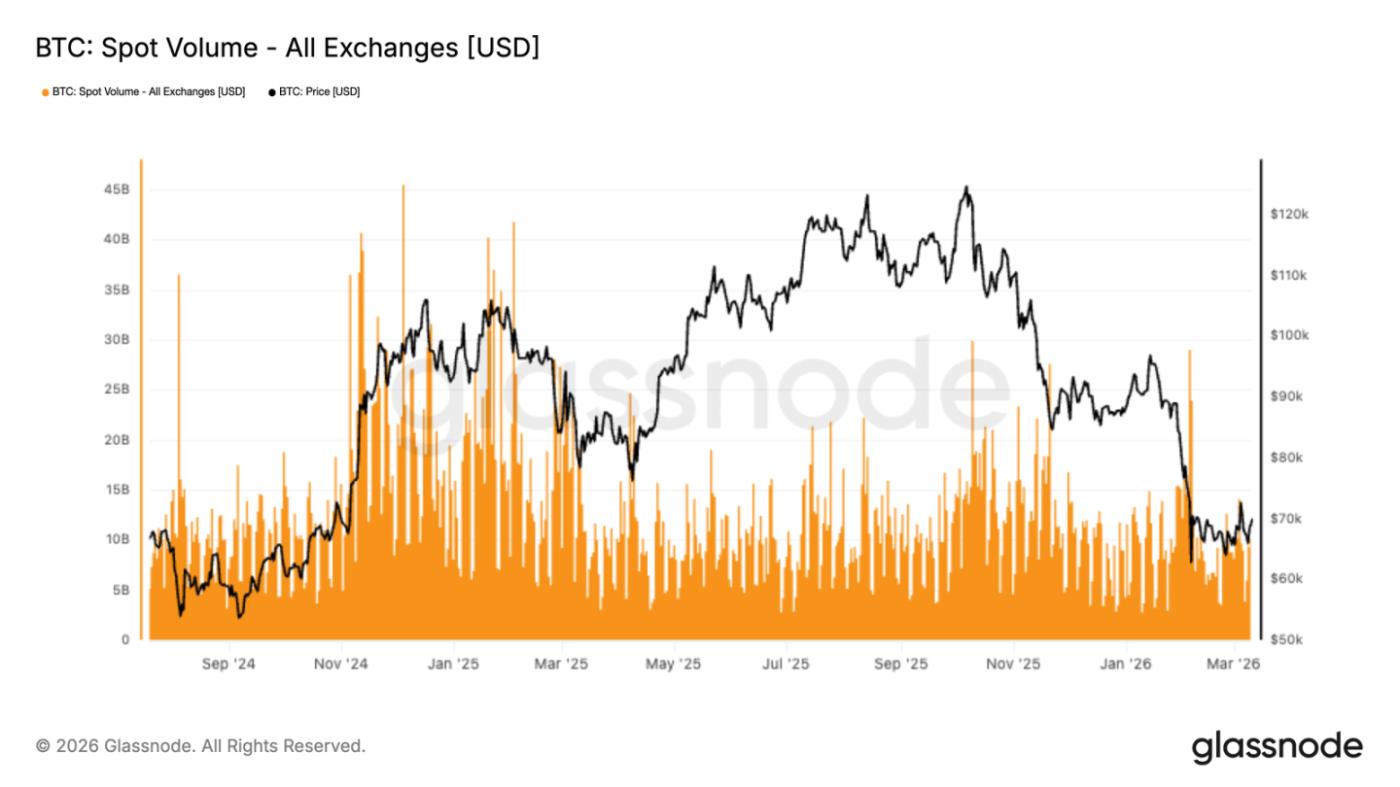
After prices plummeted to the $67,000 area, spot market activity remained generally subdued. During the subsequent rebound, trading volume on major exchanges only showed a modest response. While there were brief periods of increased volume, these were largely passive reactions rather than signals of a sustained return of confident buying.
Compared to the more active participation during the earlier upward phase, current spot trading volume remains weak. This indicates that the recent price rebound to around $70,000 relies more on bargain hunting and short-term position adjustments, and has not yet generated substantial support from spot demand.
The divergence between stabilizing prices and low spot market participation suggests that the market is still in a rebalancing process. The upward trend may be fragile until spot trading activity expands more sustainably, and price movements may be more sensitive to changes in derivatives fund flows and liquidity conditions than to organic accumulation.
Exchange fund flows rebound
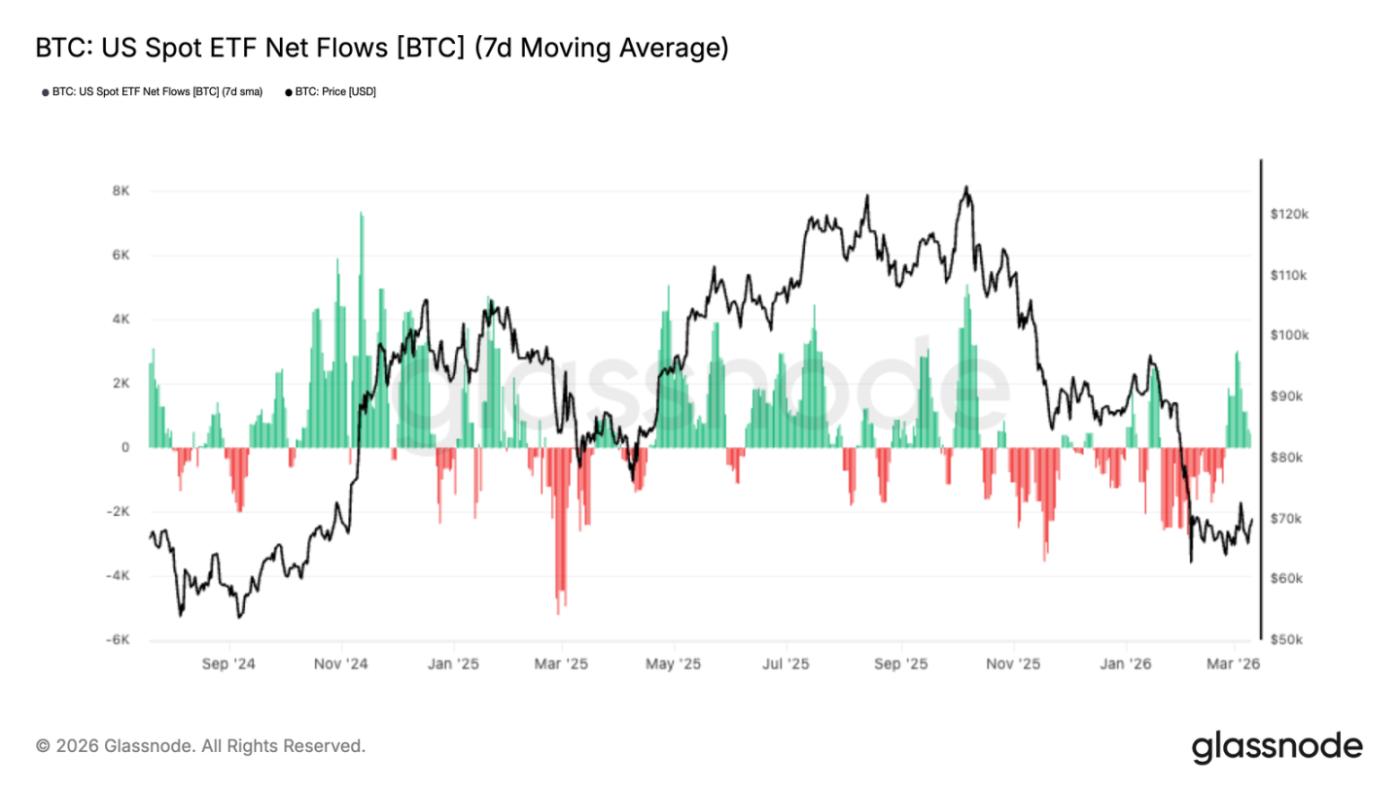
After a prolonged period of net outflows, U.S. spot exchange-traded funds (ETFs) have recently shown initial signs of improvement, with the 7-day moving average turning slightly positive in recent trading days. This suggests that institutional demand may be slowly returning as Bitcoin gradually stabilizes and recovers after falling to the $67,000 area.
Although the absolute scale of current capital inflows remains limited compared to previous accumulation phases, the shift in direction is noteworthy. Previous outflows were accompanied by weak price movements and subdued market sentiment, while the recent rebound in capital inflows suggests that traditional market participants are tentatively re-entering the market.
This shift is significant because demand for exchange-traded funds (ETFs) has become a major support for the spot market in this cycle. If fund flows can continue to remain net inflows, it will help confirm that institutional investor confidence is recovering and they are beginning to increase their exposure again.
Overall, the current recovery is still in its early and mild stages, but compared to the continuous outflows of the past few weeks, the shift in fund flows indicates a certain degree of positive change in the market structure.
Negative funding rates continue
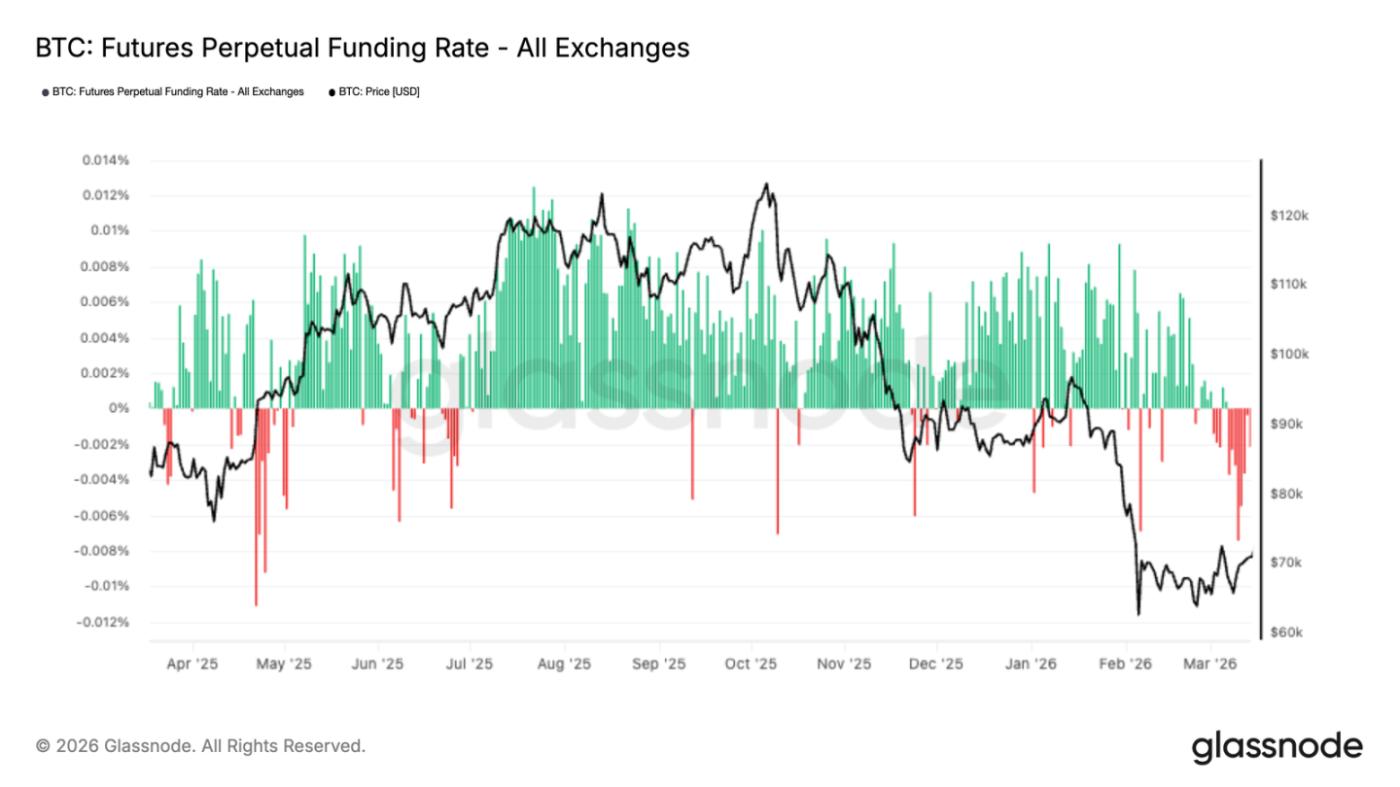
Despite Bitcoin's price gradually stabilizing and attempting to recover from the recent pullback, perpetual contract funding rates remain in negative territory. This indicates that short positions still dominate, and traders are still willing to pay funding costs to maintain exposure to the downside.
The continued negative funding rates reflect a generally cautious sentiment among derivatives market participants. Even with some improvement in price structure, traders have not shown a strong willingness to rebuild long positions. This contrasts with past recovery phases where funding rates typically return to normal or even turn positive as sentiment improves.
From a position structure perspective, persistently negative funding rates could potentially be a driver of price increases, as they reflect relatively crowded short positions. If the upward momentum continues, the market may face a short squeeze risk. However, on the other hand, this also indicates that market confidence in the current recovery remains limited, especially among leveraged traders.
The current landscape indicates that the positioning in the derivatives market remains defensive. Although there are signs of stabilization in spot and exchange-traded fund flows, the overall risk appetite still leans towards a short position.
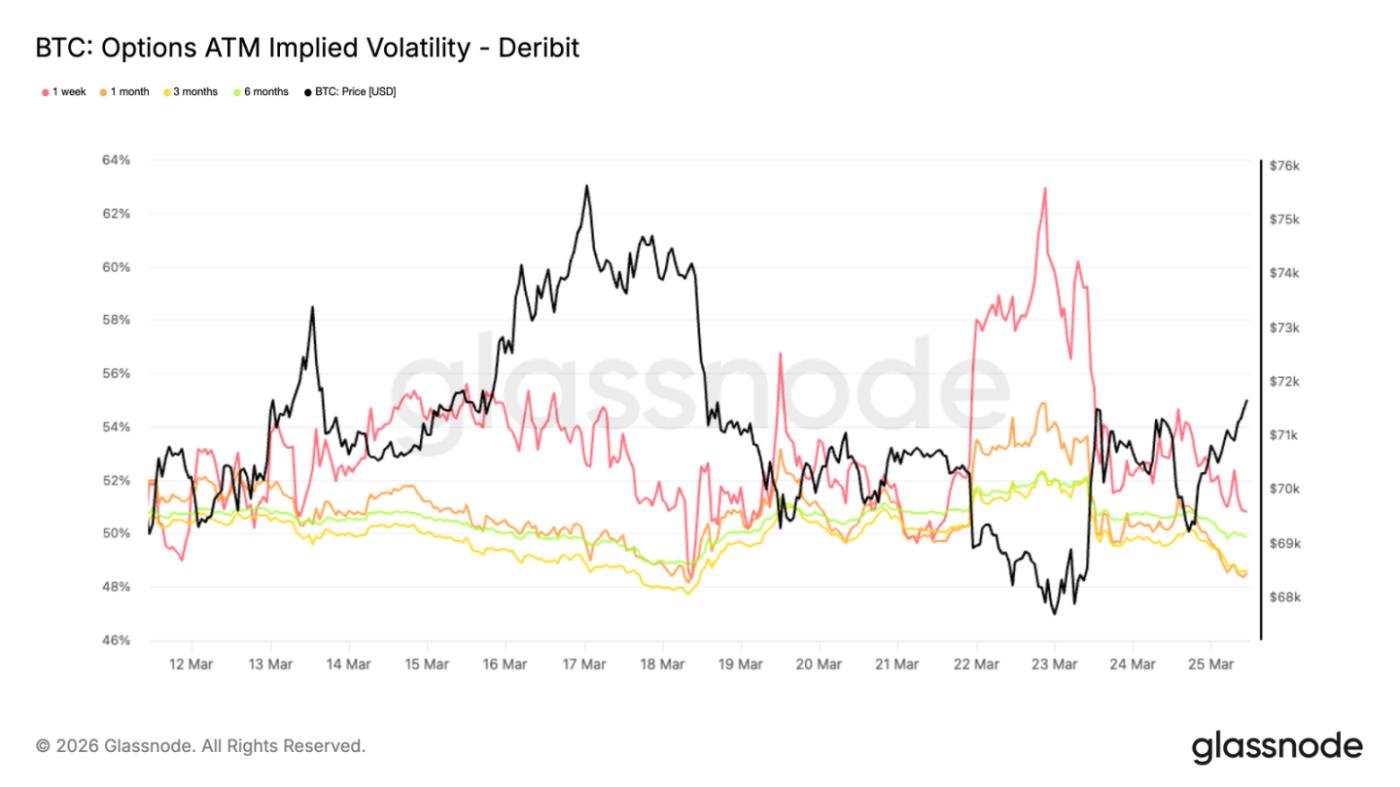
At-the-money implied volatility: range-bound trading, awaiting direction.
In the options market, Bitcoin's at-the-money implied volatility exhibits characteristics similar to the spot market, generally maintaining range-bound trading with a mean-reverting tendency. The front end of the volatility curve is most sensitive to macroeconomic events and short-term news changes. One-month contracts show relatively larger fluctuations, but the overall trading range remains confined to a narrow range of 50% to 60%. Implied volatility at the far end of the curve consistently remains below 50%, with limited differences between contracts of different maturities.
Implied volatility remained low overall, reflecting that the market is awaiting new catalysts to reprice two-way risks. The subdued implied volatility of long-term contracts indicates that there has been no structural change in the market's pricing of long-term risks, with short-term volatility primarily driven by trading activity in near-month contracts. In this environment, volatility tools are used more to address short-term uncertainties than to express long-term directional views.
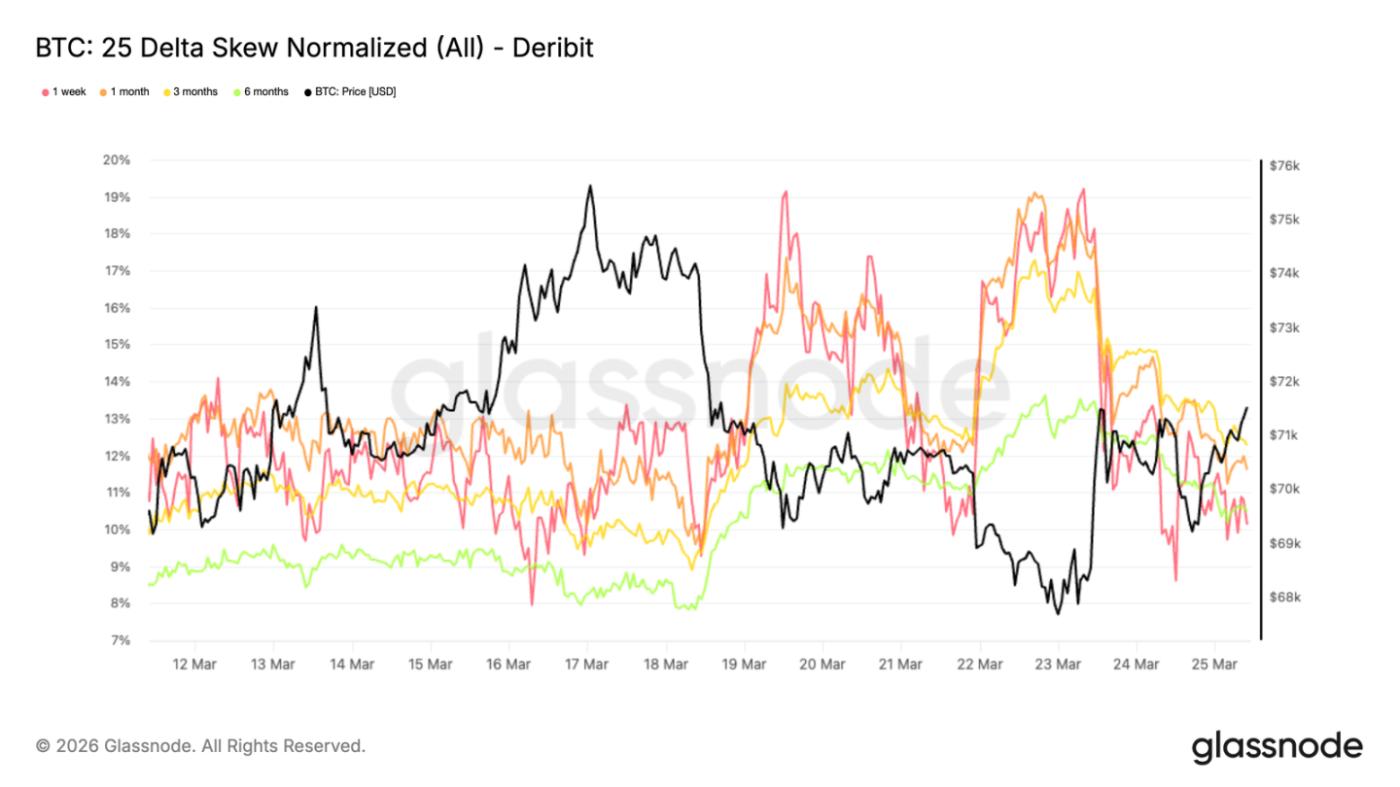
25 Delta skew: Downside protection still dominates
During the brief rise in volatility this week, the skewness indicator widened towards put options, confirming that this round of volatility revaluation was mainly driven by downside protection demand.
The delta skew (a metric measuring the relative cost of put and call options with the same delta value) climbed to the 18% to 19% range for 1-week and 1-month contracts earlier this week when Bitcoin's price fell below $68,000. This clearly indicates that amid heightened geopolitical uncertainty, demand for short-term downside protection quickly intensifies once prices show signs of weakness.
The skewness indicator subsequently declined somewhat, but remained at a relatively high level overall, with skewness levels across different maturities being quite similar, concentrated between 10% and 12%. This convergence of skewness values across different maturities indicates that the market's preference for downside protection is not limited to near-month contracts, but reflects a widespread and sustained risk-averse hedging tendency among market participants.
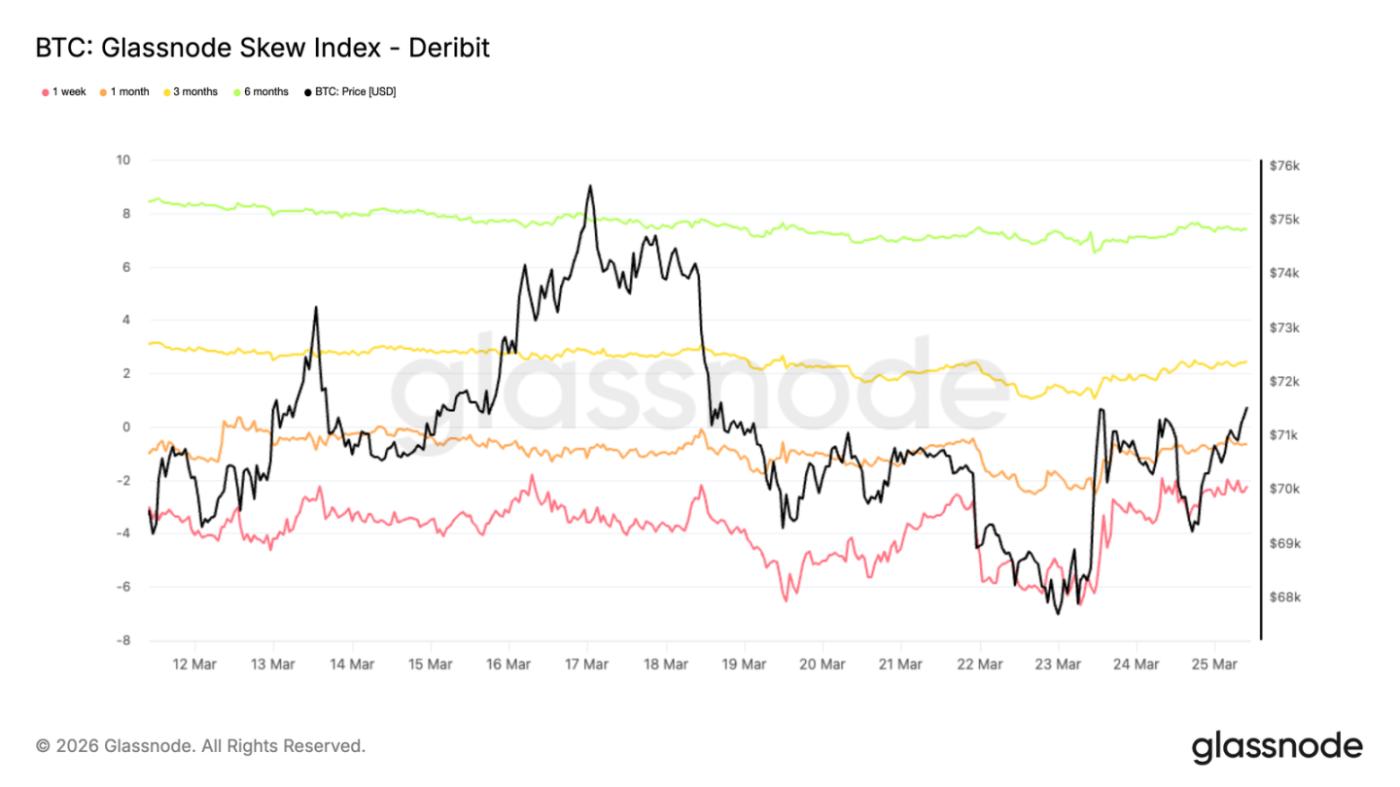
Skewness index indicates different tones
The skewness index provides another perspective on the options market. Unlike the 25-delta skewness, this index assigns higher weight to low-delta options in its calculation, providing a more comprehensive reflection of pricing at the tails of the distribution. Currently, the skewness index readings for 1-week and 1-month maturities remain in the bearish zone, while the readings for 3-month and 6-month maturities (approximately 2.4% and 7.4%, respectively) have shifted into the bullish zone (the index is calculated by subtracting put options from call options).
This has resulted in a relatively clear divergence. The 25-delta skew indicates a bearish bias across all maturities, while the longer-term portion of the skew index shows that, at the far end of the curve, the pricing of upside tail risk is higher than that of downside tail risk. This means that although there is still buying support for low-to-medium delta put options, the market has not accumulated a large amount of deep out-of-the-money downside protection over longer maturities. Overall, option market pricing reflects short-term caution, but the long-term structure tends to be balanced or even slightly positive. This characteristic is quite common in the crypto asset market, where participants tend to use deep out-of-the-money call options to capture asymmetric upside potential.
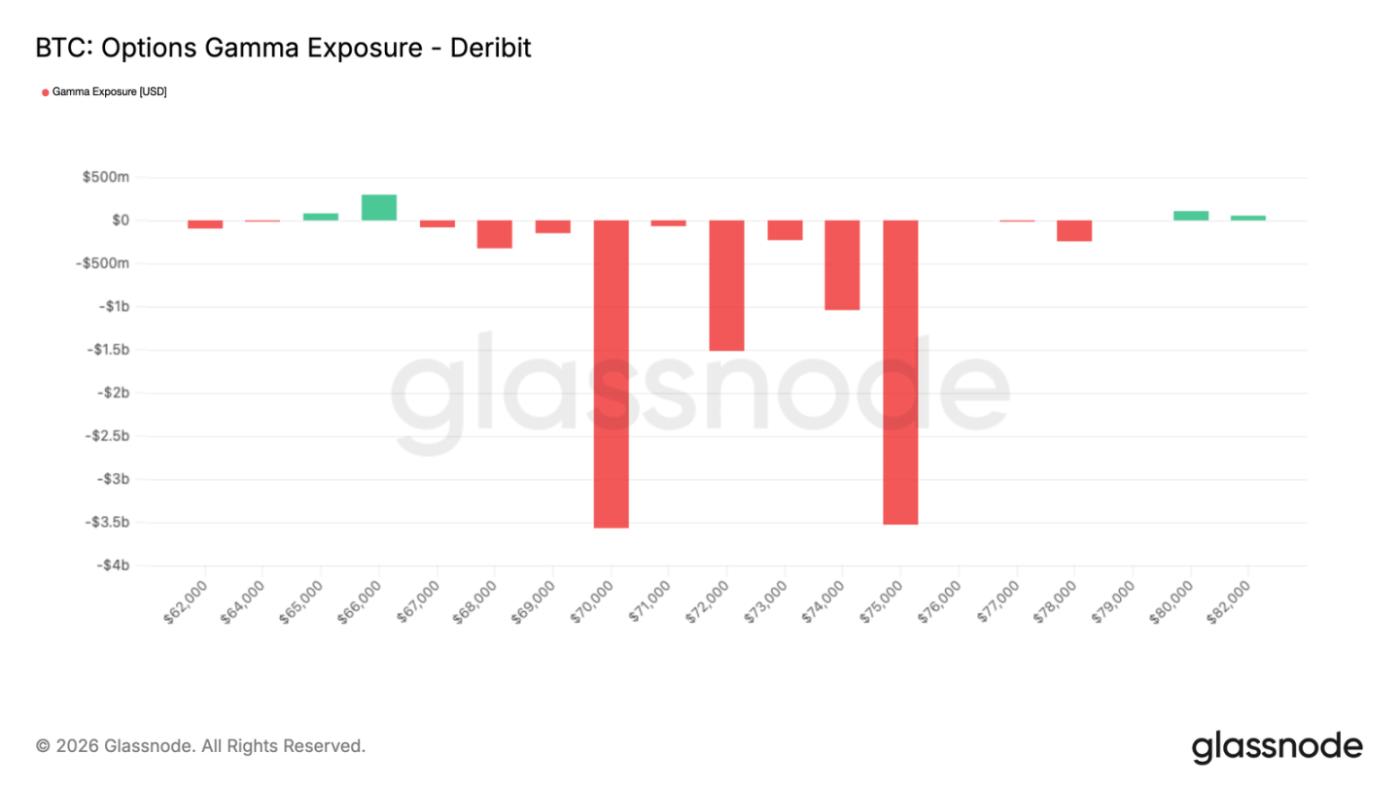
Market maker Gamma: Expiry date will reset market structure
Friday, March 27th, is the common expiration date for weekly, monthly, and quarterly option contracts. Such concentrated expirations typically have a significant impact on Bitcoin price movements. As the options market continues to expand, market makers' hedging activities are having an increasingly significant short-term price influence. With less than 48 hours until expiration, market makers are generally in a short-gamma position, with risk exposure concentrated in the $70,000 to $75,000 range. Within this range, especially in a relatively illiquid environment, prices may experience accelerated two-way price fluctuations.
It's worth noting that the size of the expiring positions is substantial. Approximately $10 billion in market-making short-term Gamma positions are about to be settled, meaning a significant mechanical price driver is about to be removed. Once these positions are settled, the market price will be less constrained by hedging flows, and its responsiveness to external factors is expected to become more sensitive. Against this backdrop, changes in the macroeconomic environment may become a key factor influencing Bitcoin's search for its next equilibrium position.
in conclusion
After a relatively sharp correction, the Bitcoin market is beginning to show some positive signs: prices are gradually stabilizing, exchange-traded fund flows are improving, and the positioning structure in the derivatives market is no longer showing a one-sided characteristic. The pressure accumulated during the recent sell-off seems to be easing, and market conditions are more balanced than a week ago.
However, the current environment is insufficient to support a breakout with high confidence. Spot trading volume remains low, open interest has not expanded significantly, and there is still relatively concentrated supply pressure in the market. Overall, the market structure is recovering, but stronger market participation is needed to confirm a more sustainable upward trend.
Currently, the market structure exhibits constructive characteristics but has not yet transitioned to a clearly bullish state. If demand continues to recover, opportunities will gradually emerge. However, definitively confirming the substantial momentum of this recovery still hinges on a significant increase in spot trading volume and a sustained inflow of new funds.