This article is machine translated
Show original
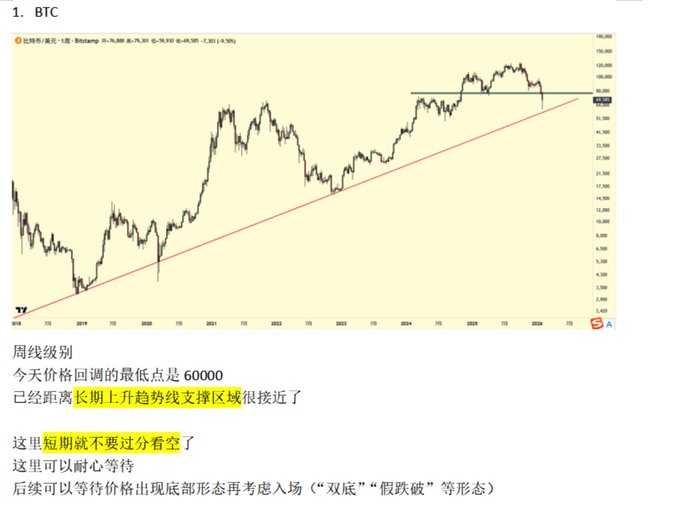
2. Regarding the signal that the bearish outlook has stopped at the 60,000 bottom area in February:
This is primarily based on a resonance across two dimensions. First, from a price chart perspective, the area around 60,000 is precisely the support zone of BTC's long-term upward trend line. Second, from a momentum indicator perspective, the weekly overbought/oversold indicators had already reached the extremely oversold zone. Looking back at the historical price movements of 2015, 2018, and 2022, each time the weekly chart touched this oversold zone, it generally corresponded to the absolute bottom of a bear market. Therefore, with the price approaching the long-term trend line and the indicators showing extreme oversold conditions, the system suggested that one should no longer be overly bearish, but rather patiently wait for confirmation of a bottom formation (such as a Double Botto or a false break).
Sector:
From Twitter
Disclaimer: The content above is only the author's opinion which does not represent any position of Followin, and is not intended as, and shall not be understood or construed as, investment advice from Followin.
Like
Add to Favorites
Comments
Share
Relevant content