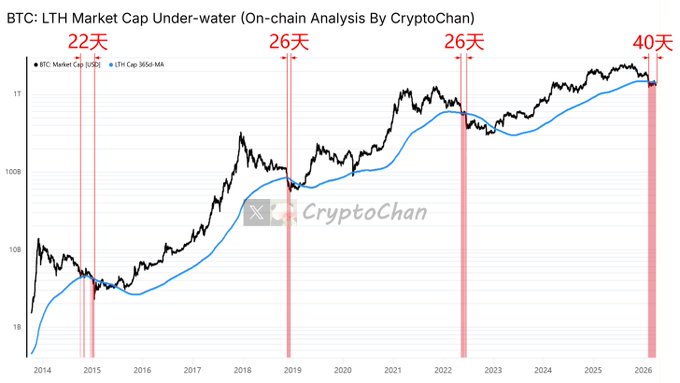
【Four-Year Cycle Series (29)】 2014 #BTC accumulated 22 days underwater to the bear market bottom 2018 #BTC accumulated 26 days underwater to the bear market bottom 2022 #BTC accumulated 26 days underwater to the secondary bear market bottom ($17.6k) This round has so far seen #BTC accumulated 40 days underwater ┌── 📑 𝗗𝗲𝗲𝗽 𝗗𝗶𝘃𝗲 | Indicator Details ──┐ The black line in the chart represents the market capitalization of Bitcoin; the blue line represents the market capitalization of Bitcoin long-term holders' holdings (365d-MA). A black line below the blue line is defined as BTC being underwater.
This article is machine translated
Show original

CryptoChan
@0xCryptoChan
04-01
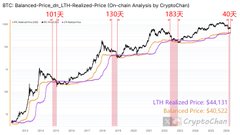
【四年周期总刻系列(28)】
2014年橙线死叉紫线后 101天 到熊底
2018年橙线死叉紫线后 130天 到熊底
2022年橙线死叉紫线后 183天 到熊底
2026年橙线死叉紫线已过去 40天
┌── 📑 𝗗𝗲𝗲𝗽 𝗗𝗶𝘃𝗲 | 指标详情 ──┐
图中黑线为 #BTC 价格;橙线为比特币均衡价格 (Balanced x.com/0xCryptoChan/s…
Sector:
From Twitter
Disclaimer: The content above is only the author's opinion which does not represent any position of Followin, and is not intended as, and shall not be understood or construed as, investment advice from Followin.
Like
Add to Favorites
Comments
Share
Relevant content