Three altcoins are showing important technical signals as they enter the third week of April 2026. RaveDAO (RAVE), Polkadot (DOT), and Official Trump (TRUMP) are all at key price levels that could determine their short-term direction.
RAVE continues its parabolic surge with a 185% increase in just one day. Meanwhile, DOT is struggling after a bridge attack that sent the Token plummeting to near its all-time Dip . TRUMP is retesting double Dip support ahead of a major event for holder.
RAVE: Fibonacci levels signal a $9.00 target.
RaveDAO is one of the fastest-rising Token in the crypto market this month. Currently trading at $7.47, it has increased by 185% in just the last 24 hours. This surge is part of a parabolic bull cycle, with a total increase of over 3,500% from its most recent Dip .
RAVE's bullish structure shows a trend following Fibonacci levels, rather than a random increase. Fibonacci extensions have acted as stepping stones leading the price. The 2.272 Fibonacci level at $5.45 acted as support in the most recent trading day.
The next major target is the 2.618 Fibonacci level around $8.99, very close to the strong psychological zone of $9.00. Compared to the current price of $7.47, RAVE needs to increase by approximately another 18% to reach this level.
The breakout candlesticks were accompanied by a surge in volume . Currently, the daily candlestick chart shows no signs of weakness or upper wicks; the candlestick bodies remain solid and are closing near the session's high.
Want more Token insights like this? Sign up for Editor Harsh Notariya's daily Crypto Newsletter here .
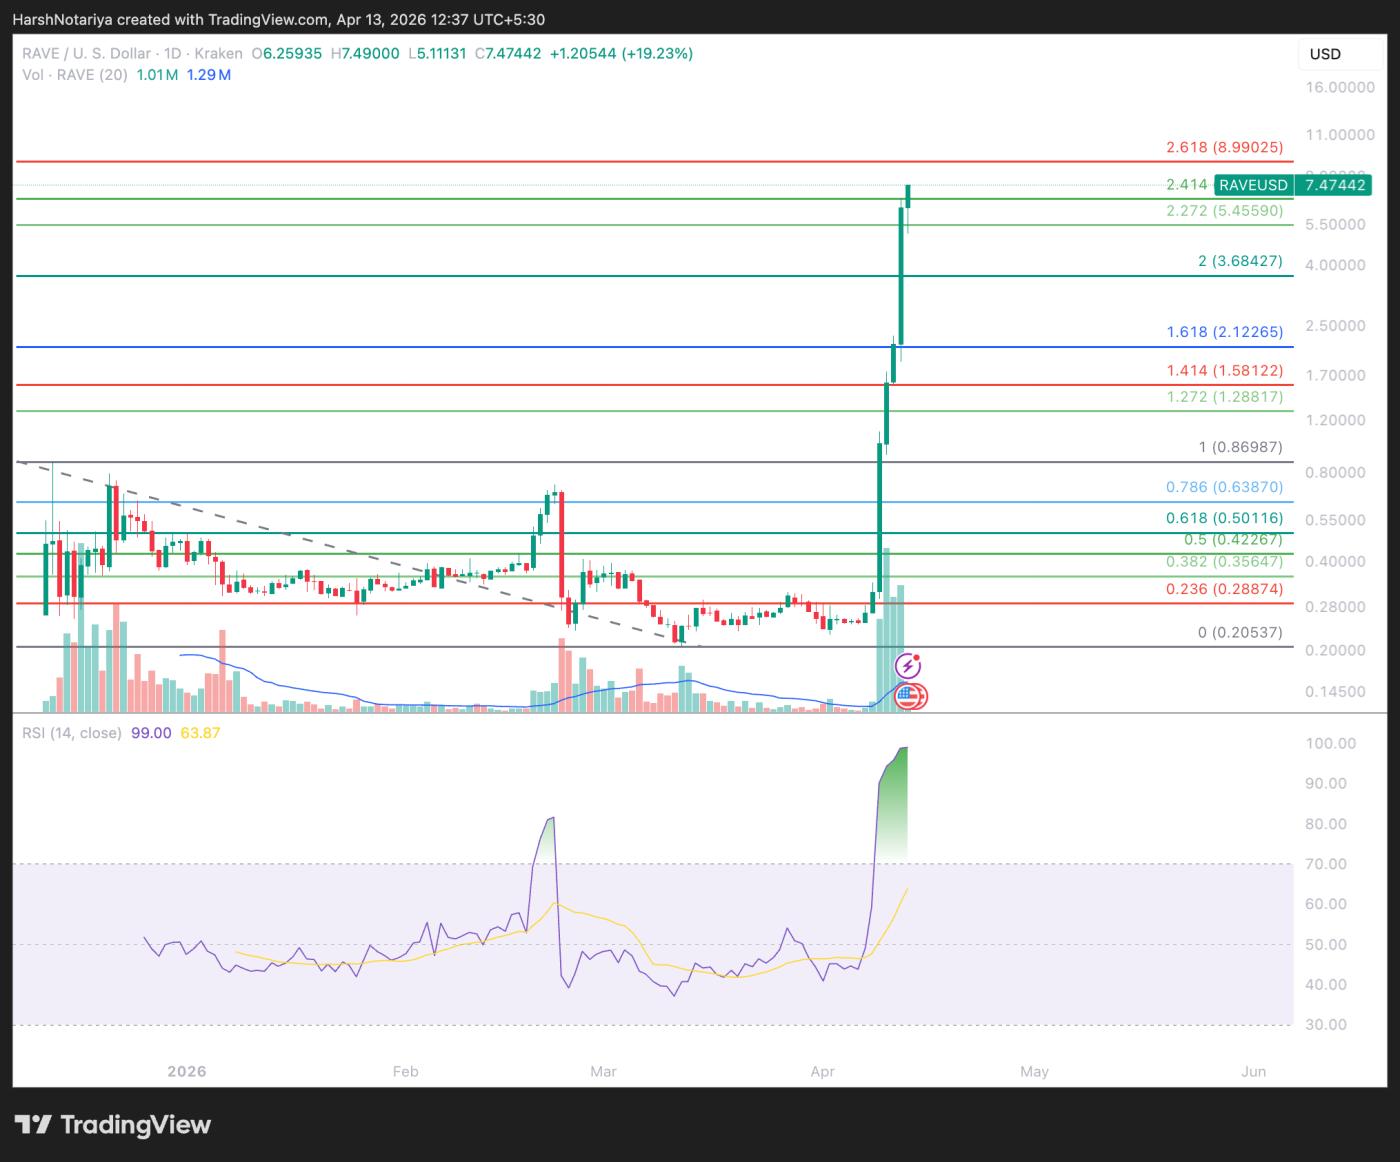 RAVE price analysis. Source: TradingView
However, concerns about manipulation also emerged alongside the price surge. Reports indicate that some wallets deposited 18.58 million RAVE Token onto the Bitget exchange approximately 10 hours before the price began its sharp increase. The low circulating supply (around 239 million out of a maximum of 1 billion) further facilitated concentrated buying sprees that could easily drive the price up.
Conversely, if the daily candle closes below $5.45, the parabolic trend will be broken. If RAVE breaks below $3.68, the bullish scenario will be completely invalidated, and a further decline to the $2.12 region is likely.
The possibility of a correction is quite high, as the RSI indicator is currently still at an overheated level, reaching 99.
DOT plummets to near historical Dip after bridge failure.
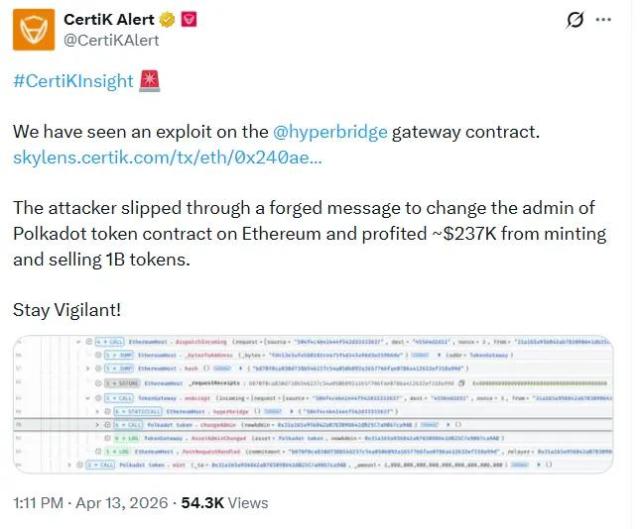
Polkadot is currently trading at $1.18, down 8% from Sunday's peak. The main reason is the Hyperbridge gateway attack , which allowed hackers to issue 1 billion DOT bridge Token on Ethereum.
The attackers used forged chain messages to alter the governance of the DOT Token contract on Ethereum. They then issued the entire amount of Token and Dump them in a single transaction. The incident resulted in the hackers stealing 108.2 ETH , equivalent to approximately $237,000.
However, due to the liquidation of the bridged DOT on Ethereum, the actual profit the attacker could gain was limited. Most importantly, this incident did not affect Polkadot 's original Relay Chain or the DOT Token on the mainnet, but only impacted the DOT Token wrapped on Ethereum.
However, two major South Korean exchanges, Upbit and Bithumb , have temporarily suspended DOT deposits and withdrawals as a precautionary measure, further increasing selling pressure on the Token when its price is already weak.
DOT is currently very close to its historical low of $1.10. If it fails to regain the $1.22 level, the risk of further declines remains. Positive actions related to troubleshooting or network security improvements could help restore confidence among retail investors.
If DOT can maintain above $1.22, the next target will be the $1.33 resistance level.
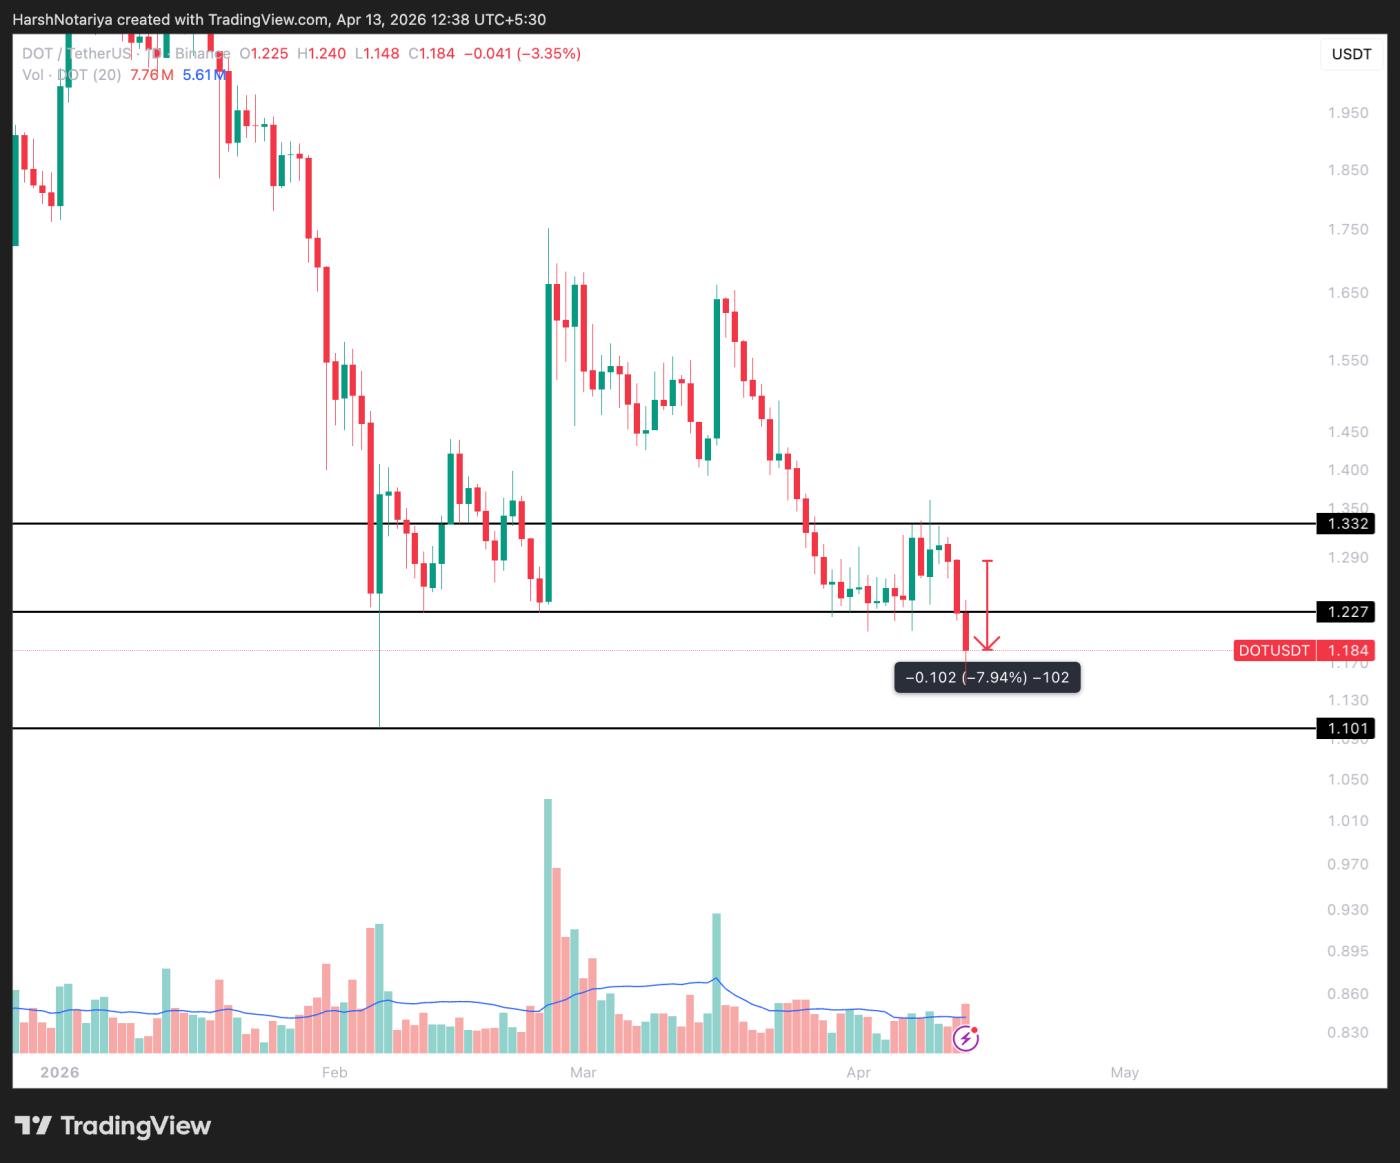 DOT price analysis. Source: TradingView
If the price fails to hold around the current level, the DOT could easily fall back to $1.10, or even lower.
Trump's price retested the double Dip pattern at $2.78.
Official Trump is currently trading at $2.81, virtually unchanged for the past 24 hours. The Token is near a strong support zone, potentially forming a double Dip pattern.
The cryptocurrency and business conference at Mar-a-Lago on April 25th is attracting attention from the TRUMP holder community. The top 297 holders will be invited to attend. Notably, the 29 wallets with the largest TRUMP holdings ( whales ) will receive VIP access, allowing them direct access to the president. The photo showing eligibility verification was taken on April 10th.
TRUMP needs to hold above $2.78 to maintain the double Dip pattern. If buying pressure is strong enough to successfully defend this area, a breakout above the $3.08 (neckline) could open up a rally to $3.34, corresponding to the 0.618 Fibonacci level and representing an increase of approximately 19% from the current price.
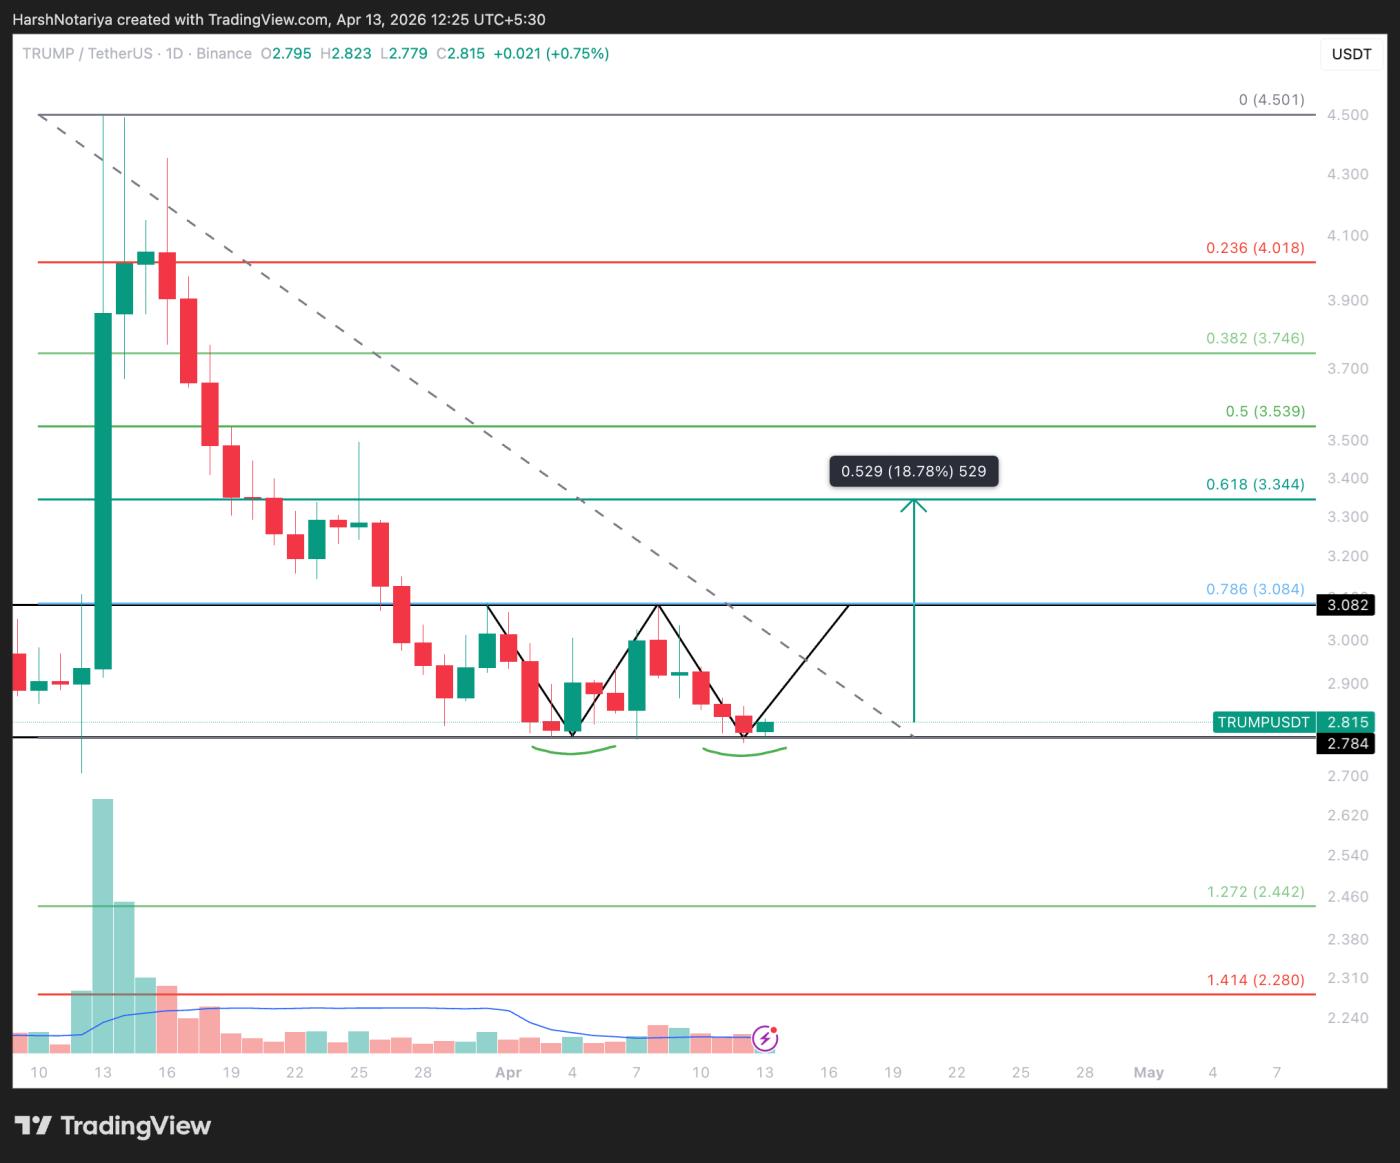 Trump price analysis. Source: TradingView
A bearish scenario could unfold if the $2.78 support zone is breached. If this happens, TRUMP could continue its decline towards its All-Time-Low . A new Dip around $2.44, the 1.272 Fibonacci extension level, could be the next target. Currently, the Token is still down approximately 96% from its historical peak of $73.43 set in January 2025.
The Token holder event on April 25th no longer generates strong market demand due to the Snapshot being finalized. However, any positive information related to this event could become a major factor impacting the price of TRUMP.