The S&P 500 has recovered all its losses since the war, and BTC has climbed back above $74,000. Is this for real this time?
Written by: ChandlerZ, Foresight News
On April 14th, BTC rose steadily from around $70,500, regaining the $74,000 mark, while ETH rose 7.63% to approximately $2,367. The total market capitalization of cryptocurrencies rebounded to approximately $2.52 trillion, with Bitcoin's market capitalization share remaining between 57% and 58%.
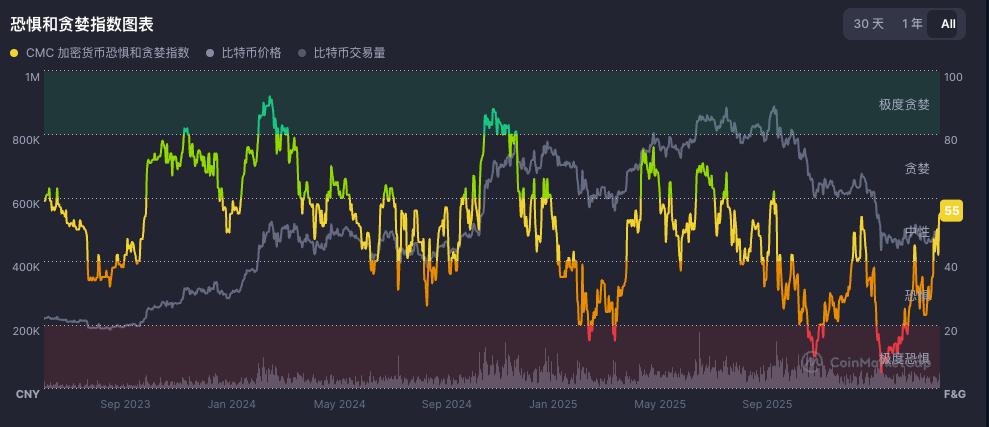
According to data from Alternative.me, the cryptocurrency fear and greed index rose to 21 today (compared to 12, "extreme fear," yesterday), indicating that the market is in a state of "extreme fear." It hit a low of 8 in early April, a rare reading since 2022.
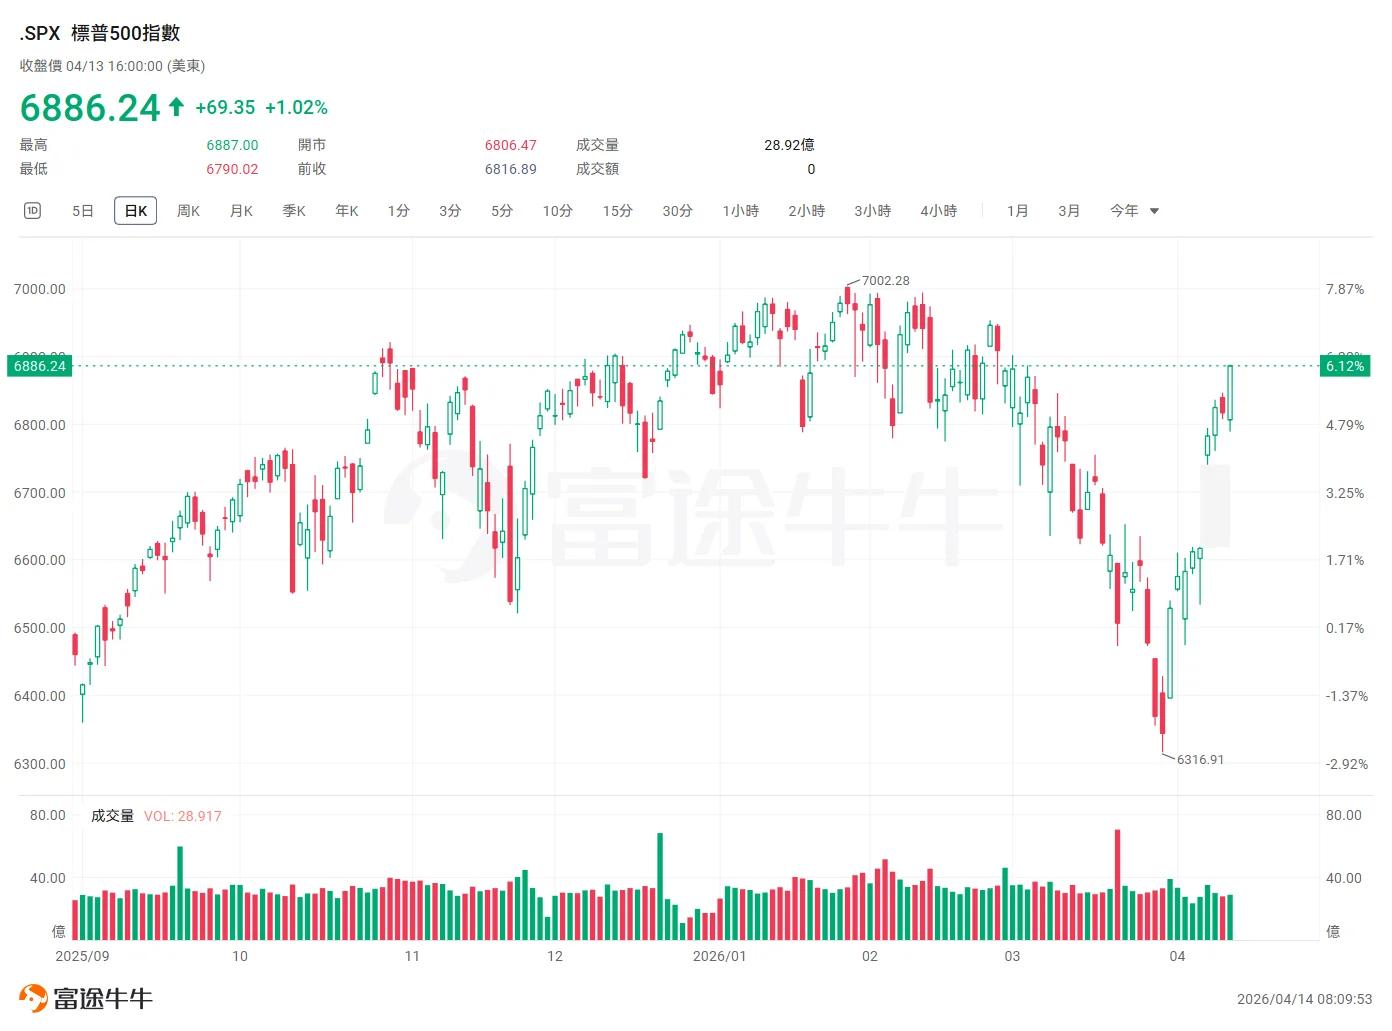
In traditional financial markets, the S&P 500 rose 1.02% to 6886 points, recovering all losses since the US-Israel conflict with Iran and surpassing the closing level of 6878 points on February 27. The Nasdaq rose 1.23%, achieving a nine-day winning streak, its longest winning streak since September 2025. The Philadelphia Semiconductor Index hit a new closing high for the fourth consecutive day, breaking through 9000 points for the first time in history.
Oil prices fluctuated significantly throughout the day. Abu Dhabi Murban crude oil once touched $106.49 per barrel, but as expectations for peace talks rose, WTI crude oil fell back to $99.08 at the close, while Brent crude closed at $99.36, both failing to hold the $100 mark. Gold fell slightly by 0.21% to $4739. The US dollar index fell 0.24%, hitting a new low in more than a month, while the offshore yuan rose for the seventh consecutive day, breaking through 6.82 during the session to reach a three-year high.
The US and Iran are still in contact, and the market is betting on a de-escalation.
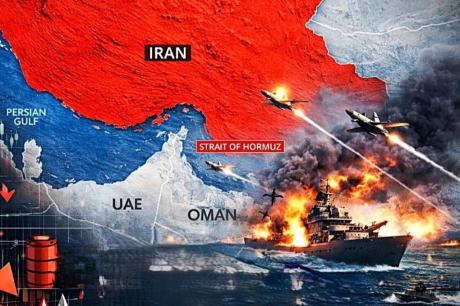
During Asian trading hours, the Islamabad negotiations, which lasted for over 20 hours from April 11th to 12th, ended in failure, with Vance leaving empty-handed. The main points of contention were Iran's nuclear program and the red line on uranium enrichment. Following the breakdown of negotiations, Trump announced that the US military would immediately begin a blockade of the Strait of Hormuz, effective at 8 PM on April 13th, targeting all ships entering or leaving Iranian ports.
After the blockade order took effect, Trump declared on social media that any Iranian fast attack craft approaching the blockade zone would be "immediately destroyed." Oil prices, US Treasury yields, and the US dollar all jumped in early Asian trading.
During the Asian trading night, Trump told reporters at the White House, "This morning, the right people, the right people, called us. They want to make a deal." He did not specify who was involved in the call. Almost simultaneously, Bloomberg, citing sources familiar with the matter, reported that the US and Iran were discussing a second round of face-to-face negotiations, aiming to reach a longer-term ceasefire agreement before the two-week ceasefire announced on April 7 expired.
According to RIA Novosti, citing The Atlantic, the next round of negotiations may be held in Islamabad on April 16. Pakistani Prime Minister Sharif stated that all parties are working to resolve outstanding issues between the US and Iran, and officials from Turkey and Egypt are also involved in mediation.
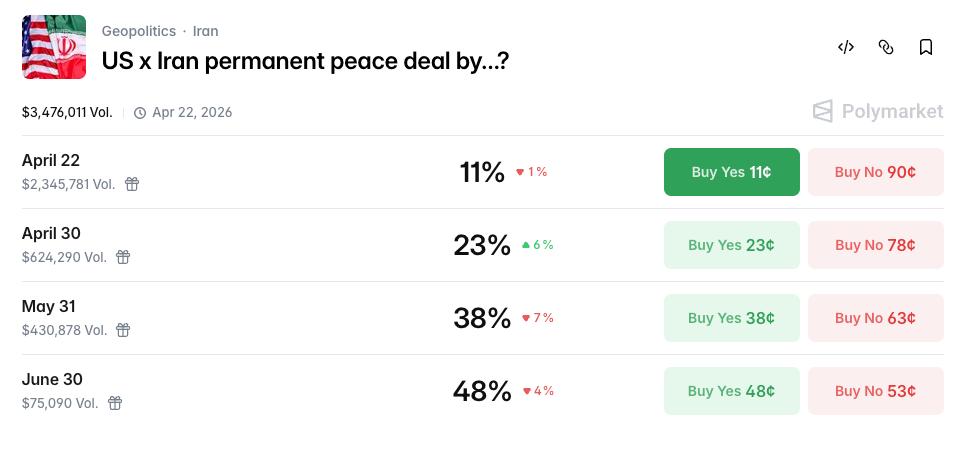
According to the latest data from Polymarket, the probability of the United States and Iran reaching a permanent peace agreement before April 30th this year has increased by 6% to 23%, while the probability of reaching an agreement before May 31st has decreased to 38%.
As a result, oil prices followed a classic inverted V-shape. News of the lockdown pushed Murban crude to $106.49 in the Asian session, but expectations of a potential peace talks limited the gains, with WTI falling back to $99.08 at the close, dropping below $100. The pullback in oil prices marked the beginning of a recovery in risk appetite that day. Lower oil prices eased inflation expectations and reduced interest rate pressures, creating room for a rebound in risk assets.
The US dollar also opened higher but then fell. The ICE US Dollar Index closed down 0.24%, and the Bloomberg US Dollar Index fell to its lowest level since March 3. A weaker dollar provides a short-term tailwind for BTC.
Bitcoin spot market shows strong short-term bullish sentiment.
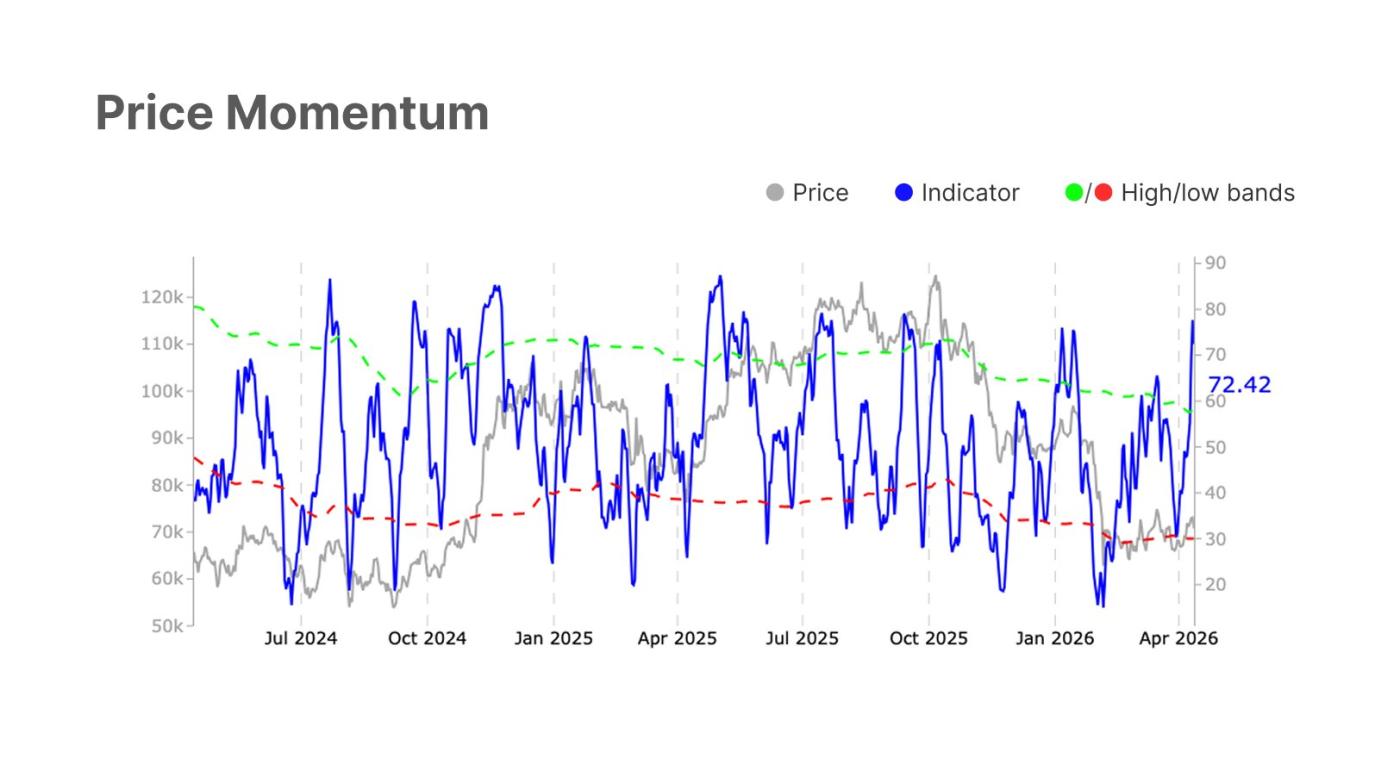
The Bitcoin market is showing significant upward momentum, with price momentum rising from 47.7 to 72.4, currently exceeding the high-frequency band of 58.4 and surpassing previous highs, indicating strong upward momentum in the market. This bullish sentiment is also reflected in the spot market, with spot CVD surging from $34.4 million to $63.9 million, exceeding the high-frequency band of $33.4 million, indicating aggressive buying activity in the spot market, strong short-term bullish sentiment, and increasing buying pressure.
Spot trading volume rose from $5.3 billion to $6.3 billion, indicating increased trading activity. However, it remained below the lower limit of the high-frequency band at $6.8 billion, suggesting that participation has rebounded but has not yet reached its peak. The rise is supported by some funds, but not sufficiently.
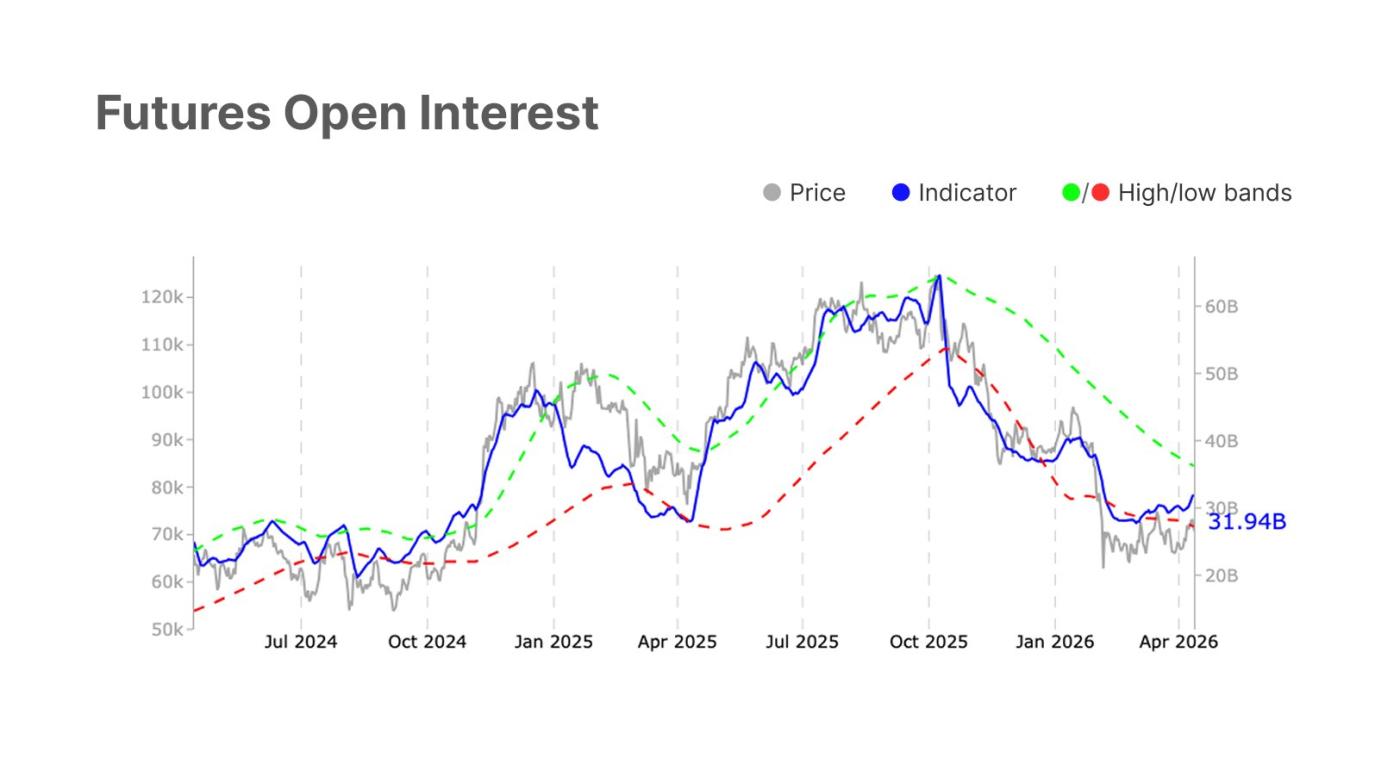
At the same time, the futures market also showed higher speculative interest and leverage levels, with open interest increasing by 7.2%. However, the market also showed signs of caution, with short positions increasing and long position funding decreasing by 198.6%.
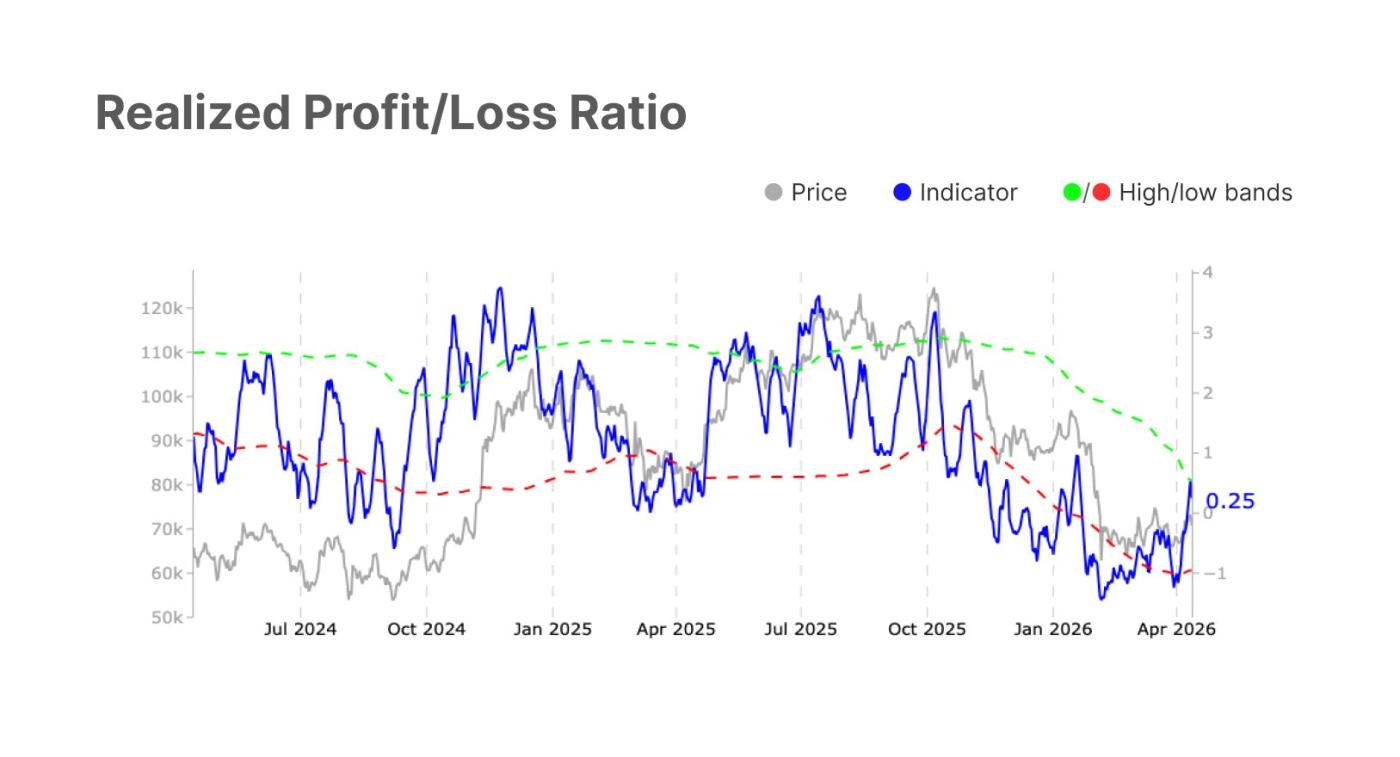
From a profitability perspective, market pressure has eased, unrealized losses have decreased, and the proportion of profitable Bitcoin in circulation has increased. This shift from loss to profit indicates a positive change in investor sentiment. Overall, all indicators suggest that the market exhibits strong bullish sentiment, increased investor participation, and enhanced risk appetite, although signs of caution and market stabilization also exist.
Crypto Market Aftermath
The core question facing BTC after it reached 74,000 remains: is this a reversal or a rebound?
From a position structure perspective, a large number of short positions have accumulated in the current $72,200 to $73,500 range. Finance Magnates, citing analysts, stated that two conditions are needed for BTC to hit $80,000 in the short term: first, the liquidation of short positions in this range triggers a cascading effect (involving approximately $6 billion in short positions); second, continuous inflows of ETF funds coupled with the maintenance of the ceasefire.
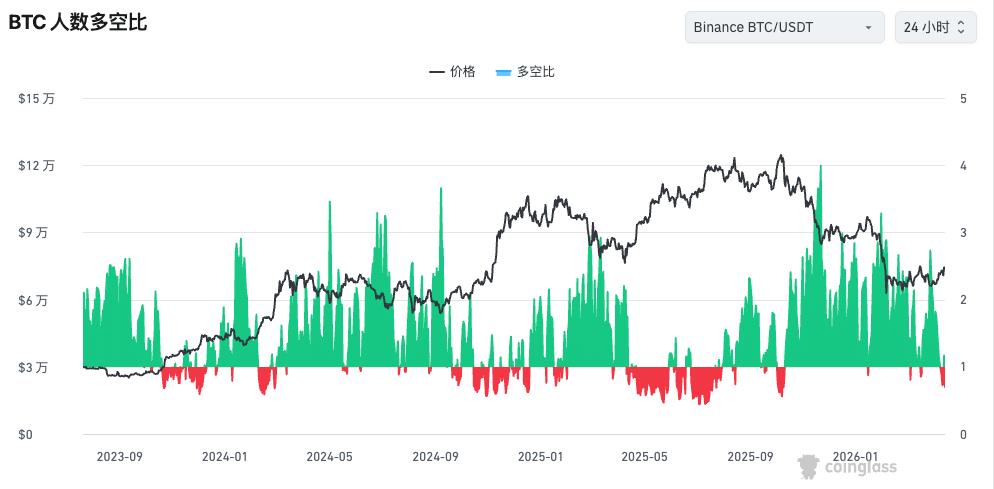
Meanwhile, Coinglass data shows that Binance retail BTC long/short ratio is 0.7, indicating extremely bearish sentiment. Historically, whenever the long/short ratio falls to around 1 or below, BTC price often approaches a temporary bottom, followed by a rapid rebound. Similar patterns occurred in early 2024, September 2024, and early 2025, where highly crowded short positions were liquidated by price increases, resulting in a short squeeze, and the green histogram bars subsequently expanded sharply.
The current position structure bears similarities to these historical points. BTC is fluctuating between $68,000 and $73,000, with short positions accumulating due to negative news such as lockdown orders and broken negotiations, pushing the long-short ratio to a low level. Once a clear catalyst emerges, such as a second round of negotiations leading to an extension of the ceasefire, an upward price breakout will force the dense short positions to be covered, creating a cascading liquidation and amplifying the upward movement. The current position structure fuels a potential short squeeze.
In the short term, the potential second round of US-Iran talks on April 16th ranks first among potential catalysts. If the ceasefire is extended or a longer-term agreement is reached, a further decline in oil prices would ease inflation expectations, indirectly opening up room for the Federal Reserve to cut interest rates. Secondly, the March PPI data to be released on April 14th is crucial; if it falls short of expectations, it would reinforce the narrative of interest rate cuts.