Bitcoin (BTC) is currently trading around $74,500 after a strong rebound from its early April Dip , but several technical indicators across timeframes suggest this upward momentum may be stalling at a historically significant resistance level.
This increase marks a recovery of over 15% from the $64,000 price level that BTC reached in early April, rekindling hopes of a broader trend reversal. However, with the price currently stuck between the ascending channel and a large supply zone, buyers will have to demonstrate decisiveness with a clear breakout – otherwise, the initiative could shift back to the sellers.
The upward channel has reached a key resistance zone.
On the daily chart, Bitcoin has been trading within an ascending parallel channel from its Dip near $62,000 in February, consistently creating higher Dip than previous Dip .
Currently, the price is approaching the upper boundary of this ascending channel and simultaneously testing the strong resistance zone between $74,000 and $76,000 – a price range that previously pushed the price down in mid-March.
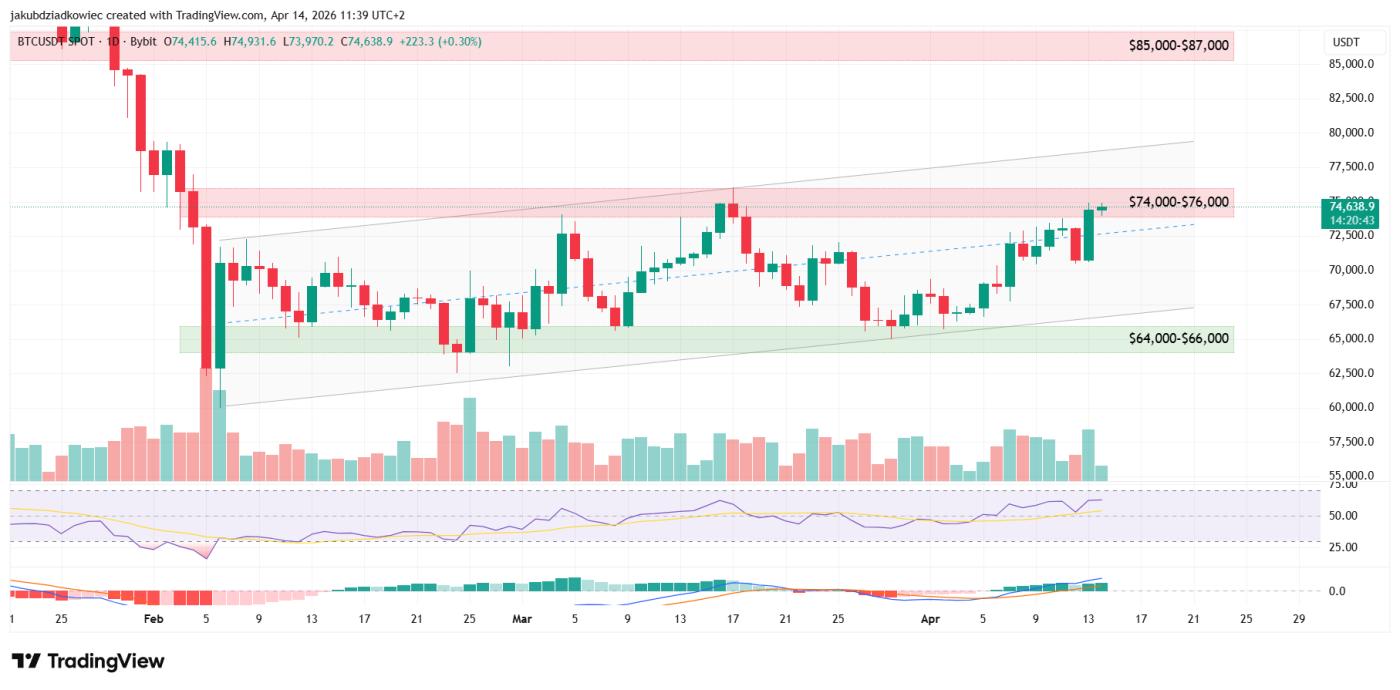 BTC/ USDT daily chart. Source: Tradingview
The combination of the ascending channel resistance and the sideways supply zone makes this price level a crucial deciding factor for BTC's next direction.
If the daily candle closes above $76,000, the price could open the way to the next major resistance zone at $85,000–$87,000. Conversely, the main support box lies at $64,000–$66,000, coinciding with the lower boundary of this price channel.
Weakening momentum is evident on the 4-hour chart.
When switching to the 4-hour timeframe, the short-term structure remains bullish – BTC has created a series of higher highs and Dip Dip since the March 27th session.
The price has surpassed the previous peak at $72,000 (blue line) and is now turning this level into a new support zone.
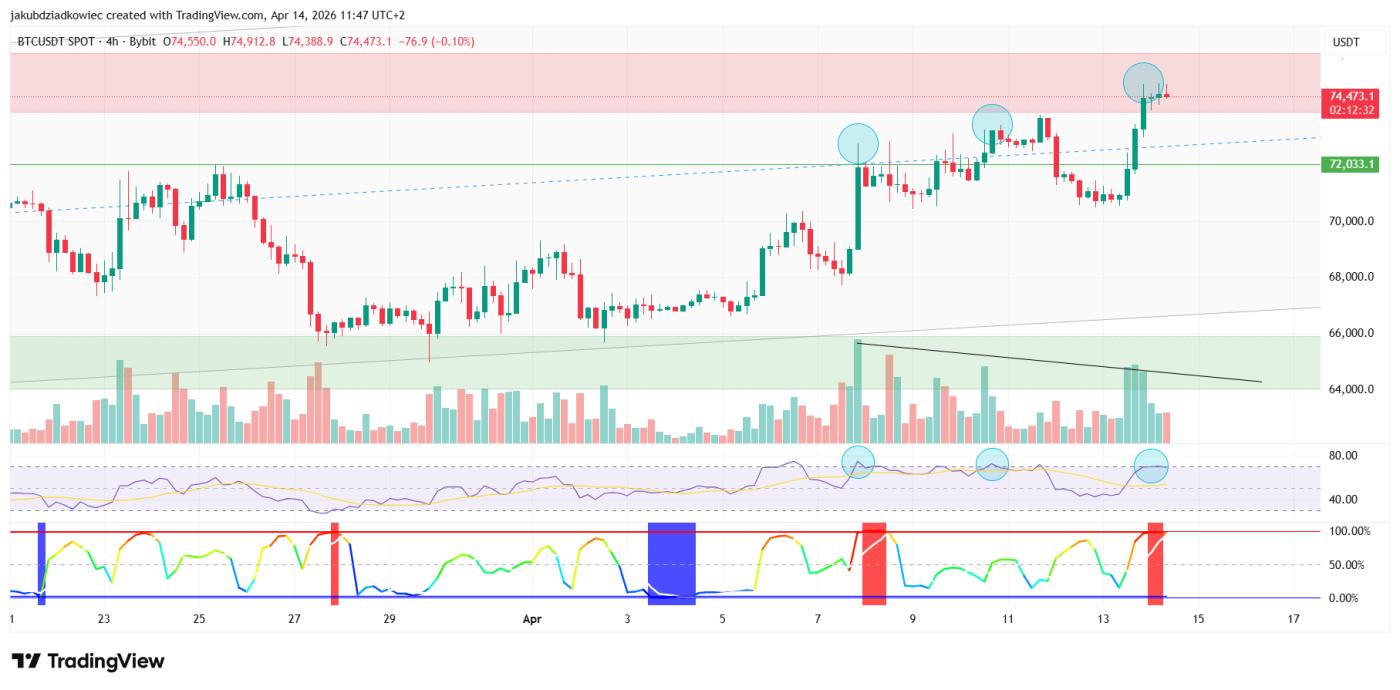 4-hour chart of BTC/ USDT / Source: Tradingview
However, momentum indicators are showing a different signal. While the price has reached three consecutive higher highs, the Relative Strength Index (RSI) has been making progressively lower highs (blue circle), forming a triple bearish divergence pattern – a classic signal indicating weakening buying pressure.
Volume has also been gradually decreasing throughout this price surge, confirming that market participation has become less enthusiastic.
In addition, the Bollinger Band Width Percentile (BBWP) is also reaching historical extreme levels – often preceding periods of volatility contraction and the risk of short-term price corrections.
BTC Price Prediction: Two Scenarios to Watch
Bullish scenario: If the closing price of the day is above $76,000 accompanied by an increase in volume, the bearish divergence signal will be invalidated and the possibility of BTC breaking through to the $85,000–$87,000 range becomes feasible.
Invalid: The price failed to hold above $76,000 and returned to its previous price range.
Bearish scenario: If rejected at the current resistance zone, the price could correct to $72,000. If the $72,000 mark fails to hold, selling pressure could pull BTC down to test the $69,000–$70,000 area further.
Invalid: Price breaks out and closes strongly above $76,000.