Ethereum (ETH) price has just broken out of the middle line of the ascending channel on the daily chart after weeks of narrowing price volatility, opening up the possibility of further declines to $2,070 if the support zone at $2,264 fails to hold.
Currently, the second-largest cryptocurrency by market capitalization is trading around $2,291 (at the time of writing), down approximately 0.93% in the last 24 hours. Simultaneously, the ETH/ BTC exchange rate has just broken out of its ascending channel on the 12-hour chart and could now target 0.028 BTC after retesting the broken support zone.
The ETH/ USDT daily chart shows the potential for significant volatility after a period of price consolidation.
The ETH/ USDT daily chart shows a parallel ascending channel starting from February 6, 2024. The price reacts quite clearly to both the upper and lower bands, especially the middle line of the channel – this point has repeatedly alternated between support and resistance as the price rises.
Currently, this middle line is being broken. If the candle closes confirming the loss of this area, the predicted price channel for ETH is likely to continue falling towards the lower band near $2,070. If it falls further, the next support zones are $2,001.70 and $1,920, both of which were tested in February and March 2024.
Conversely, the $2,370 level has repeatedly hampered the recovery and remains a crucial resistance level to overcome in order to break the downtrend and confirm a positive signal. The forecast for April also highlighted this area as a key point to watch.
The RSI indicator is currently slightly above 50 – indicating a neutral market, neither leaning towards buy nor sell. More noteworthy is the BBWP (Breaking Price Volatility Indicator), which is showing three consecutive extremely low green bars, accompanied by a gradual decrease in daily volume . Historically, this pattern often signals a significant price movement, potentially an upcoming uptrend or downtrend.
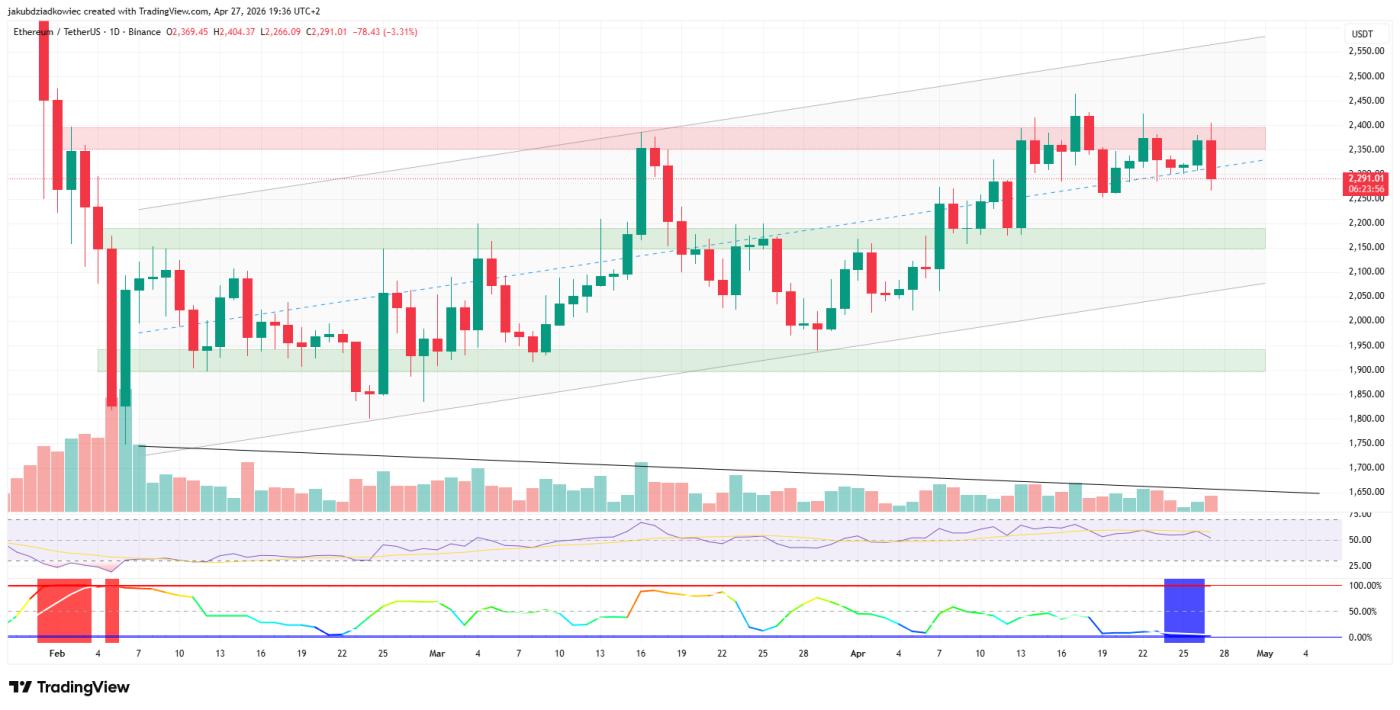 ETH daily chart / Source: Tradingview
The 4-hour ETH chart confirms that selling pressure is prevailing.
Although the daily chart is still within a multi-month pattern, the 4-hour ETH/ USDT chart has shown clear negative signs. The price broke through the short-term uptrend line and is currently testing the 0.382 Fibonacci level (retracement) at $2,264.
If this area is also breached, the next strong support zone lies within the "golden pocket" just above the $2,114 mark. The BBWP indicator on the 4-hour timeframe shows very high red bars, completely opposite to the tight consolidation on the daily timeframe – confirming that large amounts of money are actively flowing in during this period.
The RSI on the 4-hour timeframe has slipped into negative territory, and volume has also increased significantly as the price broke through the trendline. This is a classic sign that sellers are in control of the short-term trend.
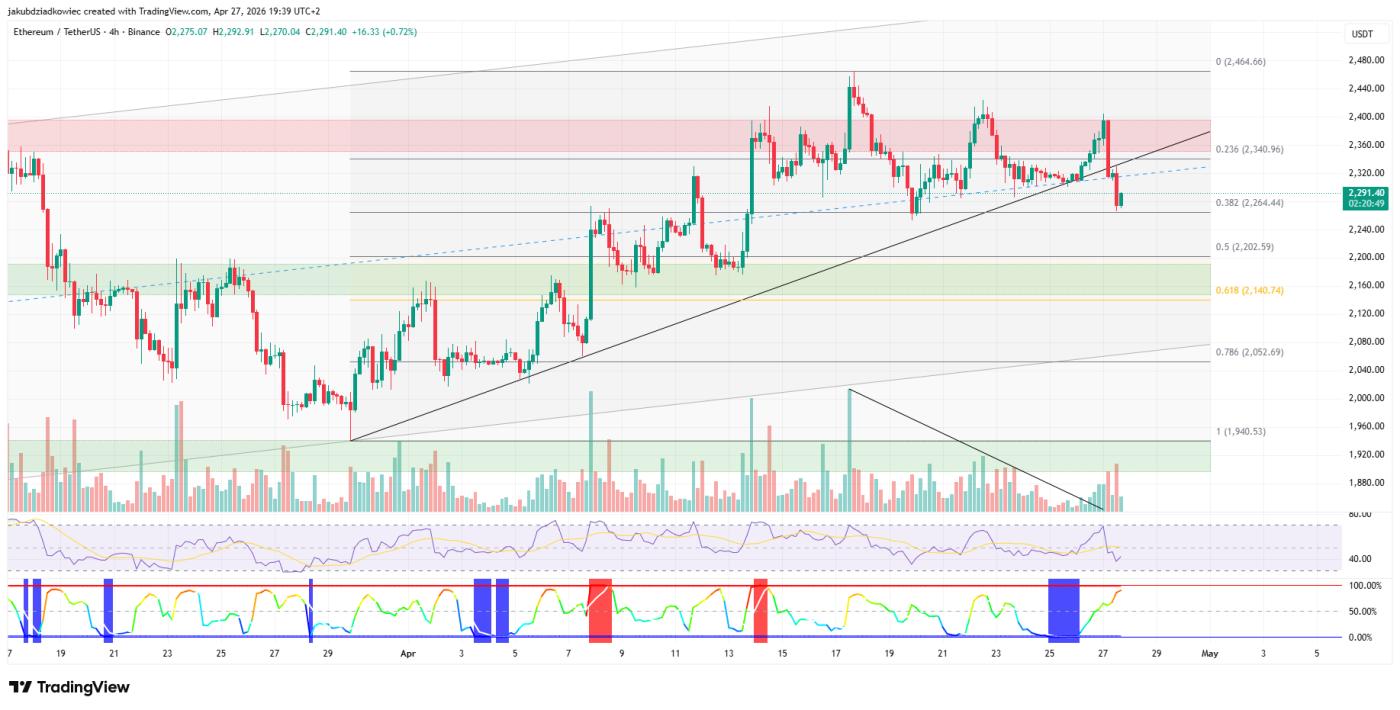 ETH 4-hour chart / Source: Tradingview
Michael van de Poppe is watching the 0.026 BTC level for a long position in Ethereum.
The weaker momentum compared to Bitcoin further strengthens the bearish outlook for ETH. Analyst Michael van de Poppe suggests that the 0.032 BTC level will be a confirmation point for a potential bullish reversal, while 0.026 BTC will be a crucial support zone when XEM a long-term position.
“I’ve been repeatedly highlighting key price levels for ETH. Unfortunately, they’ve just been broken, meaning the short-term uptrend hasn’t resumed. As long as ETH remains below 0.032 BTC , I’m not interested in buying more, unless a clear Dip pattern appears or the 0.026 area is tested. This is a larger timeframe support point that I XEM very important to watch for long-term positions,” quoted Michael van de Poppe.
He also noted that ETH 's previous cycle Dip was established in April 2025, and the 0.026 BTC level remains an attractive area for institutions and long-term investors to accumulate again.
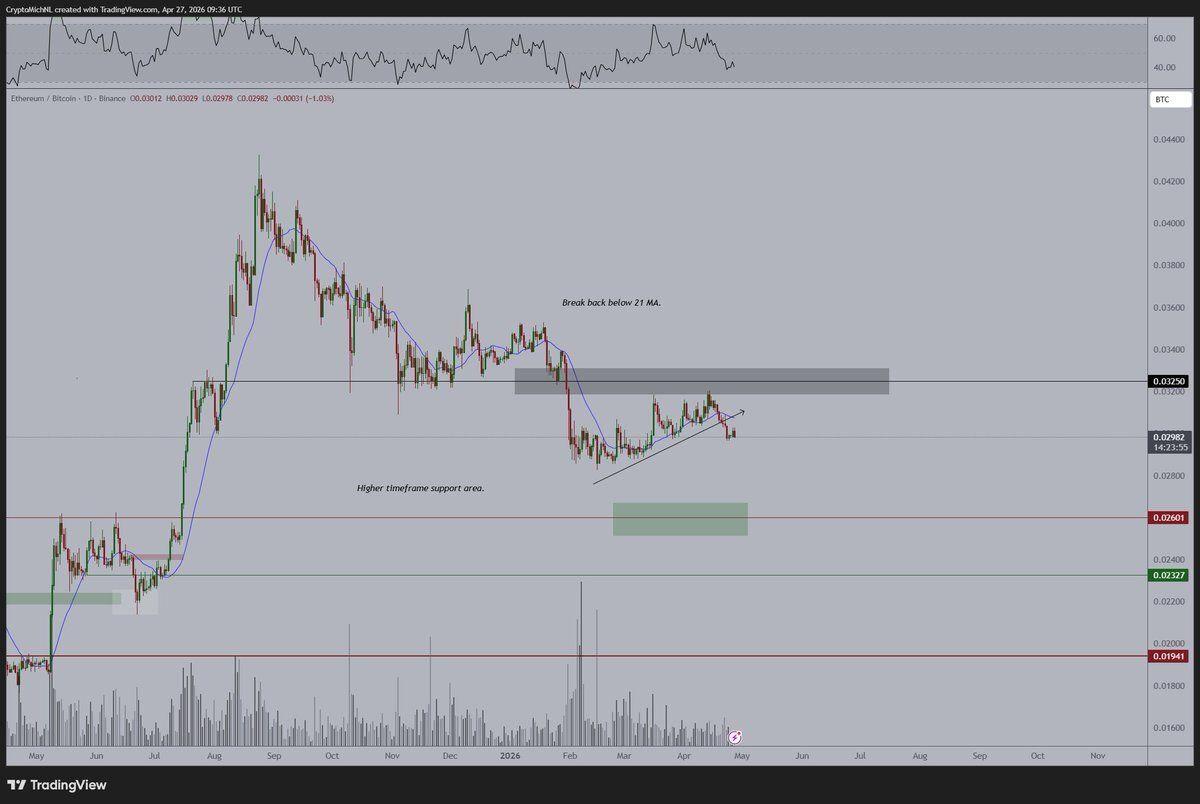 ETH/ BTC daily chart / Source: X
The 12-hour ETH/ BTC chart is heading towards the 0.028 BTC target after breaking the price channel.
The 12-hour ETH/ BTC chart continues to show weak signals. A fairly clear parallel ascending channel led the price action throughout February, March, and almost all of April 2024, but the lower band was broken on April 23, 2024. Currently, the pair continues to decline sharply after retesting the lower band, which is considered theoretically correct.
When using the height of the price channel to project a breakout point, a reasonable target for this drop would be around 0.028 BTC – coinciding with the bearish scenario previously analyzed by Van de Poppe.
The Relative Strength Index (RSI) is currently signaling a downtrend, while price volatility has narrowed sharply after breaking out of the price range. This combination historically often signals that the price will continue following the current trend rather than reversing, suggesting that the ETH/ BTC pair may be preparing for another decline.
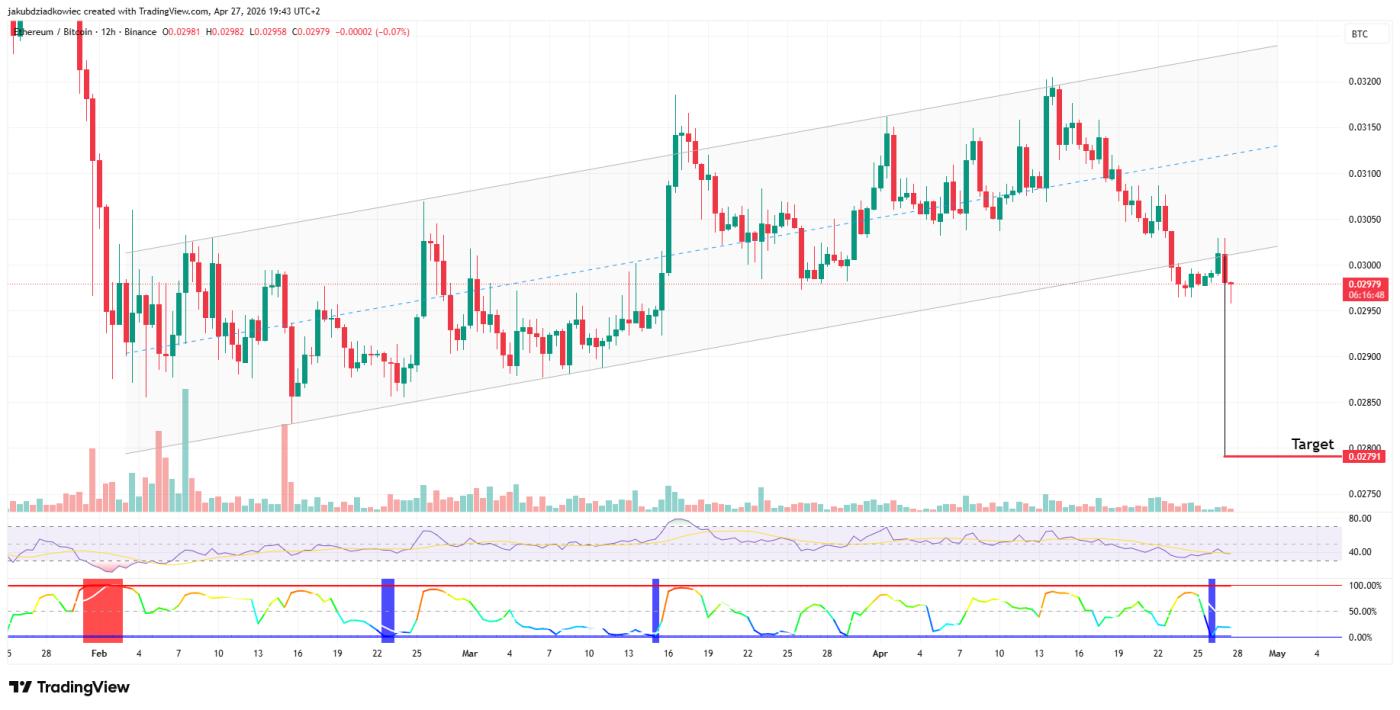 ETH/ BTC 12-hour chart / Source: Tradingview
The next 48 to 72 hours will be crucial in XEM whether Ethereum can hold its channel on the daily timeframe or continue its decline towards the lows reached in the spring. Traders watching for higher price targets on larger timeframes will need Ethereum to successfully defend this zone.