Original author : Frank, MSX Maiton
It has been two months since the US and Israel launched their joint strike against Iran.
On February 28, the very beginning of the year, Iran's Supreme Leader Khamenei was assassinated, and the Strait of Hormuz was suddenly closed. According to the market intuition formed over the past few decades, this was almost a no-brainer trading formula— war breaks out, oil prices rise, safe-haven demand increases, gold prices surge, and technology stocks come under pressure.
But the capital market in 2026 presented a more complex and counterintuitive answer:
Gold did not continue its upward surge along the traditional safe-haven logic, but instead fell sharply from its January high; the Nasdaq ETF first fell from positive returns to negative territory this year, and then quickly recovered amid expectations of a ceasefire; the real frontrunners were not gold or copper, but US energy assets that are far from the conflict zones in the Middle East and have stable production capacity and cash flow.
What's even more bizarre is that during this period, hot wars, ceasefires, strait blockades, and negotiation stalemates occurred... the script on the battlefield was repeatedly rewritten, and the script in the capital market also turned several pages.
Looking back at this 60-day conflict, the market has come to realize that war is a pricing chain that transmits through energy supply, inflation expectations, interest rate paths, the strength of the dollar, and asset valuations . Not only has the old formula of "war = buy gold" failed, but the pricing logic of "war" in global capital markets is also being completely rewritten.
I. 60 days, three stages
Let's first go through the timeline.
Looking back at this round of conflict, it can be roughly divided into three stages:
- Impact of the Hot War (February 28 – Early April): Following the US-Israeli strikes on Iran, Iran retaliated against Israeli and US targets with missiles and drones, disrupting passage through the Strait of Hormuz. The global energy market quickly entered a tense state, leading to a rapid rise in oil prices and a revaluation of energy stocks. Gold, on the other hand, plummeted by about 20% from its January high of nearly $5,600.
- Ceasefire negotiations (early April – April 21): As regional mediation progressed, there were expectations of a ceasefire and the reopening of the Strait of Hormuz between the US and Iran. Risk assets began to recover, and the Nasdaq ETF QQQ.M rebounded rapidly from its lows. During this phase, the market was trading on the assumption that "the worst-case scenario may not happen." However, the Strait of Hormuz did not truly return to stable passage, and events such as the US blockade, Iran's seizure of merchant ships, and the breakdown of negotiations continued to occur.
- Stalemate and Reversals (April 22 – Present): Trump announced an extension of the ceasefire, but the US blockade and Iran’s seizure of merchant ships proceeded simultaneously, leaving the situation in a state of "neither war nor peace." The market gradually recovered from the panic, with the Nasdaq rebounding from -8.4% to +8.21% year-to-date, and oil prices falling from above $110. However, the Strait of Hormuz has not yet truly reopened to traffic.
It is precisely in the tug-of-war of these three stages that the market gradually realized that it should no longer simply trade the single variable of "the start of the war" or "the end of the war." Instead, the core of pricing lies in how the war changes energy, inflation, interest rates, and the dollar.
As of April 26, the performance of several core asset classes has already illustrated the point:
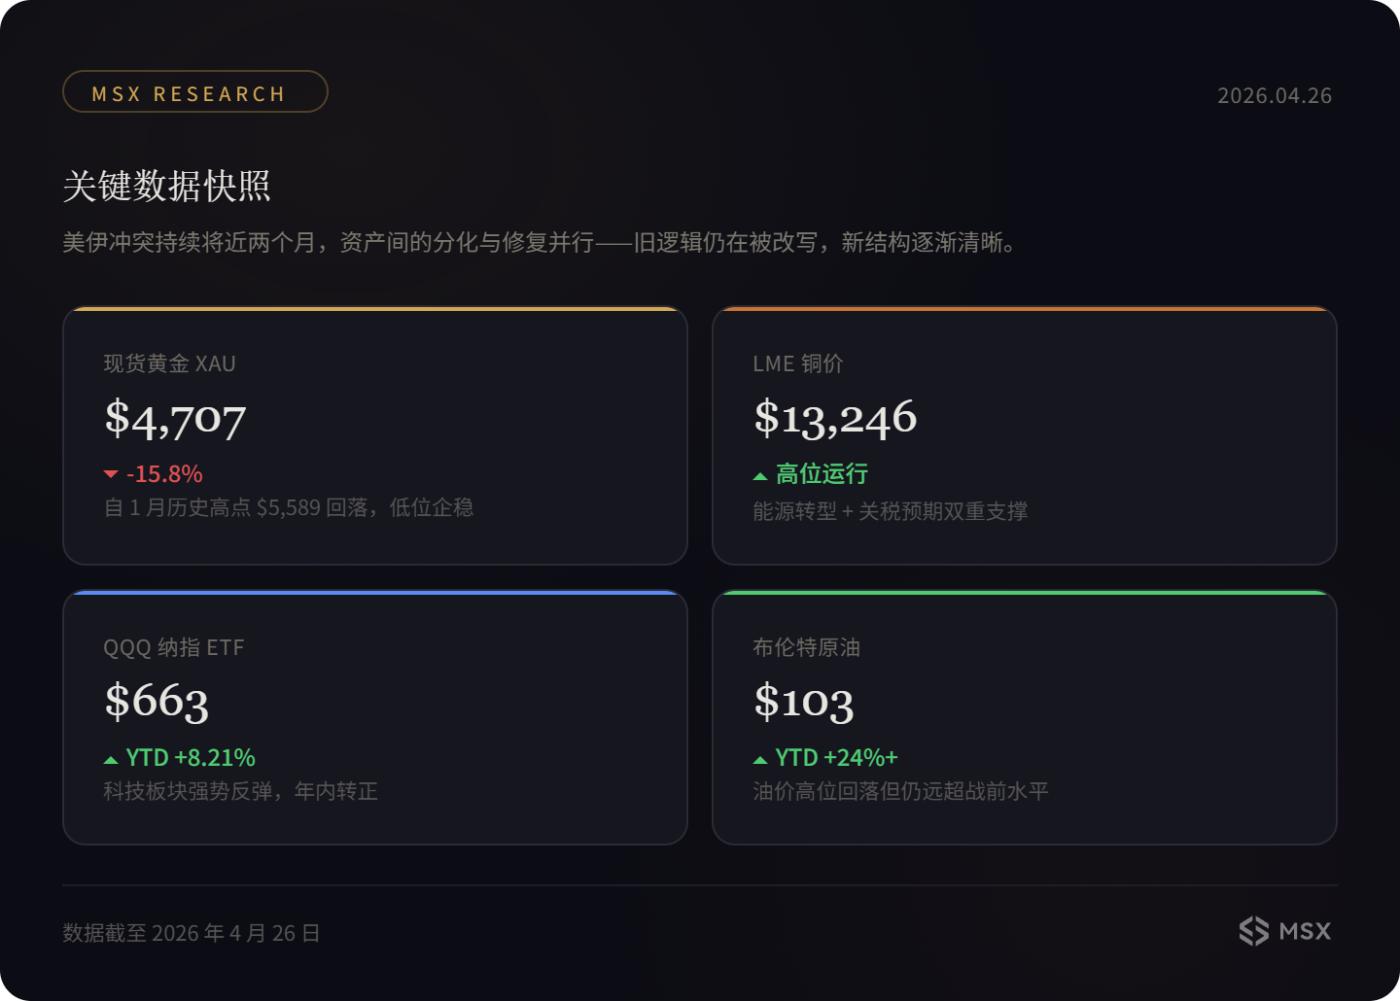
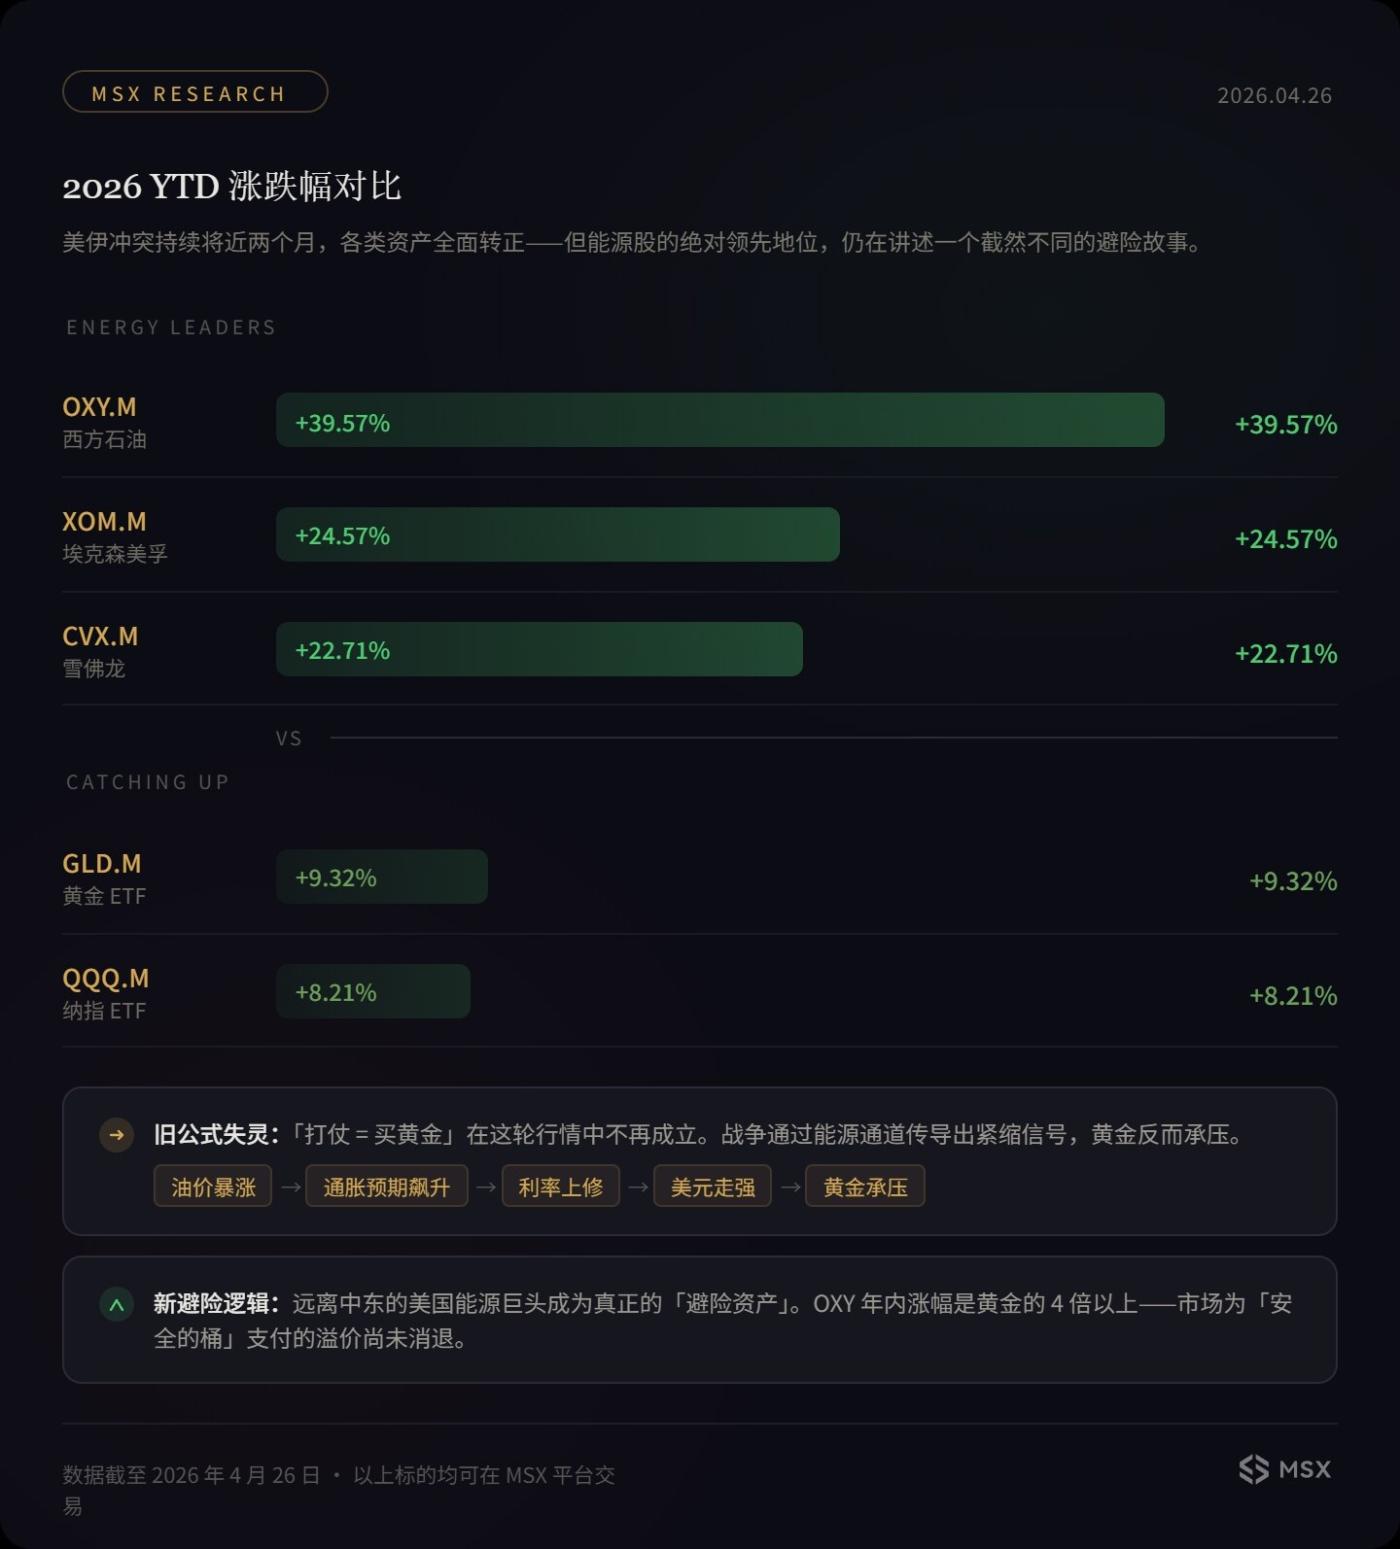
More noteworthy is the ranking of assets. Sixty days ago, the market was extremely polarized: energy stocks surged, gold plummeted, and the Nasdaq turned negative. Now, most assets have returned to positive territory (especially QQQ.M), but the ranking has not changed—energy stocks remain the strongest asset class in this conflict .
This further illustrates that the market's pricing of this war is not a binary choice of "safe haven vs. risk," but rather a continuous transmission along the chain of "oil price - inflation - interest rate - dollar - valuation," starting from the energy supply shock.
II. Why the old formula "war = buying gold" no longer works.
Therefore, the key to understanding the "counterintuitive" nature of this 60-day market trend lies in breaking down the transmission chain.
After all, the most counterintuitive aspect of this market trend is gold.
With the outbreak of war, the blockade of the Straits, and soaring oil prices, gold should have been the most direct safe-haven option. However, in reality, gold did not continue to rise rapidly in the early stages of the conflict. Instead, it fell significantly from its January high. On the surface, this appears to be a "failure of safe-haven demand." But if we break down the macroeconomic transmission chain, we will find that gold's performance actually reflects another side of the trade war: stronger expectations of tightening.
- The first layer of transmission comes from oil prices: the Strait of Hormuz is blocked, and the uncertainty of crude oil and LNG transportation has increased sharply. The rise in energy prices quickly turned from geopolitical premiums into inflationary pressures. For the market, this means that the Federal Reserve cannot easily turn to easing and may even need to maintain a high-interest-rate environment for a longer period of time.
- The second layer of transmission comes from interest rates and the US dollar: higher real interest rates will increase the opportunity cost of holding gold, while a stronger US dollar will make dollar-denominated gold more expensive for non-US buyers. Reuters also mentioned in a report on gold trends in late April that rising oil prices pushed up inflation and interest rate expectations, which in turn put pressure on gold through the dollar and yield channels.
- The third layer of transmission is the backlash from the crowded trading itself: Before the war broke out, gold had already experienced an extreme surge, rising from less than $3,000 in early 2025 to near its high in January 2026. When a trade is too crowded, and a sudden shock occurs, funds may not continue to add to their positions; instead, they may choose to lock in profits first. For some short- to medium-term funds, war is not a new reason to buy, but rather a window to realize profits.
This is why the old formula "war = buy gold" seems too crude in this market trend. Gold remains a safe-haven asset, but it is not priced in a vacuum. As long as war drives up energy prices, inflation expectations, and real interest rates, gold will simultaneously face the pull of both safe-haven demand and tightening pressures.
In other words, gold did not ignore the war; it was simply reacting to the economic consequences of the war.
In contrast, the Nasdaq ETF's performance resembled a highly volatile stress test. After the outbreak of war, QQQ.M plummeted from positive returns at the beginning of the year into negative territory, with the technology sector experiencing a significant outflow of funds. High-valuation growth assets gave way to sectors with more certain cash flows, such as energy, value, and cash flow.
However, once the ceasefire expectation emerged, the Nasdaq quickly recovered, returning to positive territory for the year. The logic behind this rebound is not mysterious; it mainly benefited from improved ceasefire expectations, a decline in oil prices from their peak, a marginal easing of inflationary pressures, and a repricing of the possibility of interest rate cuts in the market, thus allowing growth stocks to recover their valuations.
The problem is that every link in this chain is not yet fully confirmed. The Strait of Hormuz has not yet returned to stable navigation, negotiations are still ongoing, oil prices remain high, and the basis for the Federal Reserve's shift is not solid.
Therefore, the rebound of the Nasdaq ETF is more like a "repair of risk appetite" rather than a complete relief of macroeconomic pressures.
III. Gold prices have fallen; who is the biggest winner?
The answer is energy stocks.
In this round of market activity, what the market is truly willing to pay a premium for is not an abstract sense of security, but rather verifiable, deliverable energy supply capabilities that are far from conflict zones, such as US energy giants that are far from the center of the Middle East conflict, have stable production capacity, more controllable transportation routes, and more certain cash flow.
This explains why OXY.M , XOM.M , and CVX.M have significantly outperformed gold ETF tokens and Nasdaq ETF tokens, as the market's risk aversion logic has shifted from "buying gold" to "buying certain supply," and from "hiding in interest-free assets" to "holding cash flow assets that can benefit from supply shortages."
This is also one of the most noteworthy changes in the 2026 war. While geopolitical risks have certainly not disappeared, the way capital markets react to them has clearly changed. The linear reaction of "war outbreak—risk increase—buy gold" is being replaced by a more complex transmission framework: the market no longer trades only the war itself, but is dissecting how the war will affect energy supply, inflation paths, interest rate expectations, the strength of the dollar, and the distribution of profits in the industrial chain, ultimately repricing the risk-reward ratios of different assets.
For investors, the key is no longer just judging whether the war will escalate, but further judging which chain of events the conflict will affect the market, what tools to use to express their views, and the choices must be more refined than ever before.
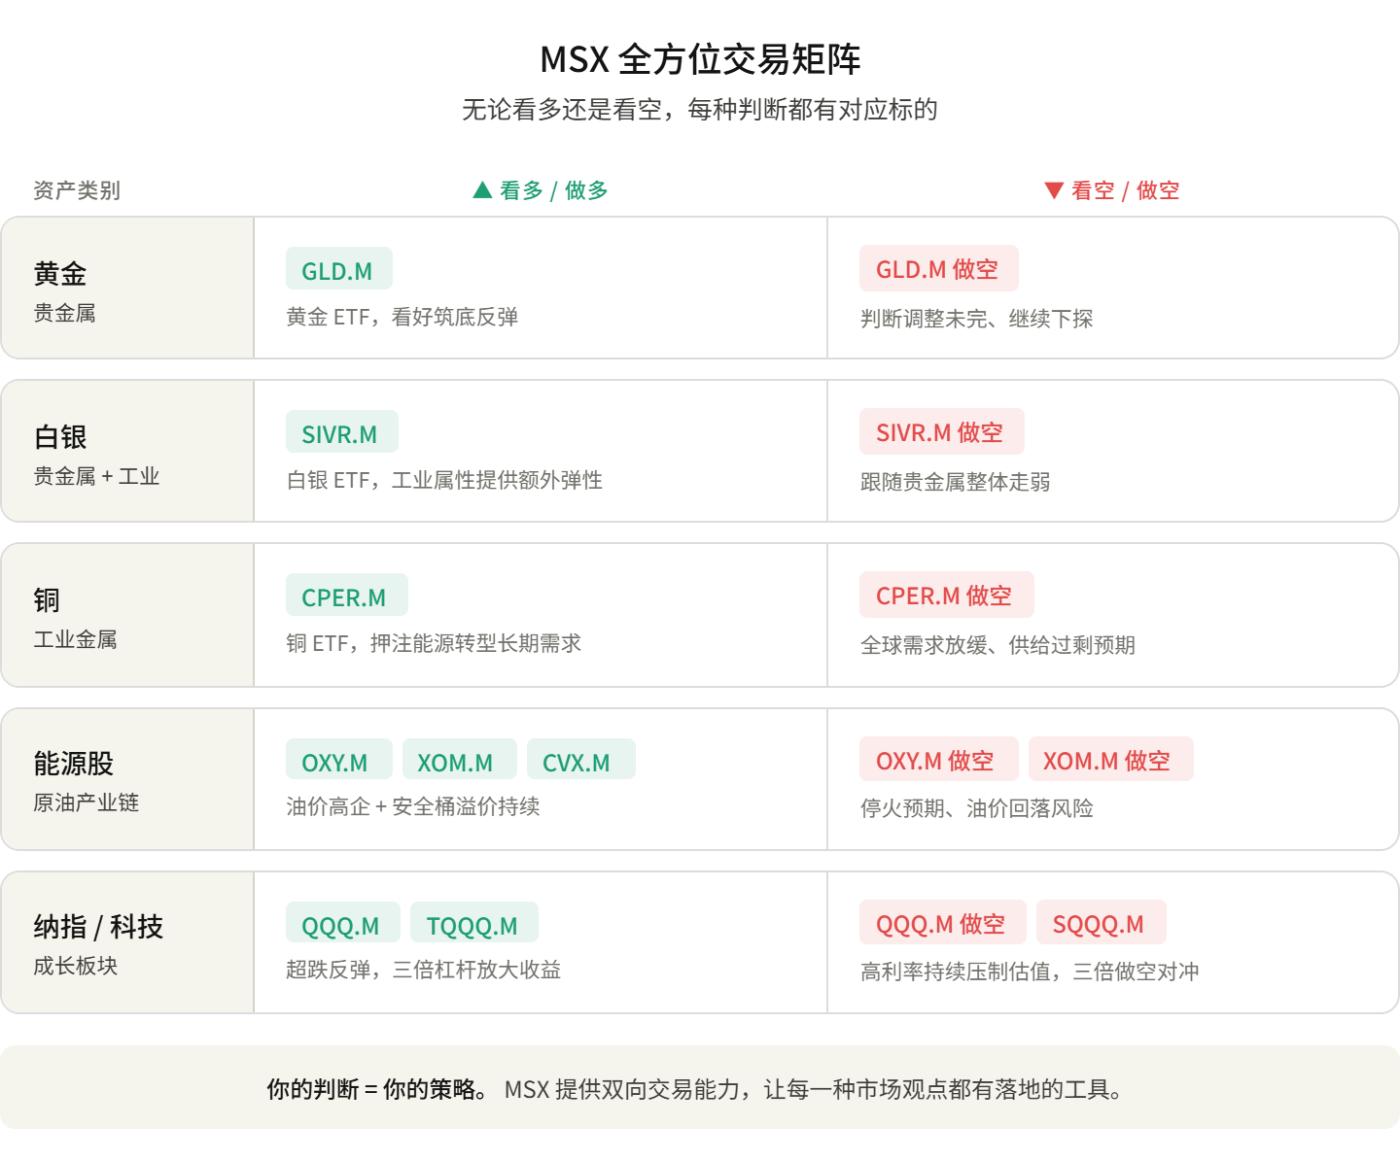
- If the conflict continues to stalemate, the passage through the Strait of Hormuz remains uncertain, and oil prices remain high, then energy-related US stock tokens such as OXY.M , XOM.M , and CVX.M may still be a more direct means of expression, since they trade the revaluation of "secure supply" and "energy cash flow."
- If the ceasefire is truly implemented, the Strait of Hormuz gradually resumes navigation, oil price pressures ease, and the market reprices its expectations for interest rate cuts, then previously pressured technology growth assets may continue to recover, and Nasdaq ETF tokens like QQQ.M would be more suitable to capitalize on the recovery in risk appetite.
- If the pressure on the US dollar and real interest rates begins to ease, the precious metal attributes of gold and silver may regain pricing space, and the GLD.M gold ETF token and SIVR.M silver ETF token are expected to regain elasticity, especially silver, which also has strong industrial attributes and is related to demand in photovoltaics, electronics, AI hardware, etc., and may provide higher upside potential than gold.
- If we judge that global manufacturing, energy transition, grid upgrades and AI data center expansion will remain the main themes in the longer term, then the CPER.M copper ETF token is more like a medium- to long-term structural tool. Although copper prices may be affected by the US dollar, demand and inventory in the short term, from a longer perspective, it is still one of the most important metals in the global infrastructure repricing process.
It is worth mentioning that, from the perspective of trading structure, for investors who want to participate in commodity market trends, the advantage of ETF tokens is that they are more suitable for phased deployment and position management. Compared with directly trading futures or spot contracts, it does not need to deal with more complex issues such as delivery, rollover, and margin management, and is also more suitable for expressing short-to-medium term swings or medium-to-long term allocation strategies.
The market is equally divided on Nasdaq ETF tokens.
If investors believe that oil prices will remain high and inflation will continue to be sticky, and the interest rate environment will continue to suppress the valuation of growth stocks, then shortQQQ.M , or hedging by short the Nasdaq ETF token three times with SQQQ.M , may be a more direct way to manage risk.
If investors anticipate that subsequent non-farm payroll and inflation data will weaken, and the Federal Reserve will re-emerge with easing signals, the technology sector is expected to continue its oversold rebound. In this case, long onQQQ.M , or expressing a higher expectation of recovery through a 3x long position in the Nasdaq ETF token via TQQQ.M , is also an option.
Therefore, the point here is not to provide a single correct direction.
The market will never automatically move towards a particular asset simply because of the word "war." What truly matters is whether investors can break down macroeconomic judgments into tradable asset paths. For example, should they trade energy supply or interest rate declines? Should they bet on a recovery in precious metals or a rebound in tech stocks? Should they long on volatile, certain cash flows or hedge against the downside risks of overvalued assets?
After all, in the new market environment, determining the direction is only the first step. More importantly, once you have formed a judgment, can you use sufficiently efficient, flexible, and low-barrier tools to transform that judgment into an executable trading strategy?
In conclusion
60 days ago, if someone told you:
- US and Israeli airstrikes on Iran resulted in the assassination of the Supreme Leader and the closure of the Strait of Hormuz, but gold prices fell by 16%.
- Tech stocks initially fell 8%, then rebounded 8%, forming a V-shaped recovery in two months.
- Few people dared to heavily invest in energy at the beginning of the year, but OXY is expected to rise by nearly 40%.
- The Nasdaq and gold had almost the same year-to-date (YTD) return (+8.21% vs +9.32%), while the OXY was four times that of the Nasdaq.
You probably won't believe it.
But this is the market in 2026. The old logic hasn't completely failed, but it's no longer sufficient. The market has learned, through this 60-day conflict, not to simply react to the keyword "war," but to dissect the economic transmission path of war, assess the credibility of a ceasefire, and dynamically price the stalemate.
What we can do is not predict what the next answer will be, but ensure that we have the right tools when the answer appears.
For the global investment market under Trump, any possibility is real, and what we can do is not to predict what the next answer will be, but to ensure that we have enough appropriate tools at our disposal as the answers gradually emerge.
The real dividing line is whether or not one can efficiently translate judgment into trades.