Strategy stock heads into tonight’s Q1 earnings with the chart already breaking out of an inverse head and shoulders pattern in pre-market trade, up 47% from the February lows.
The options market has flipped from defensive to bullish. Analyst price targets keep rising. But volume concerns are showing up and a key technical line still caps the recovery. Additionally, Michael Saylor paused Bitcoin purchases into the print. The breakout is happening regardless. The question is whether tonight’s number lets it hold.
Strategy Stock Built an Inverse Head and Shoulders Off the February Lows
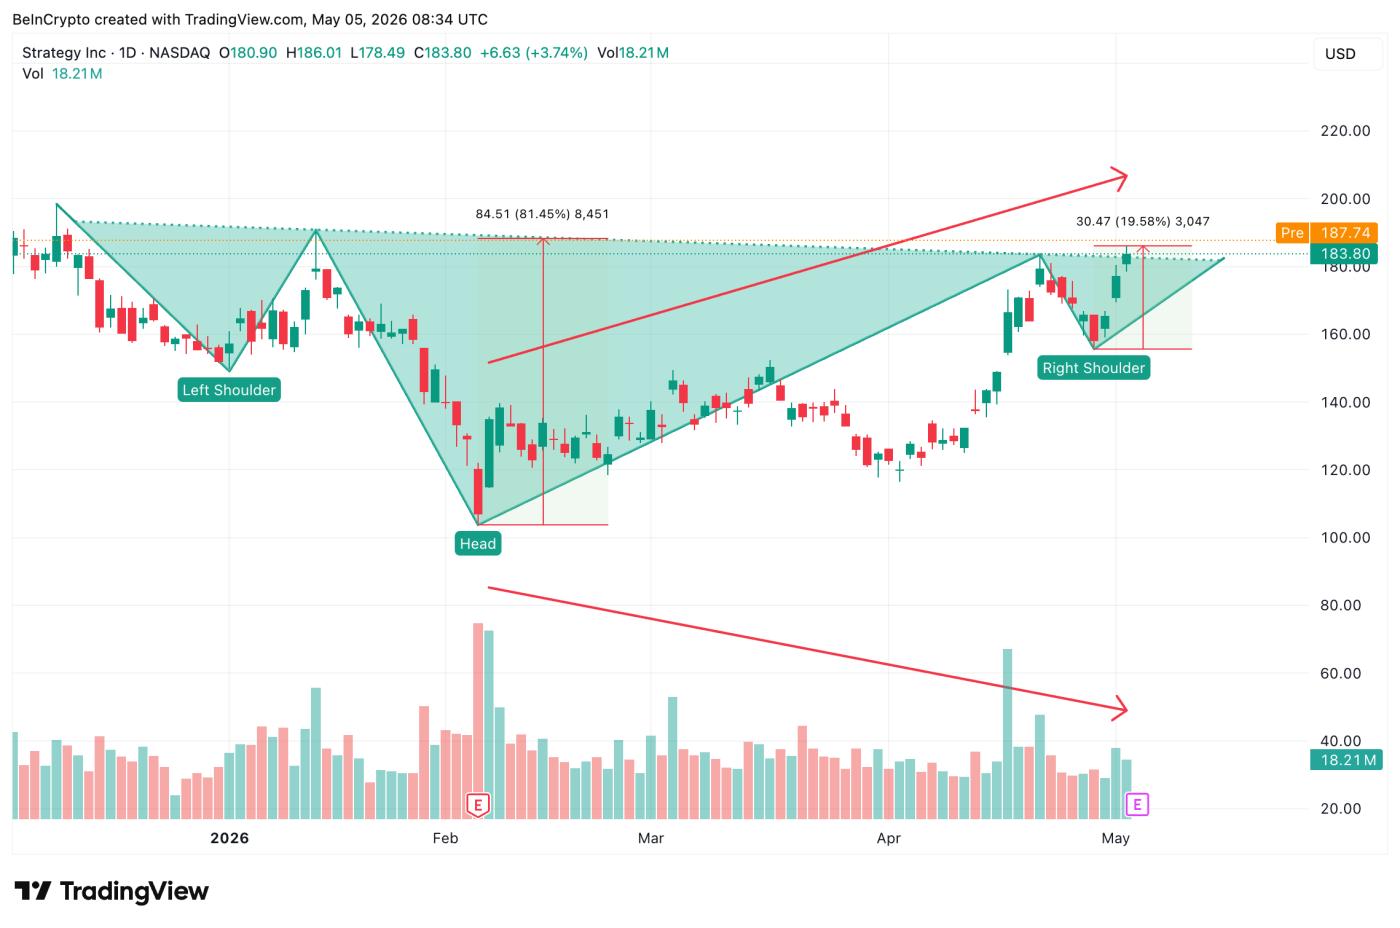
Strategy stock (NASDAQ: MSTR) has rallied roughly 47% since the company reported a $42.93 EPS loss on February 5, 2026, when Bitcoin’s price drop forced massive mark-to-market losses through the earnings line. The recovery from that low has formed a recognizable bullish reversal pattern, an inverse head-and-shoulders.
Want more insights like this? Sign up for Editor Harsh Notariya’s Daily Newsletter here.
The pattern’s neckline sits just slightly under the May 4 close. While it seems that the Strategy share price is almost above the neckline, at press time, a longish wick is hinting at exhaustion.
 Inverse Head and Shoulders: TradingView
The setup is textbook bullish in structure. Inverse head and shoulders patterns historically resolve upward when the neckline breaks on rising volume, and the measured move from head depth to neckline gives an 80%+ price projection well above current levels.
The problem is volume.
Though the MSTR share price has trended higher between early February and early May, daily volume has trended lower rather than higher. Bullish reversal patterns require expanding volume to confirm participation. Strategy stock has the price structure but not the volume signature.
The pattern says one thing. The volume says something else. Tonight’s earnings reaction has to resolve which signal wins.
The Options Market and Analyst Action Show the Bull Case Is Already Priced In
The shift in options positioning between February’s earnings and tonight’s print captures how heavily the recovery is already discounted into Strategy share price.
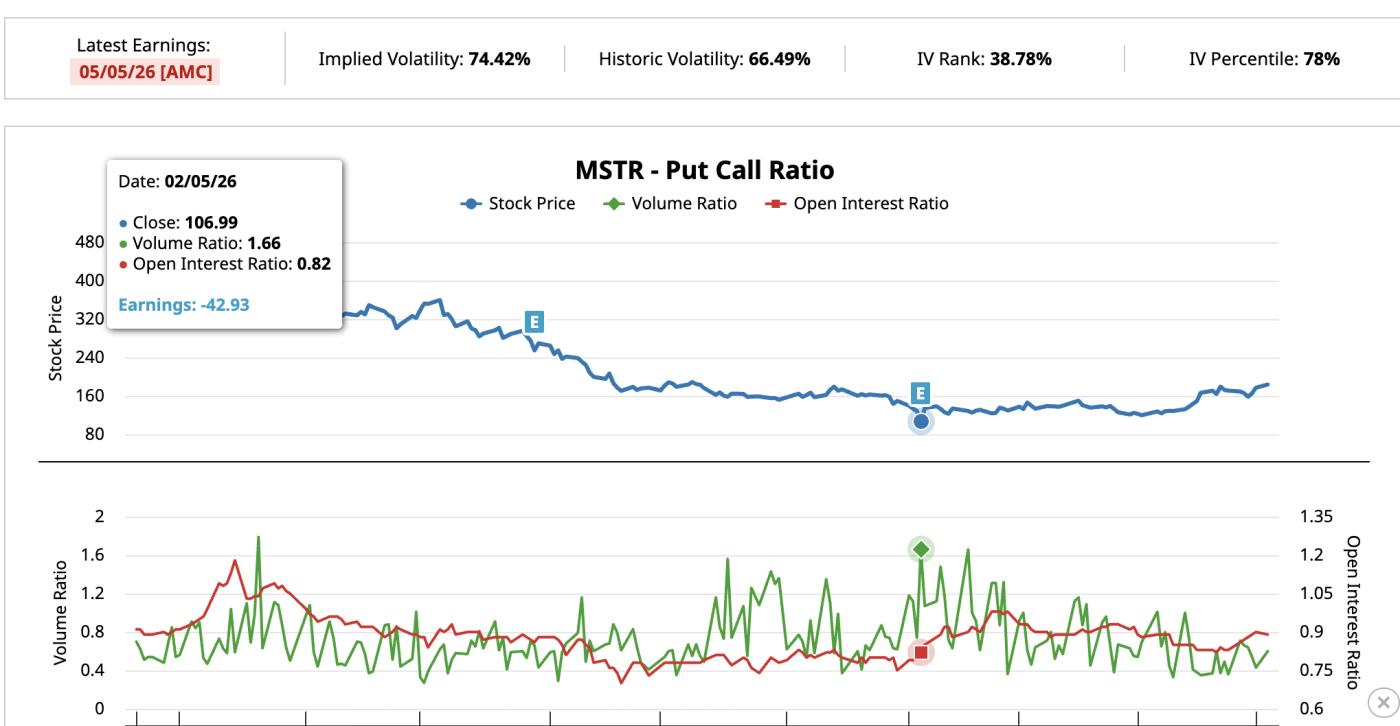
On February 5, when Strategy stock closed at $106.99 ahead of the Q4 print, the put-call volume ratio sat at 1.66. Traders were positioning for downside, and the Q4 announcement validated that defensive stance with a $42.93 EPS miss.
 Strategy Stock Put-Call Ratio Historical: Barchart
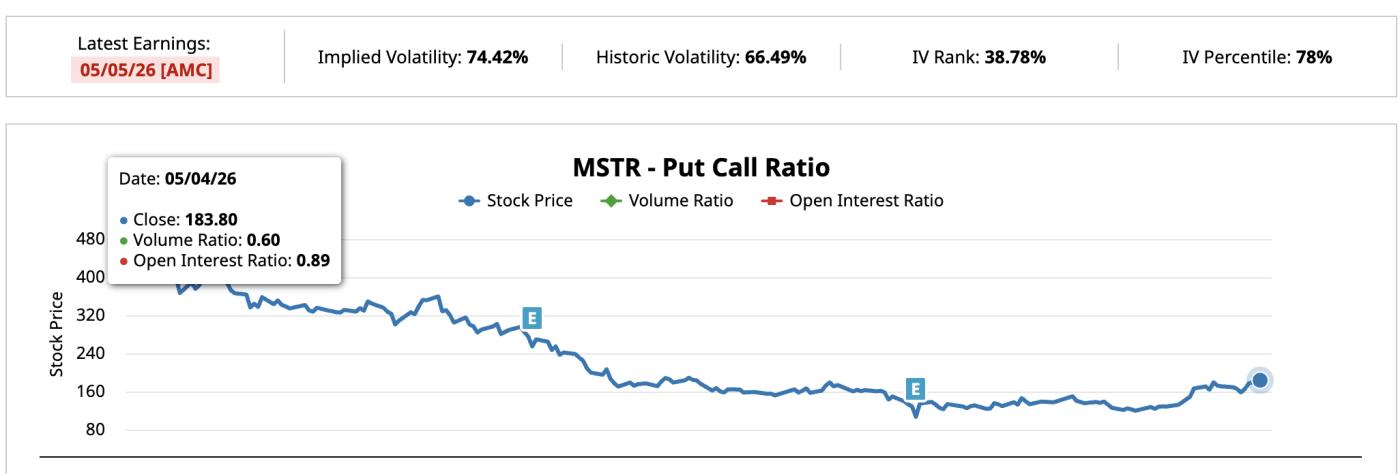
Heading into tonight’s print, the put-call volume ratio has collapsed to 0.60 with the stock at $183.80. The same options market that anticipated the Q4 disaster is now positioned for the Q1 reversal. A volume ratio at 0.60 reflects far more call buying than put buying, a clean shift from defensive to offensive.
 Strategy Stock Put-Call Ratio Present: Barchart
Options pricing has gotten expensive heading into the print, which signals that traders expect a sharp move in either direction. Implied volatility, a measure of how big a move options traders are betting on, sits at 74.42%.
Wall Street has been raising targets in lockstep. B. Riley raised its target from $188 to $200 on April 29 with a Buy reiteration. Cantor Fitzgerald raised its target from $192 to $212 on April 21 with a Buy reiteration.
 Stock Analyst Actions: TipRanks
The bull case rests on Bitcoin mark-to-market accounting. Strategy holds 818,334 BTC at an average cost of $75,537. With Bitcoin trading above $80,000, the unrealized gain sits near $3.7 billion. That gain reverses Q4’s mark-to-market loss directly through the Q1 earnings line.
But Michael Saylor paused Bitcoin purchases ahead of the print. The pause is unusual. Cash conservation, capital structure adjustments, or funding model strain are all possible reads. The options market and Wall Street say the rally is justified. Saylor’s pause says caution.
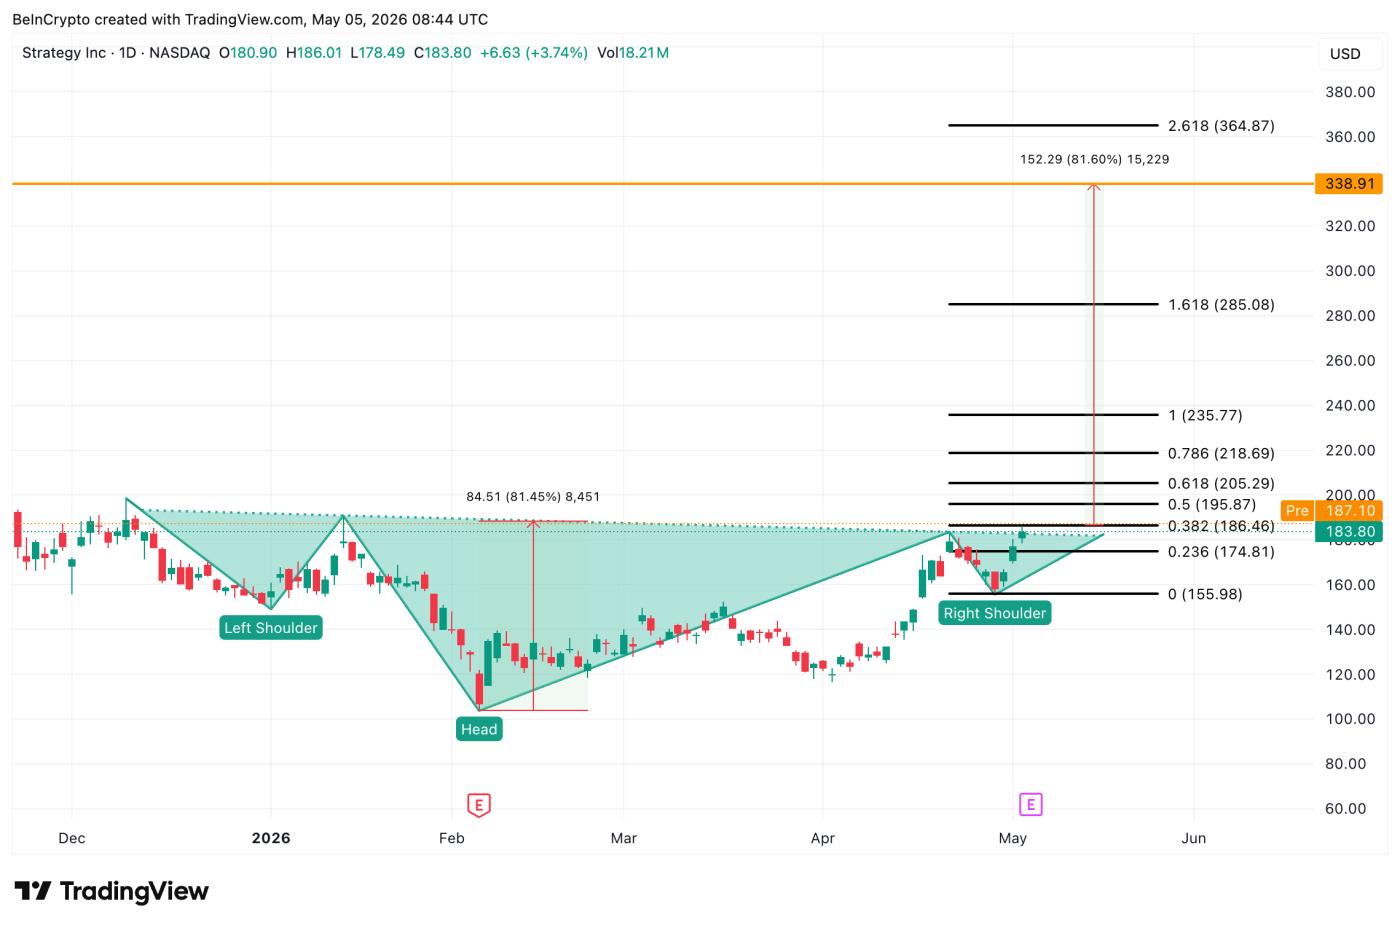
Strategy Stock Price Levels Define the Earnings Reaction
Strategy stock trades at $183.80, sitting at the neckline of the inverse head and shoulders pattern at $186.46. That neckline is the immediate test after tonight’s numbers.
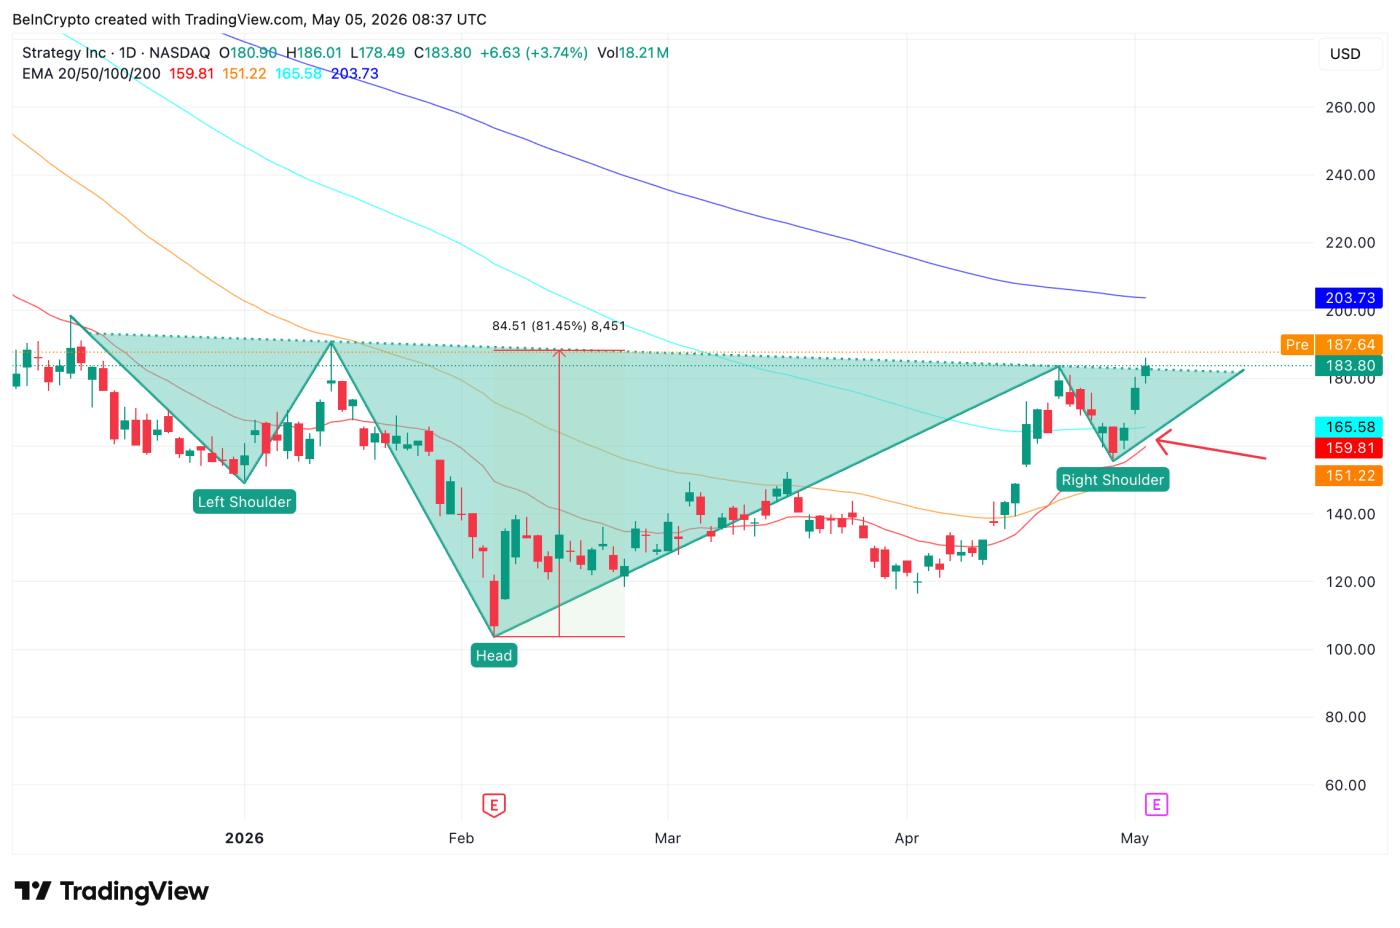
While the volume divergence discussed earlier puts the neckline theory at risk, the looming EMA (exponential moving average) crossover, adds the bullish angle. An Exponential Moving Average (EMA) is a type of moving average that gives more weight to recent prices. Right now, the 20-day EMA line is closing in on the 100-day EMA line. That bullish trigger can push the MSTR stock price above the 200-day EMA line.
 Key EMA Levels: TradingView
A clean break above the 200-day EMA exposes the 0.618 Fibonacci at $205.29, the 0.786 Fibonacci at $218.69, and the 1.0 Fibonacci at $235.77. At present the 0.786 Fib level is expected to offer the most resistance as it lies above the key analyst targets we just highlighted. The ultimate target, per pattern projection, sits at $338.91.
The downside levels show what failure looks like. A daily close below $186.46 invalidates the breakout attempt and pushes price back toward the 0.236 Fibonacci at $174.81.
 MSTR Price Analysis: TradingView
The level math is binary. A confirmed neckline break above $186.46 opens the path toward $218.69 over the coming weeks. A close below $174.81 cracks the pattern. Tonight’s print decides which path the chart takes, starting Wednesday.