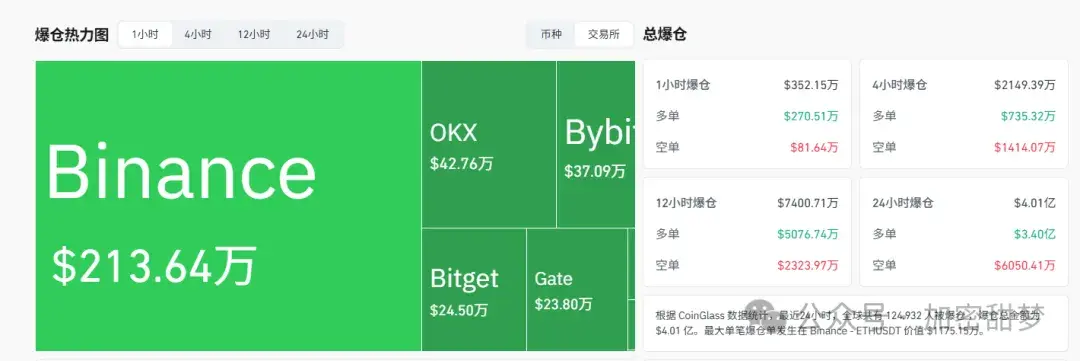
In the past 24 hours, a total of 124,988 people worldwide have been liquidated, with a total liquidation amount of $401 million. BTC and ETH seem to have fallen significantly, but they've actually reached our entry point for long positions and haven't broken through yet.
The bears are slightly stronger now, but it hasn't reached a complete breakdown and a large one-sided downtrend yet. So I will definitely look for opportunities to long near the key support level. If it doesn't break through during the day, those who are out of the market can continue to look for opportunities to go long on pullbacks. If the key level is broken and the price continues to fall with high volume, you can stop the loss directly!
BTC
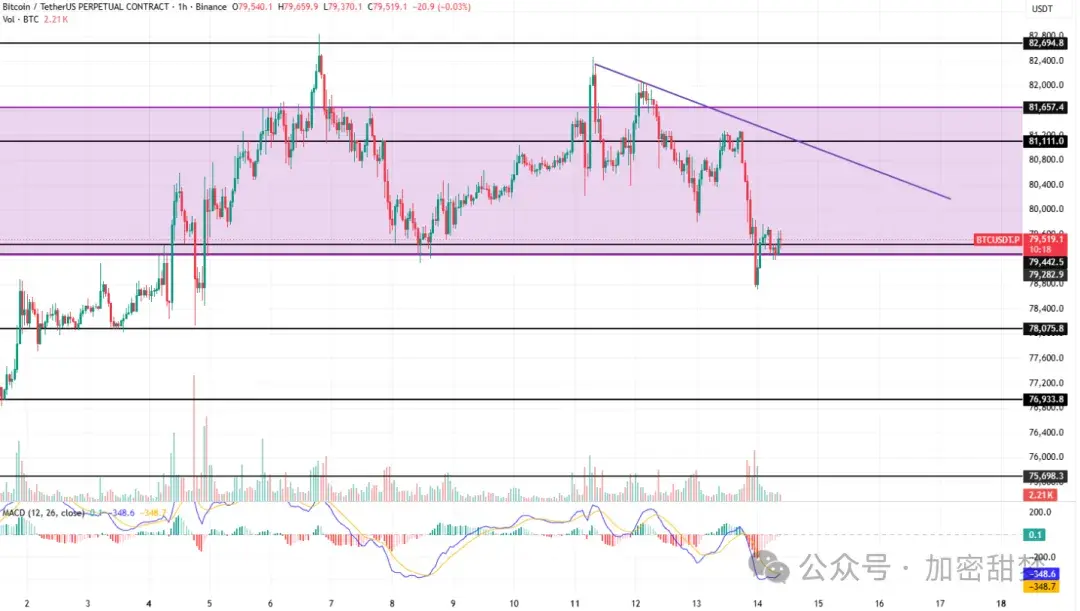
BTC closed with a bearish candlestick with upper and lower shadows this morning, indicating a back-and-forth struggle between bulls and bears. The daily chart shows three consecutive bearish days. After a dip to 7.87 last night, a rebound occurred, and it is currently consolidating around 7.94. The MACD shows signs of a golden cross below the zero line, and a bullish divergence has also been completed, suggesting a bullish trend.
(1) If the 79400 support level fails to hold, the next effective support level is at 78000. The last defensive position for long positions should be placed at 78000.
(2) If you have no position, you can long at market price, or long after the price falls below 79200 and pulls back to above 79200, with a stop loss at 78000 and targets around 81100 and 82000.
(3) Short at 81600, defend at 82600, target 80600 and 79400.
ETH
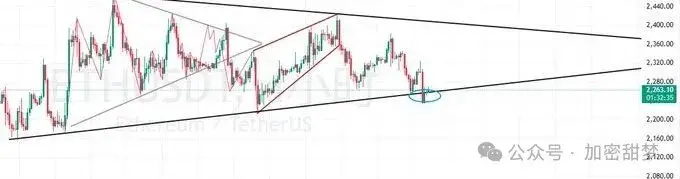
ETH broke below the 2250 support level, reaching a new low. The price is slightly firmer on a smaller timeframe, recovering after breaking below the lower edge of the large triangle pattern. Therefore, if this level holds, a short-term rebound is possible. Resistance levels: 2268-2300-2337; Support levels: 2250-2218-2175.
If ETH retraces to 2218 and confirms support, consider a long position with a stop-loss at 2175. If it holds above 2268 on the hourly chart, the target is 2300-2337.
Watch for a short position at 2346, with a stop-loss at 2383. Left-side buy order: 2158, stop-loss at 2120.
SOL
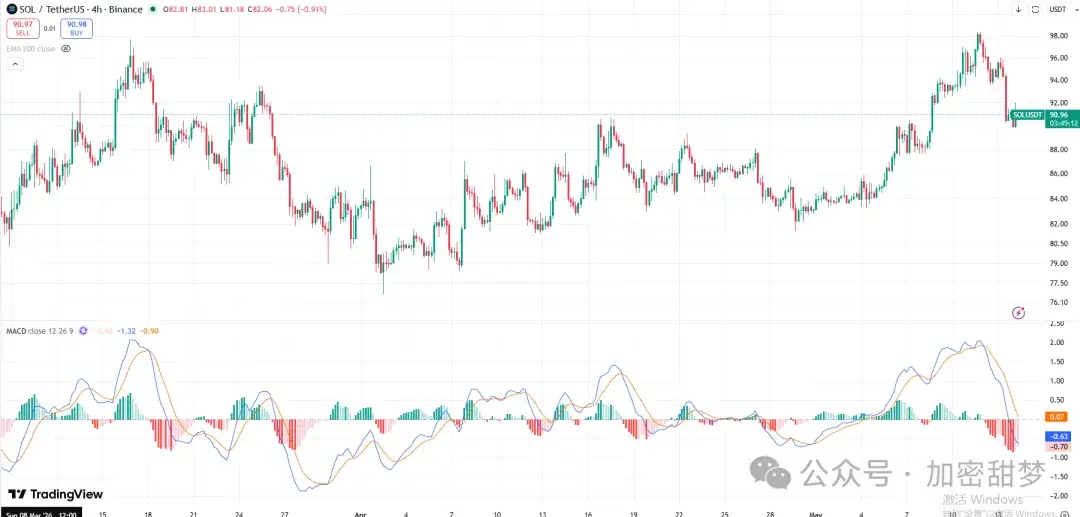
SOL retraced to 89.85, and the 0.50-0.618 retracement level is 89.85-87.26 (last night's retracement to 89.85 was exactly at the 0.50 level). Therefore, if it retraces to the 0.618 level, it will be the buy the dips point for SOL, and it will also be a second test to confirm that 87 has been firmly established.
STAR
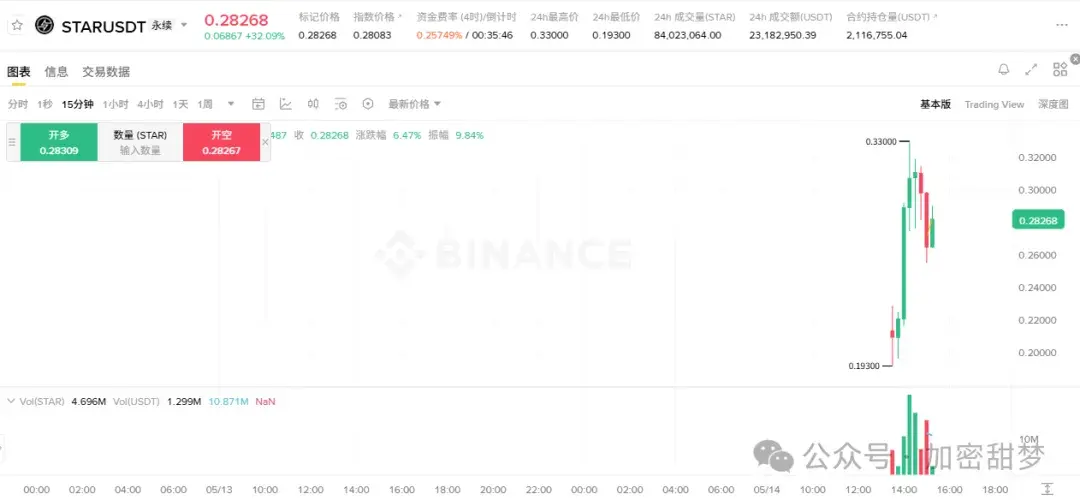
StarPower is a zero-sum game rugging project. Those who tried to profit from the initial drop likely lost a lot of money, and the project's operators subsequently disappeared. The price steadily declined, yet contracts were still available, suggesting nepotism . When StarPower rose, its market capitalization was only slightly over 100 million, which is within the normal range. I've already broken even and am considering collecting profits on a monthly basis.
1. Control over the supply. 2. Only Alpha has physical shares, making it easy to manipulate. 3. Strong contractual relationship after going to zero. 4. Acquiring a shell company has costs; it's impossible to short sell and dump shares aggressively, at least not now.
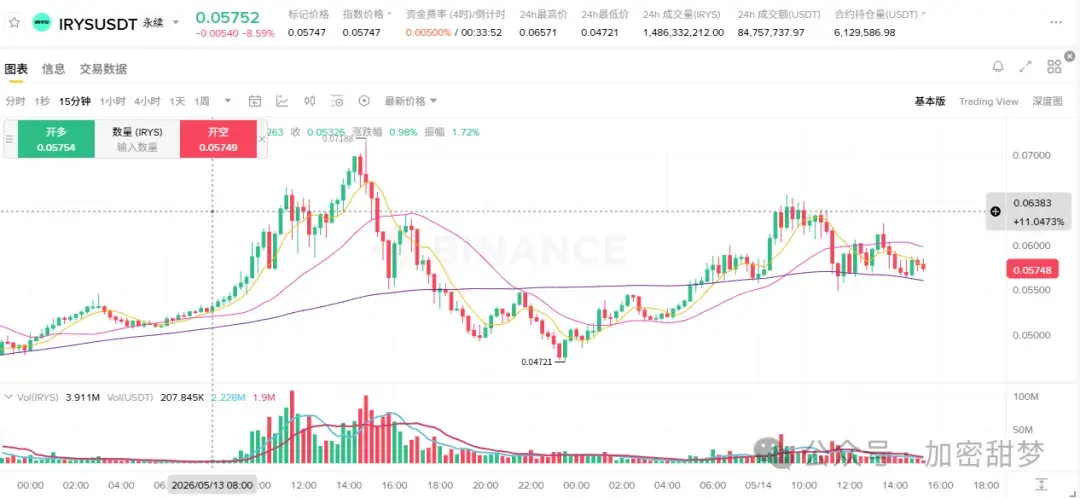
IRYS
It surged from 0.04 to 0.07188, but after a one-sided rally, the 4-hour chart showed a large bearish engulfing pattern, followed by a 13% drop today. It looks like a pullback, but it's actually distribution.
OI hit a new high, prices reversed, funding rate was only 0.0039%, retail investors turned to long positions and took the fall, active buying and selling volume surged and then shrank, the daily StochRSI has hit 100 and is extremely overbought, the 4-hour chart shows a long upper shadow and a large bearish engulfing pattern, the top reversal structure is very clean.
Entry (two-level limit short order): 1/3: 0.0640 - 0.0660, 2/3: 0.0680 - 0.0710, Stop Loss: 0.0742, Take Profit in stages: • TP1: 0.0556 • TP2: 0.0472 • TP3: 0.039
XNY