Author: Curry , Trend Research
Summary: SpaceX is scheduled to price its IPO after hours on June 11 and list on Nasdaq on June 12 under the ticker symbol SPCX. The offering price is $135, valuing the company at approximately $1.75 trillion and raising $75 billion, making it the largest IPO in history.
However, historical data from Motley Fool's analysis of 30 prominent tech IPOs shows that the median returns over the first 6 and 12 months after listing were both -9%, and the median maximum drawdown in the first year was 54%, with none escaping this fate. Morningstar's fair valuation is only about $780 billion, less than half of the offering price.
This Friday (June 12), SpaceX will list on Nasdaq under the ticker symbol SPCX. According to a Reuters report on June 3, the offering price is set at $135 per share, with approximately 556 million shares issued, raising $75 billion and valuing the company at approximately $1.75 trillion (some sources estimate $1.77 trillion based on the post-IPO share capital). Regardless of the valuation method, this is the largest IPO in stock market history. The underwriting syndicate, led by Goldman Sachs, comprises 21 investment banks. The final pricing will be determined after the US stock market closes on June 11.
The hype is undeniable. SpaceX stated in its S-1 filing that it has "identified the largest executable total target market in human history," quantifying it at $28.5 trillion. The retail allocation is set at 30% of the outstanding shares, roughly three times the typical level for large IPOs.
The problem is that for ordinary investors who rush in on the opening day, historical data presents a rather unfavorable picture.
Median Ledger: Small profits in the first three months, then collective losses after six months
In an article published on June 9, Motley Fool analyst Ryan Vanzo compiled statistics on the post-IPO performance of 30 prominent tech companies since 2012, with the sample ranging from Facebook and Twitter to Coinbase, Robinhood, Rivian, Arm, and CoreWeave.
The shape of the median curve is very telling: the median return after one week of listing is +3%, after one month +1%, and after three months +4%, which is still acceptable. However, extending the timeframe to 6 months, the median drops to -9%; and after 12 months, it remains -9%. The percentage of companies recording positive returns also collapses simultaneously, remaining at 57% in the first three months, but falling to 43% in both the 6-month and 12-month periods. In other words, if you hold the stock for a full year, most people who chased the highs will lose money.
The divergence at the individual stock level is extreme. CoreWeave surged 300% in three months after its IPO, Palantir rose 164% in three months, and Zoom rose 142% in 12 months. However, there are also numerous negative examples: Lyft fell 65% in 12 months, Robinhood fell 74%, Rivian fell 67%, and Coupang fell 65%. There is no stable relationship between the star power and the returns after an IPO.
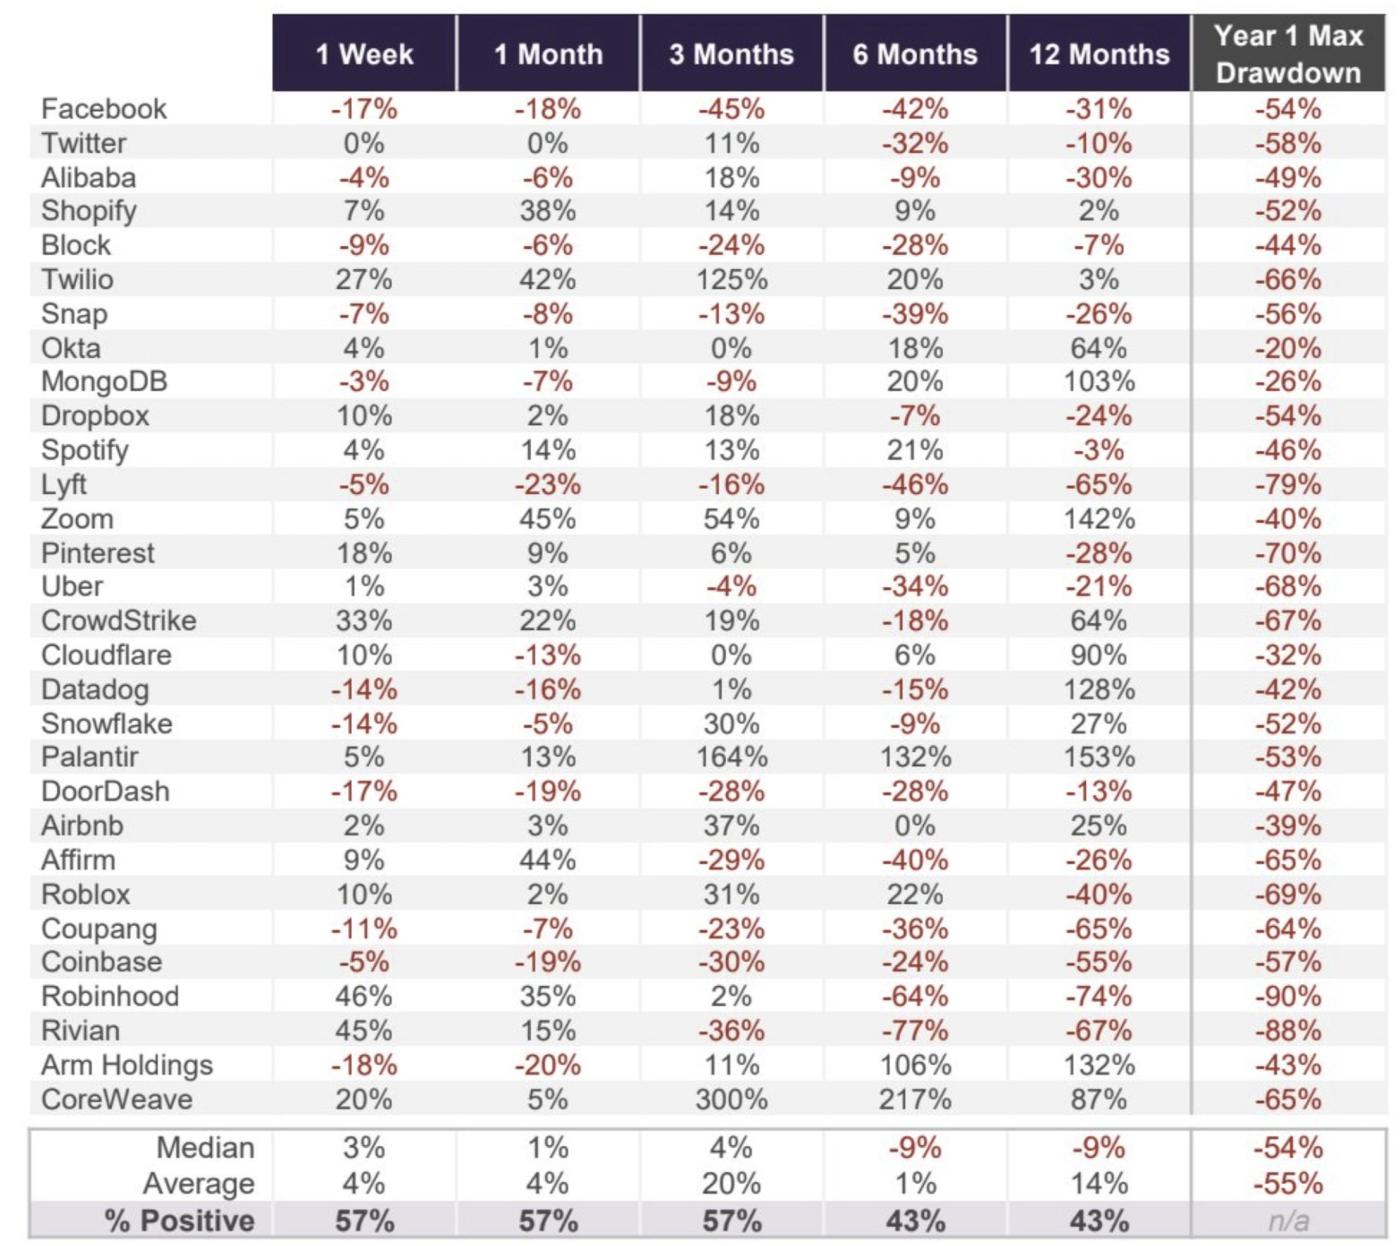
The median maximum drawdown in the first year was 54%, with Robinhood and Coinbase both falling by more than half.
Even more striking than the returns are the drawdown data. The median maximum drawdown for the 30 companies in their first year of listing was 54%, with an average of 55%. Even Okta, which had the smallest decline, experienced a 20% drawdown; none of them escaped the impact.
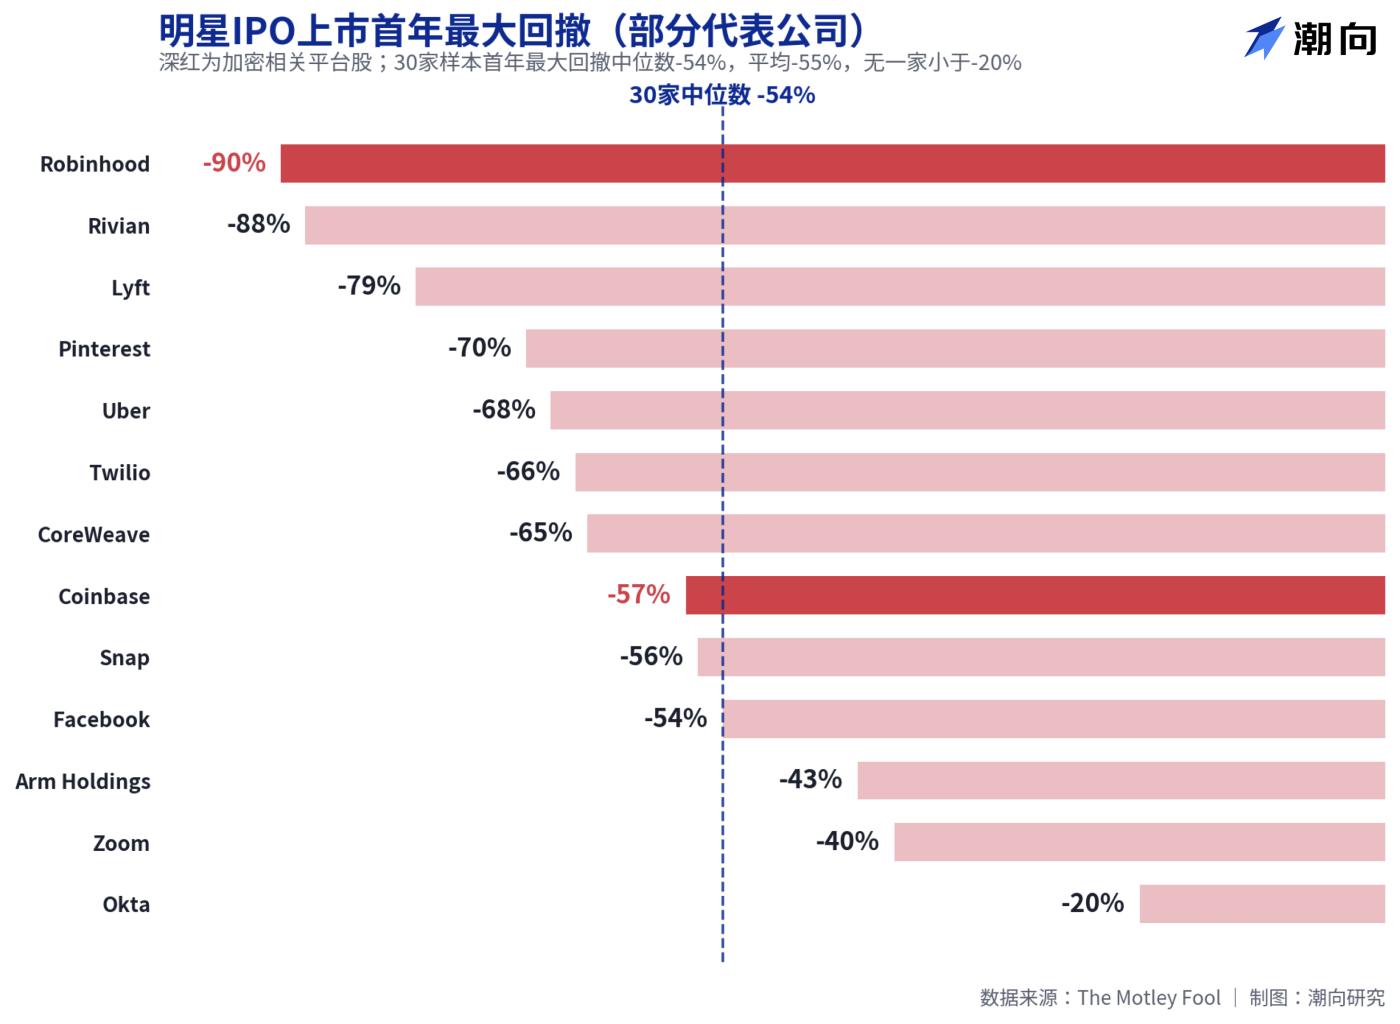
Two platforms familiar to crypto users were among the hardest hit. Robinhood experienced a 90% drawdown in its first year after IPO, the highest among the 30 companies; Coinbase saw a 57% drawdown. Even companies that later proved to be top performers were not immune: CoreWeave saw a 65% drawdown in its first year, Palantir a 53% drawdown, and Meta (then Facebook) a 54% drawdown. This data points to a simple conclusion: even if you choose the right company, buying at the opening price will likely result in a near-halving of your investment.
Academic research paints a similar picture. Jay Ritter, director of the IPO research program at the University of Florida, tracked 1,479 IPOs from 2012 to 2021. The average first-day return was a high 23.6%, but the average total return over the following three years was only 10.6%. The Wall Street Journal, citing Ritter's data, reported that investors who bought on the first day of trading and held for three years saw returns approximately 21% lower than those who directly bought a market capitalization-weighted index. The initial excitement essentially priced in subsequent gains.
SpaceX's financial statements: $18.7 billion in revenue supports a $1.75 trillion valuation.
Returning to SpaceX itself, the valuation controversy is more concrete than historical patterns.
According to financial data cited by The Motley Fool, SpaceX's revenue in 2025 was $18.7 billion, a year-on-year increase of 33%, but its net loss was $4.9 billion, reversing the profit of approximately $790 million in 2024. According to S-1 data compiled by BitMEX, the net loss in the first quarter of 2026 reached $4.28 billion, with cumulative losses totaling $41.3 billion, of which the AI business (after the merger with xAI) burned through approximately $2.5 billion per quarter. Based on a valuation of $1.75 trillion, the price-to-sales ratio exceeds 90 times.
Morningstar's stance was the most direct. Their analysts stated that SpaceX was "significantly overvalued," believing that long-term investors would have the opportunity to buy in with a better margin of safety after the IPO, and setting a fair valuation of approximately $780 billion, less than half of the offering valuation. For reference, the off-market takeover bid for SpaceX in December 2025 valued it at approximately $800 billion; within six months, the price more than doubled.
The bullish logic also holds true. A rocket launch business accounting for over 80% of the US market share, and Starlink boasting over 12 million subscribers and already profitable, form the basis of this valuation. Vanzo's own assessment is that SpaceX will likely perform well on its first day of trading, but considering its valuation level and historical data, a struggle in its stock price over the next 12 months would not be surprising.
For those planning to place orders on Friday, the data from these 30 companies is at least worth a look: history doesn't guarantee a repeat, but a 50% drop in the first year has been the norm for this game over the past fourteen years.