The expansion has led to a divergence between volume and price, with institutional financial institutions continuing to accelerate their entry into the market.
Written by: Token Terminal
Compiled by: Saoirse, Foresight News
Ethereum is the core underlying settlement network for on-chain assets, relying on ETH for transaction fee payments and staking to maintain network security. Traditional finance suffers from pain points such as slow settlement, multiple intermediaries, and high counterparty risk, while tokenized assets and stablecoins offer on-chain solutions. From 2025 to 2026, relevant regulations will gradually mature, and institutions will be ready to implement on-chain business strategies.
Various stablecoins, tokenized funds, commodities, and on-chain stocks are all issued and settled on Ethereum. After transactions are diverted through the Layer 2 network, they ultimately return to Layer 1 for confirmation, allowing ETH to continuously accumulate value. By market capitalization, Ethereum remains the world's largest platform for tokenized assets, jointly operated by the Ethereum Foundation and the developer community. Teams like Etherealize specifically connect with traditional financial institutions to facilitate institutional investment. The Ethereum ecosystem exhibited a polarized trend in the first quarter of 2026, which will be analyzed in detail below using complete data from Token Terminal.
The market in the first quarter of 2026 presented a starkly contrasting picture: on-chain usage reached a record high—monthly active users, total transaction volume, and throughput all broke records; however, the size of assets denominated in USD and transaction fees contracted simultaneously, with total diluted market capitalization, total locked assets, transaction volume, and both types of transaction fees all declining sequentially. Key events in this quarter profoundly shaped this unique market situation:
In January, the second round of the Fusaka upgrade cycle, specifically the Blob parameter fork (BPO#2), was implemented, significantly improving data storage capacity.
In February, the ERC-8004 standard was launched on the mainnet, becoming a universal specification for AI agent identity and credit rating;
The Ethereum Foundation has identified three core goals for the 2026 protocol: scaling, improving user experience, and strengthening the underlying security layer.
The Ethereum Forum for Institutions, held in March, saw a significant increase in participation from traditional financial institutions.
Overview of key indicators for the first quarter of 2026
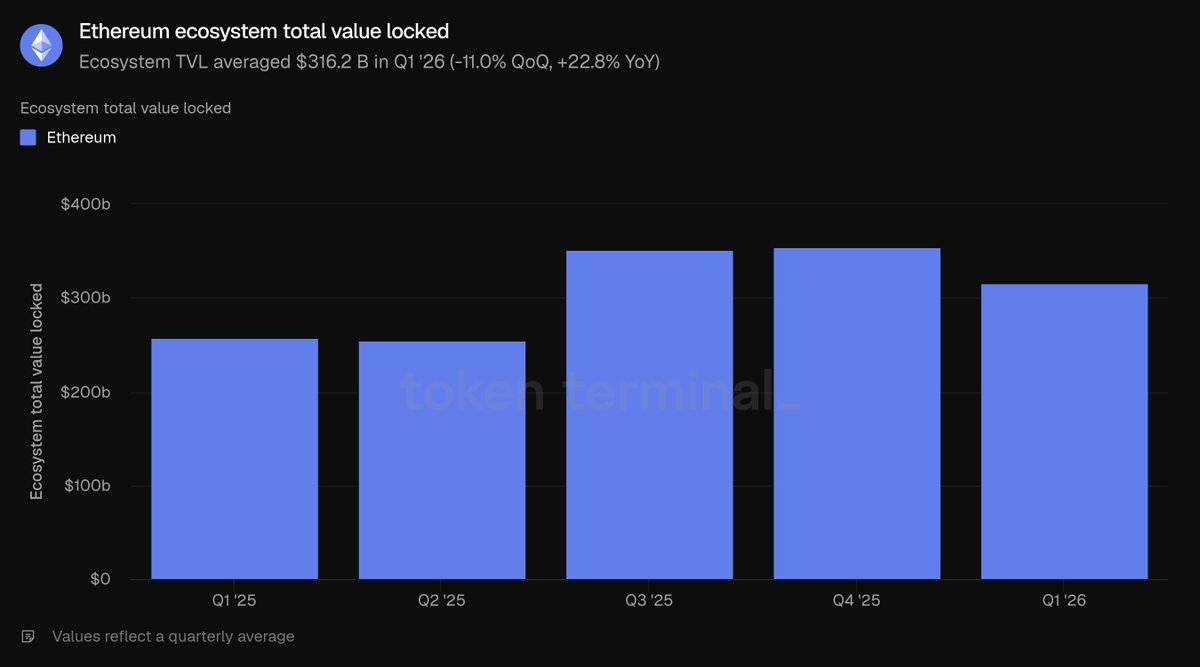
Total locked assets in the ecosystem: US$316.2 billion (down 11.0% QoQ, up 22.8% YoY)
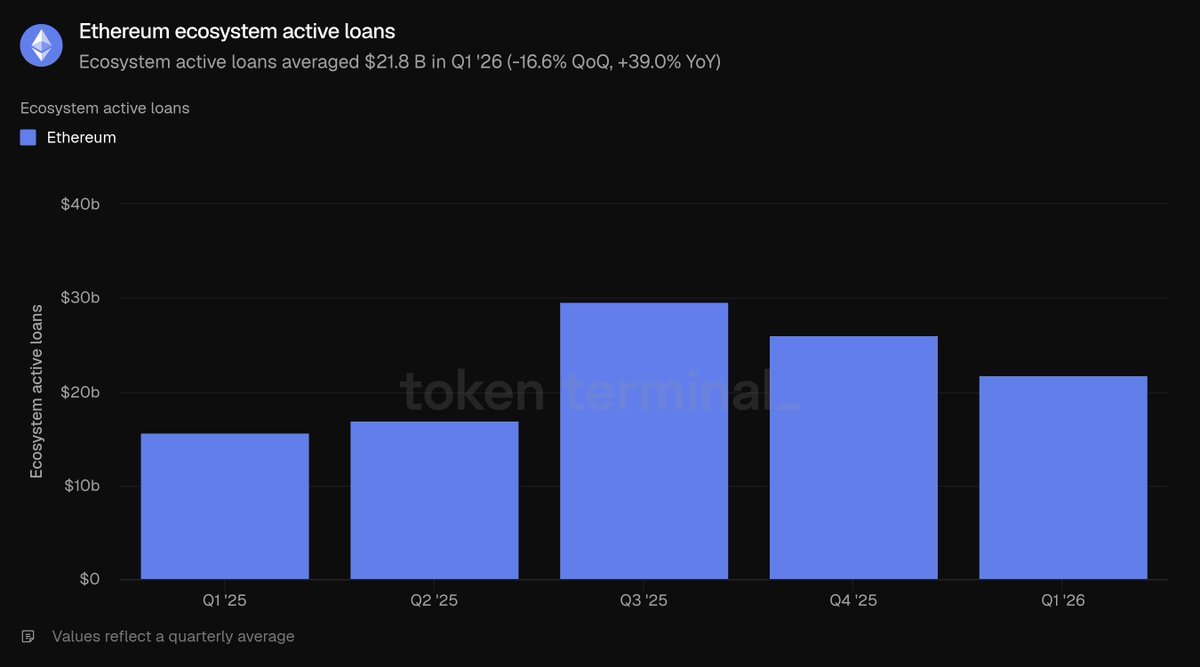
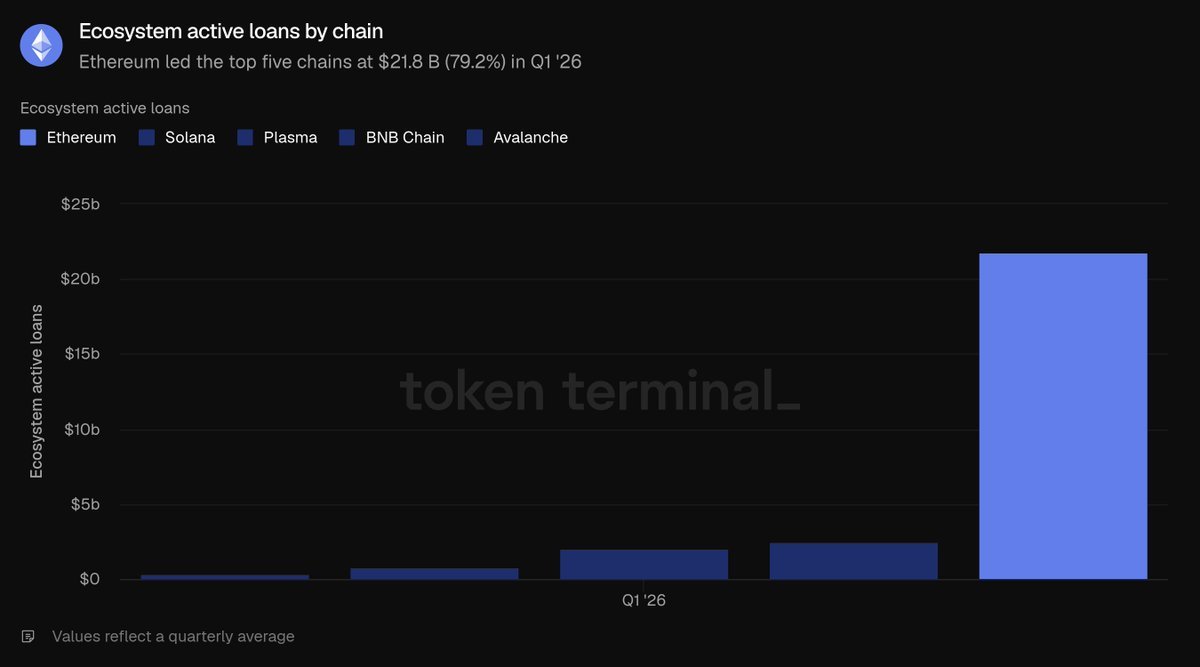
Outstanding active lending within the ecosystem: $21.8 billion (down 16.6% QoQ, up 39.0% YoY)
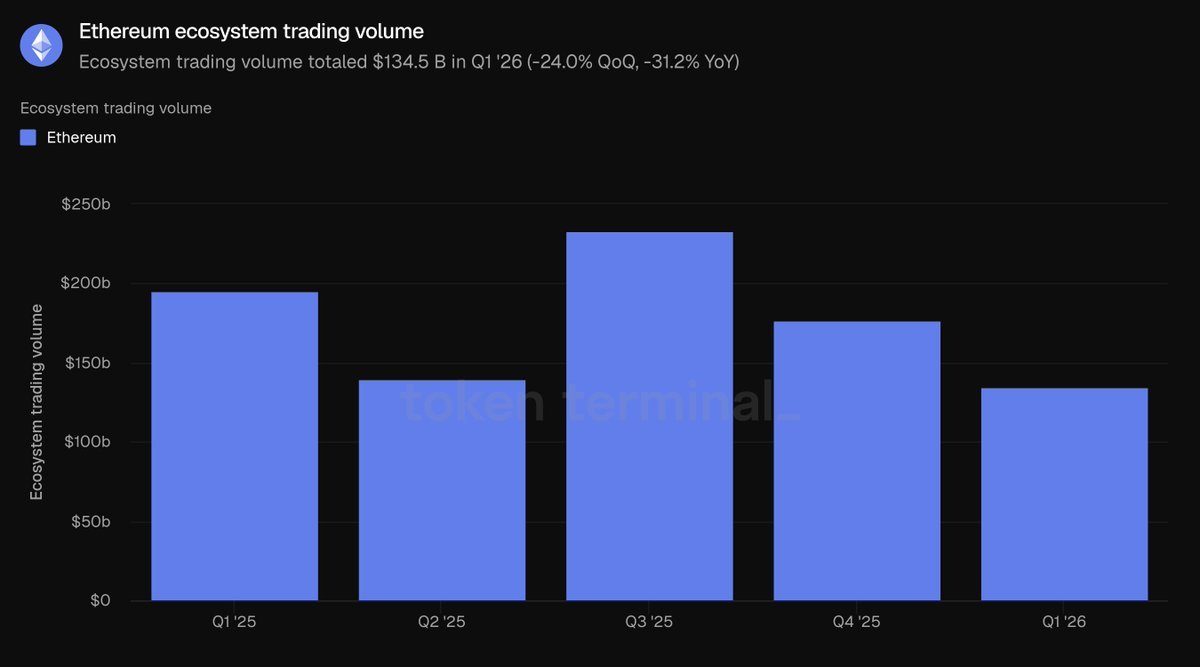
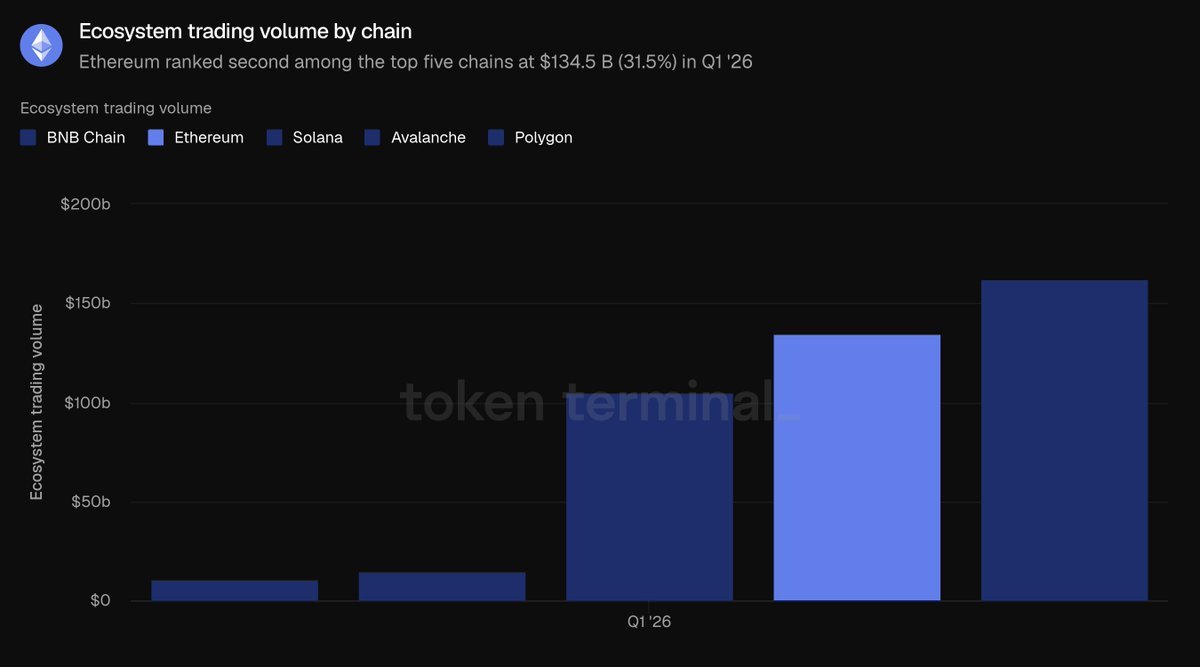
Total trading volume of decentralized exchanges in the ecosystem: $134.5 billion (down 24.0% month-over-month, down 31.2% year-over-year).
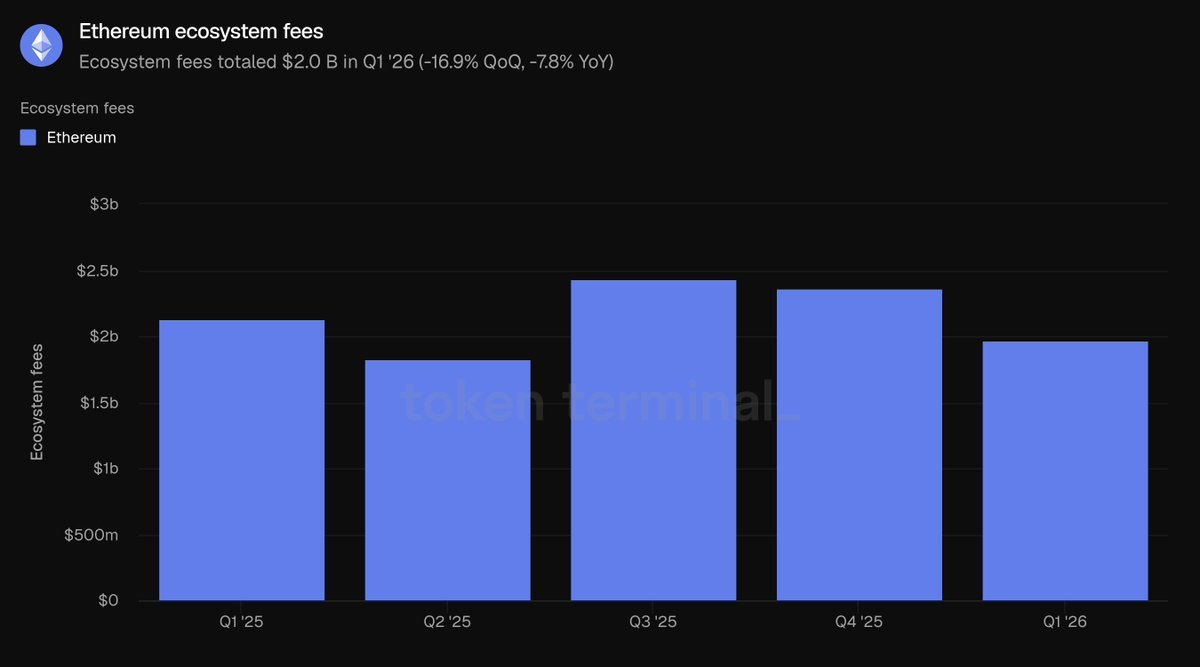
Total transaction fee revenue across the entire ecosystem: $2 billion (down 16.9% quarter-over-quarter, down 7.8% year-over-year).
Total market capitalization of on-chain tokenized assets: $203.4 billion (down 0.7% month-over-month, up 42.9% year-over-year).
Stablecoins: $178.9 billion (down 2.3% month-over-month, up 37.6% year-over-year)
Tokenization Fund: $19.4 billion (up 4.9% QoQ, up 73.1% YoY)
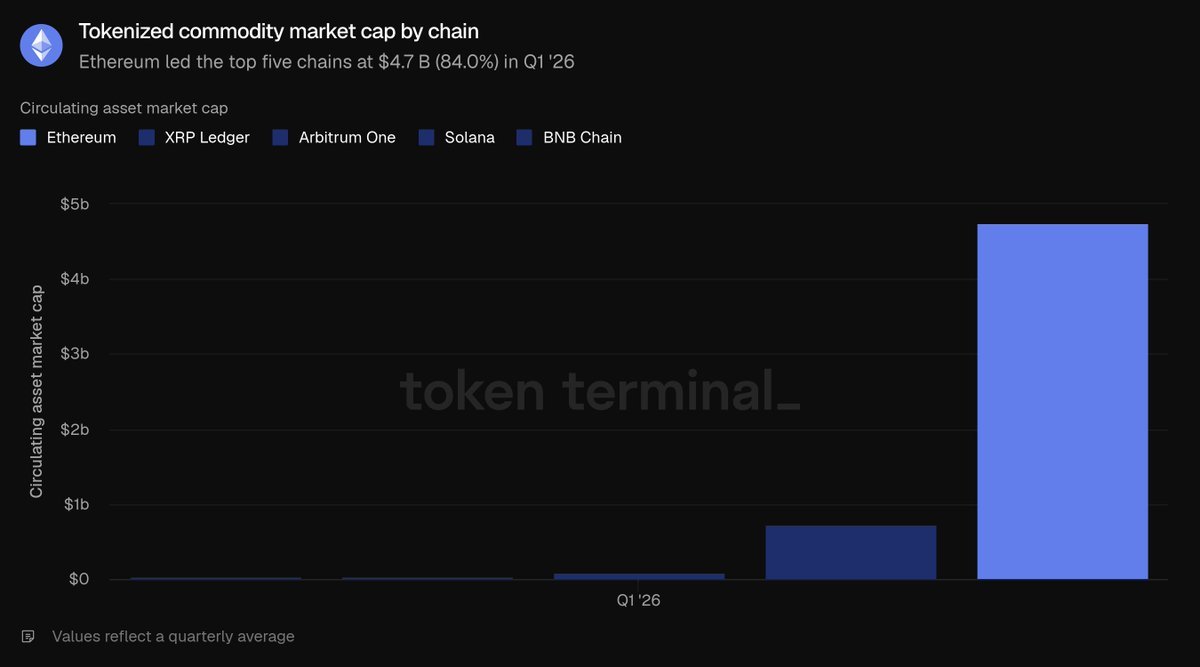
Tokenized commodities: $4.7 billion (up 60.0% QoQ, up 325.9% YoY)
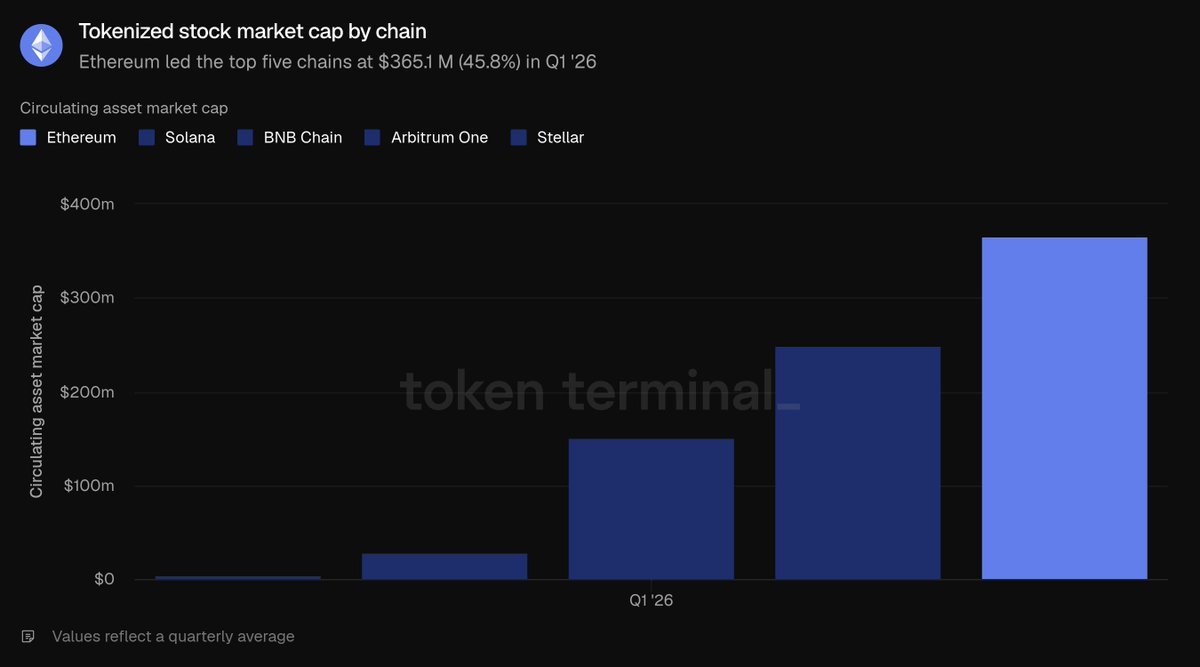
Tokenized shares: $365.1 million (up 16.5% quarter-over-quarter)
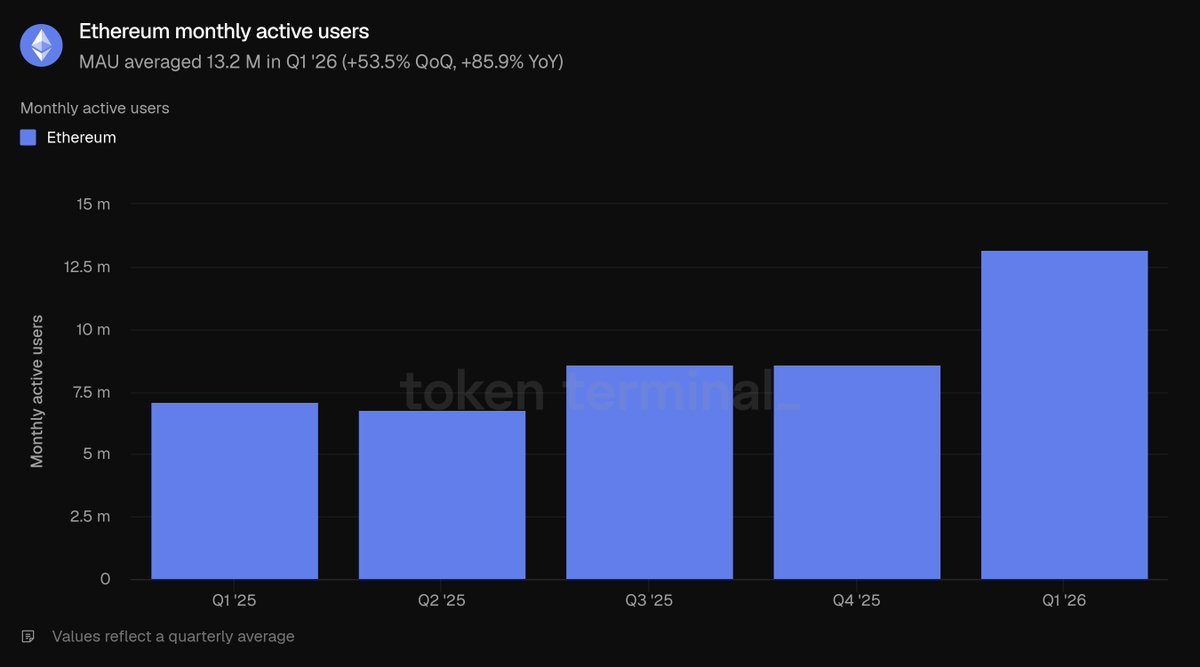
Monthly active user addresses: 13.2 million (up 53.5% month-over-month, up 85.9% year-over-year)
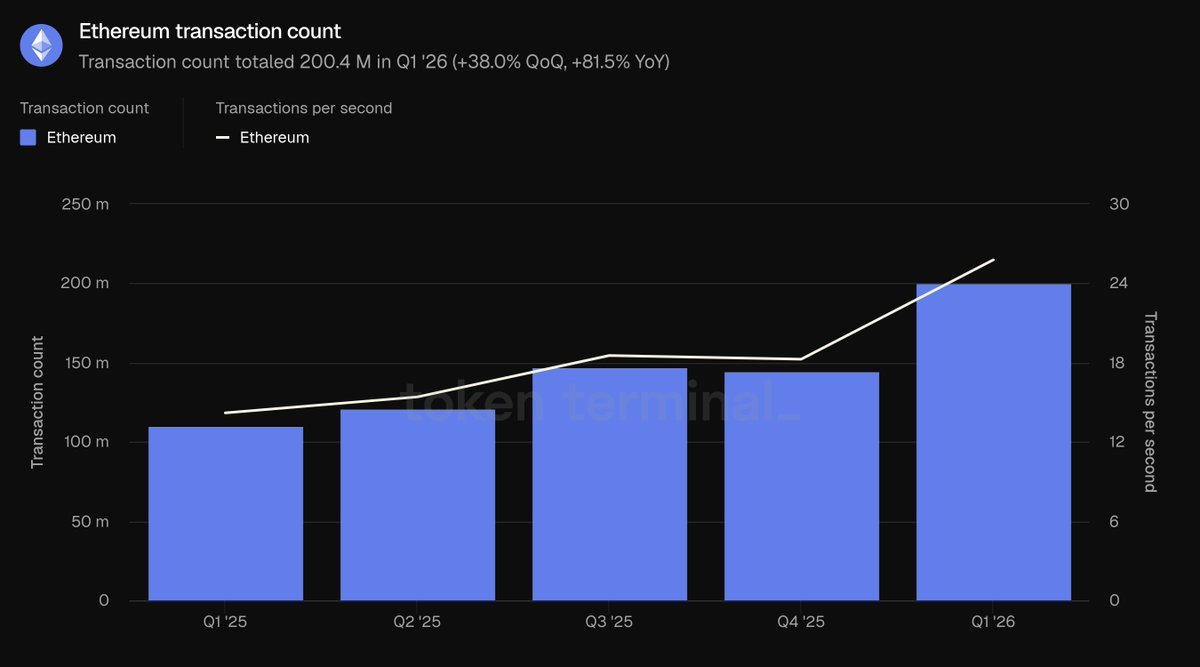
Total transactions on the first floor: 200.4 million (up 38.0% month-over-month, up 81.5% year-over-year)
Average transaction processing volume per second: 25.78 transactions (up 41.2% month-over-month, up 81.7% year-over-year)
Total transaction fee revenue on the Tier Mainnet: US$39.9 million (down 47.9% quarter-over-quarter, down 81.9% year-over-year).
Ethereum's fully diluted market capitalization: $290 billion (down 30.3% month-over-month, down 9.9% year-over-year).
ETH staking ratio: 0.31 (up 0.03 both month-over-month and year-over-year).
Total number of ETH holding addresses: 292.8 million (up 8.1% month-over-month, up 24.9% year-over-year)
Note: This report's statistics only include the Ethereum Layer 1 mainnet. Layer 2 networks are considered independent public chains, and their data is not included in the Ethereum statistics.
Overall ecological development
Total locked assets refer to the total USD value of assets deposited in various on-chain applications, serving as a leading indicator for revenue-generating businesses such as lending, trading, and staking. This section summarizes the on-chain funds available for withdrawal by users across the entire Ethereum ecosystem. In Q1 2026, the average total locked assets in the Ethereum ecosystem reached $316.2 billion, a decrease of 11.0% quarter-over-quarter and an increase of 22.8% year-over-year. The quarter-over-quarter decrease was due to the overall price correction in crypto assets, while the significant year-over-year increase demonstrates substantial expansion of the ecosystem compared to the same period last year.
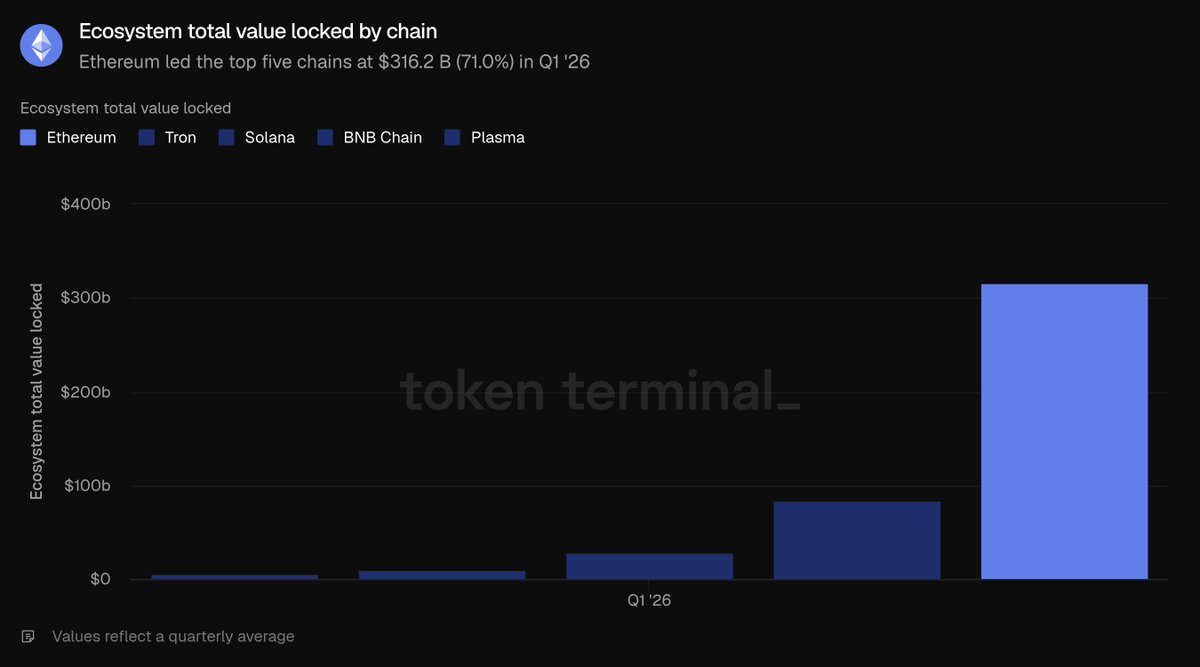
Among the five leading public blockchains, Ethereum leads by a wide margin in total value locked (TVL): $316.2 billion, far exceeding the combined TVL of Tron ($84.5 billion), Solana ($28.8 billion), BNB Chain ($10.3 billion), and Plasma ($5.7 billion), accounting for 71% of the total TVL of the five blockchains. Funds are mainly concentrated in two sectors: the liquidity staking sector led by Lido, and the lending sector centered around Aave; EigenLayer, ether.fi restaking protocols, and Ethena and Sky synthetic USD stablecoin platforms also account for a significant amount of funds. This high concentration of funds is Ethereum's most prominent structural advantage.
The active lending metric represents the scale of deposits lent out by users and generating interest income, directly reflecting lending business revenue. This section shows the total outstanding loans across all Ethereum lending applications. The average active lending scale in the ecosystem in Q1 was $21.8 billion, a decrease of 16.6% quarter-over-quarter and an increase of 39.0% year-over-year. The outstanding loan balance contracted in tandem with the total locked value, reflecting a cooling of overall market risk appetite, but the scale is still significantly higher than the same period last year.
The Ethereum lending market is concentrated in a few liquidity pools, with Aave dominating: its active lending volume at the end of the quarter was approximately $13.5 billion, accounting for the vast majority of the ecosystem's share; followed by Morpho ($1.9 billion), Sky's Spark ($1 billion), and Maple ($840 million). The contraction in lending volume this quarter was mainly driven by Aave, as the decline in crypto asset prices led to a cooling of lending demand, resulting in a decrease of approximately 24% in its total lending volume. Comparing the five major public chains, Ethereum's $21.8 billion in active lending significantly outpaces Solana ($2.5 billion), Plasma ($2.1 billion), BNB Chain ($760.8 million), and Avalanche ($392.4 million), accounting for 79.2% of the total lending volume across the five public chains, making it the segment with the highest Ethereum share in this market.
Decentralized exchange (DEX) trading volume refers to the total transaction value completed on-chain spot exchanges. Traders pay transaction fees, and trading volume is highly correlated with platform revenue. This data summarizes trading across the entire Ethereum ecosystem's DEXs. In Q1, the total ecosystem trading volume was $134.5 billion, a 24% decrease quarter-over-quarter and a 31.2% decrease year-over-year. The decline in trading volume exceeded the decrease in locked assets, confirming a significant reduction in market risk appetite during this quarter's asset downturn.
Ethereum DEX trading volume is highly concentrated on leading platforms: Uniswap's Q1 trading volume was approximately $85.5 billion, accounting for two-thirds of the ecosystem's total; followed by Curve ($22.1 billion) and CoW Swap ($12.4 billion). Trading volume is the only metric for Ethereum that hasn't topped the list of the five major public chains: BNB's total trading volume of $162.5 billion surpasses Ethereum's $134.5 billion, with Solana following closely ($104.9 billion), while Avalanche ($14.5 billion) and Polygon ($10.7 billion) rank lower. Ethereum's trading volume accounts for 31.5% of the total trading volume of the five major chains, second only to BNB's 38%.
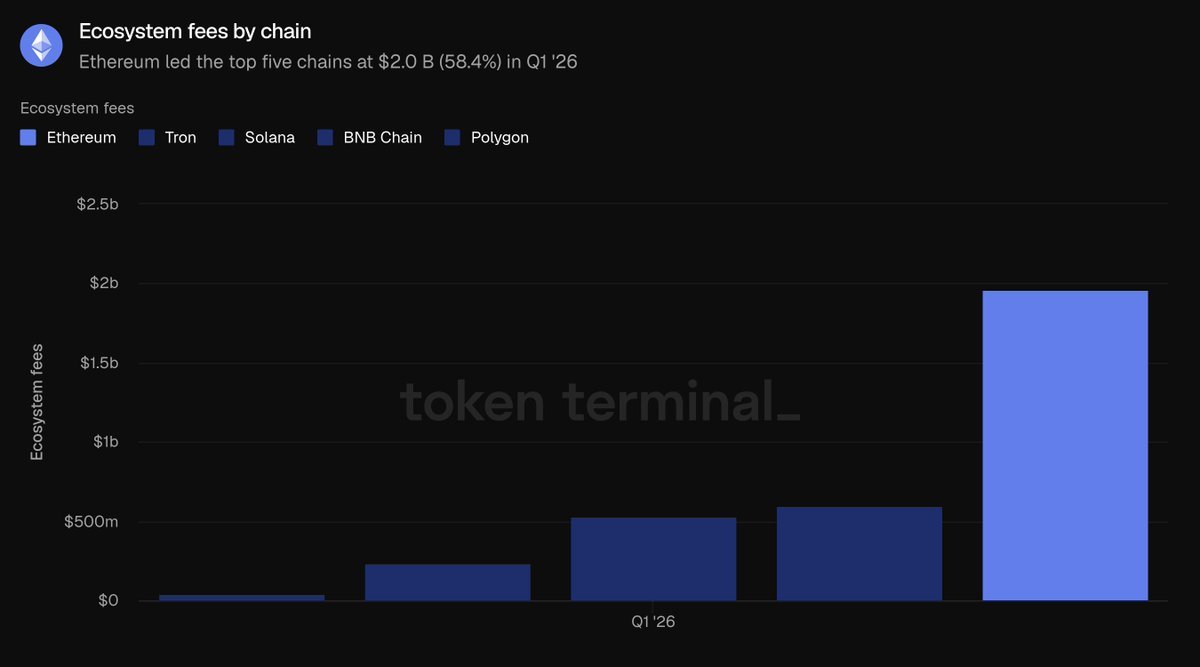
Ecosystem fees refer to all fees incurred by users when using various applications, including borrower interest and trader transaction fees. They directly reflect the economic value created by the ecosystem and are the total fees collected from all Ethereum applications. In the first quarter, total ecosystem fees amounted to $2 billion, a decrease of 16.9% quarter-over-quarter and 7.8% year-over-year, declining in tandem with lower trading and lending activity.
Ethereum's $2 billion in ecosystem transaction fees far surpasses Tron ($599.3 million), Solana ($532.5 million), BNB Chain ($231.9 million), and Polygon ($38.8 million), accounting for 58.4% of the total transaction fees of the five major public chains. Even with a decline in data this quarter, Ethereum remains the largest source of transaction fees for industry applications. Looking at all indicators in this sector: Ethereum leads the industry across all three metrics—locked funds, lending scale, and ecosystem transaction fees—with only DEX trading volume lagging behind BNB Chain.
Tokenized Assets Sector
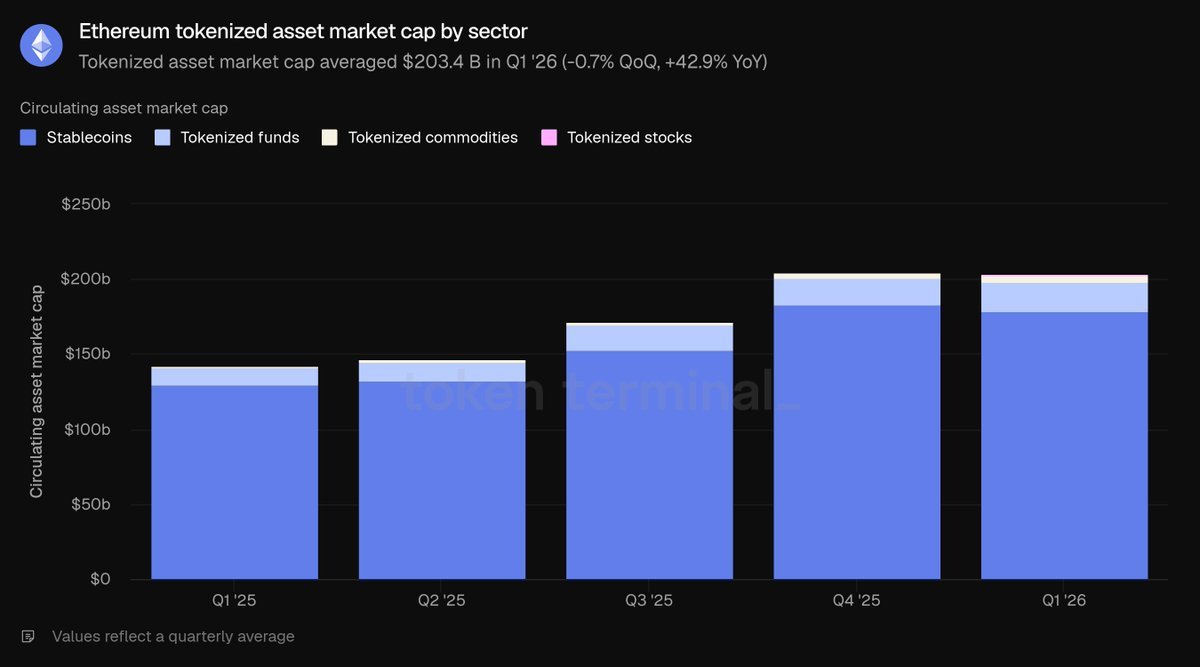
The total market capitalization of circulating assets refers to the total value of tokenized assets on the blockchain, calculated by multiplying the circulating supply by the closing price on the day. Stablecoins are calculated based on the total circulating supply, tokenized funds on the scale of assets under management on the blockchain, and tokenized stocks on the total value of shares issued on the blockchain. This section only counts Ethereum-issued assets.
In the first quarter, the average total market capitalization of Ethereum tokenized assets was $203.4 billion, basically flat quarter-on-quarter (down only 0.7%), but a significant year-on-year increase of 42.9%. Stablecoins accounted for 87.9% of the total market capitalization, with the remaining share divided among token funds, commodities, and stocks.
Stablecoins
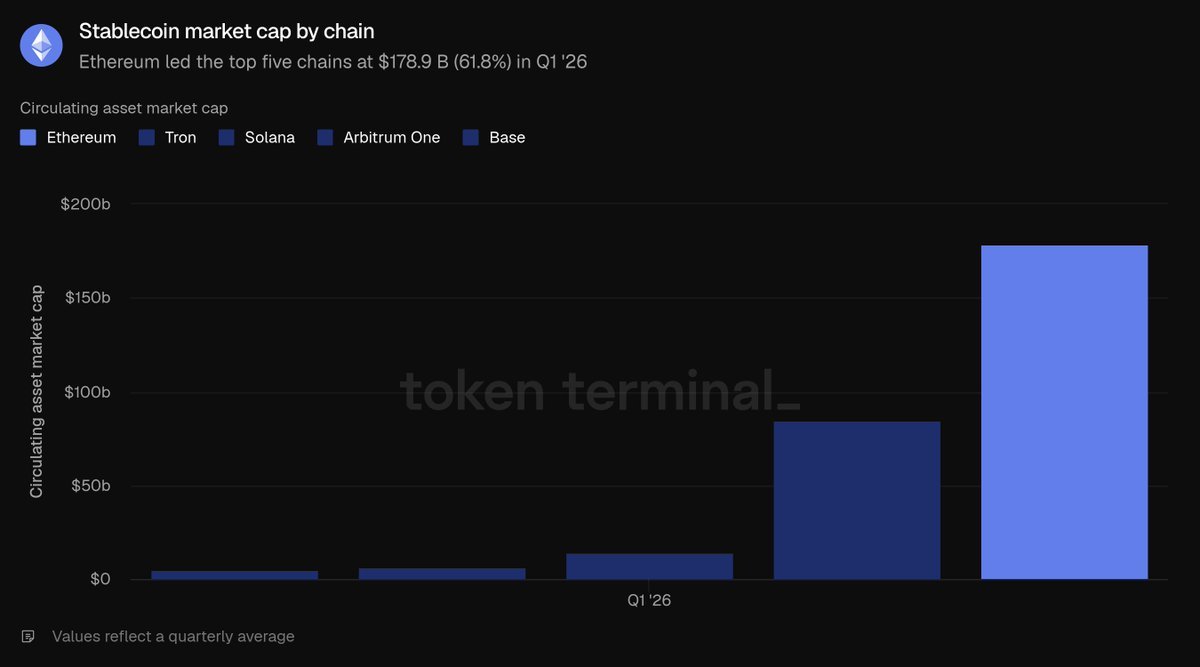
In the first quarter, the average size of Ethereum stablecoins was $178.9 billion, a slight decrease of 2.3% quarter-on-quarter but an increase of 37.6% year-on-year, making it the only category in the tokenization sub-sector to shrink quarter-on-quarter. The market is dominated by two major issuers: Tether USDT ($94.1 billion) and Circle USDC ($54.5 billion) together accounted for the vast majority of Ethereum stablecoin market capitalization at the end of the quarter; other leading products included Sky USDS ($12.4 billion), Ethena USDe ($5.9 billion), and PayPal PYUSD ($2.9 billion); new compliant stablecoins such as Ripple's compliant stablecoin RLUSD ($1.1 billion) have also been launched. Comparing the five major public chains, Ethereum's $178.9 billion stablecoin size leads Tron ($84.5 billion), Solana ($14.5 billion), Arbitrum One ($6.8 billion), and Base ($4.7 billion), accounting for 61.8% of the total stablecoin market capitalization across these five chains.
Tokenization Fund
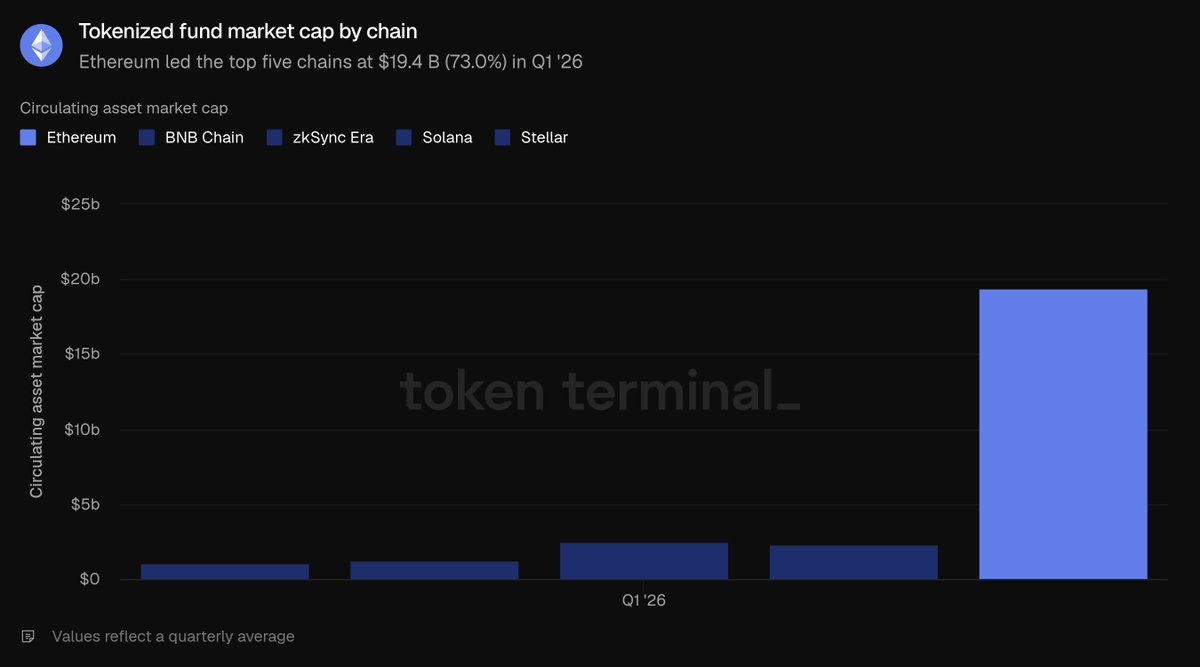
In the first quarter, the average size of Ethereum tokenized funds was $19.4 billion, up 4.9% quarter-over-quarter and a staggering 73.1% year-over-year. The sector can be divided into two main types:
Largest yield-generating on-chain USD products: Sky sUSDS (approximately 6.4 billion), Ethena sUSDe (approximately 3.5 billion).
Traditional financial compliance funds (core carriers of institutional narratives): BlackRock BUIDL (issued through Securitize, approximately $1 billion), WisdomTree Government Monetary Fund (approximately $815 million), Superstate USTB (approximately $620 million), and Ondo OUSG (approximately $320 million) follow closely behind. Comparing the five major public blockchains, Ethereum's $19.4 billion token fund significantly outperforms ZKsync Era ($2.5 billion), BNB Chain ($2.3 billion), Solana ($1.3 billion), and Stellar ($1.1 billion), accounting for 73% of the total, making it the second most dominant token asset sector for Ethereum.
Tokenized Commodities
In the first quarter, the average size of Ethereum tokenized commodities reached $4.7 billion, a 60% increase quarter-over-quarter and a staggering 325.9% year-over-year, making it the fastest-growing tokenized category. The sector is almost entirely comprised of on-chain gold: Tether Gold (XAUT) (approximately $2.6 billion) and Paxos Gold (PAXG) (approximately $2.4 billion) together account for the entire sector's share. Comparing the five major related public chains, Ethereum's $4.7 billion size far surpasses Ripple ($736.6 million), Arbitrum One ($95.9 million), BNB Chain ($38.4 million), and Solana ($29.8 million), accounting for 84% of the total, making it Ethereum's most dominant sub-sector.
Tokenized Stocks
Ethereum token stocks are the smallest sub-category, with an average market capitalization of $365.1 million in Q1, compared to almost zero in the same period last year, representing a 16.5% increase quarter-over-quarter. This sector is almost entirely dominated by Ondo Finance, which issues on-chain assets representing the S&P 500, Nasdaq 100 broad-based indices, and dozens of individual stocks, constituting the vast majority of the Ethereum token stock market capitalization. Comparing the five major public chains, Ethereum's $365.1 million slightly surpasses Solana ($249 million), BNB Chain ($150.5 million), Arbitrum One ($29 million), and Stellar ($4.2 million), representing only 45.8% of the total token stock market capitalization across the five chains. It is the only token asset sector where Ethereum does not hold an absolute majority.
In the overall tokenized asset sector: the stock of stablecoins declined slightly in the first quarter, but Ethereum's monopoly position in the token fund and commodity sectors continued to be consolidated.
On-chain activity
Monthly active users are defined as independent addresses that generate revenue-generating on-chain transactions each month. This metric only counts Ethereum Layer 1 mainnet interaction addresses. The average monthly active users in Q1 reached 13.2 million, a significant increase of 53.5% quarter-over-quarter and 85.9% year-over-year, setting a new historical record and ending the slow growth trend of previous quarters, with a substantial increase in user growth rate.
Total transaction volume refers to the number of transactions written to and confirmed on the blockchain, reflecting the activity level of user interactions on the chain. Transactions per second (TPS) is the average confirmation rate over a period of time, measuring the network's real-time capacity. Both metrics only count the Ethereum Layer 1 mainnet. In Q1, the total number of Layer 1 transactions reached 200.4 million, up 38% quarter-over-quarter and 81.5% year-over-year; the average TPS increased to 25.78, up 41.2% quarter-over-quarter. Both figures set new historical highs, proving that the growth in user scale has effectively translated into real on-chain business growth.
The transaction fees mentioned here specifically refer to the basic network costs incurred by users initiating transactions at Ethereum Layer 1, and are distinct from the transaction fees for all applications across the entire ecosystem as summarized in Part 2. Total transaction fees at Layer 1 in Q1 amounted to $39.9 million, a sharp drop of 47.9% quarter-over-quarter and 81.9% year-over-year. The most striking contrast this quarter is the combination of increased activity and a significant decline in fees: while total transaction volume increased by 38%, total fees shrank by nearly 50%. The core reason for this is that the Blob expansion significantly increased block storage capacity, resulting in ample block space supply and a substantial decrease in the cost per transaction.
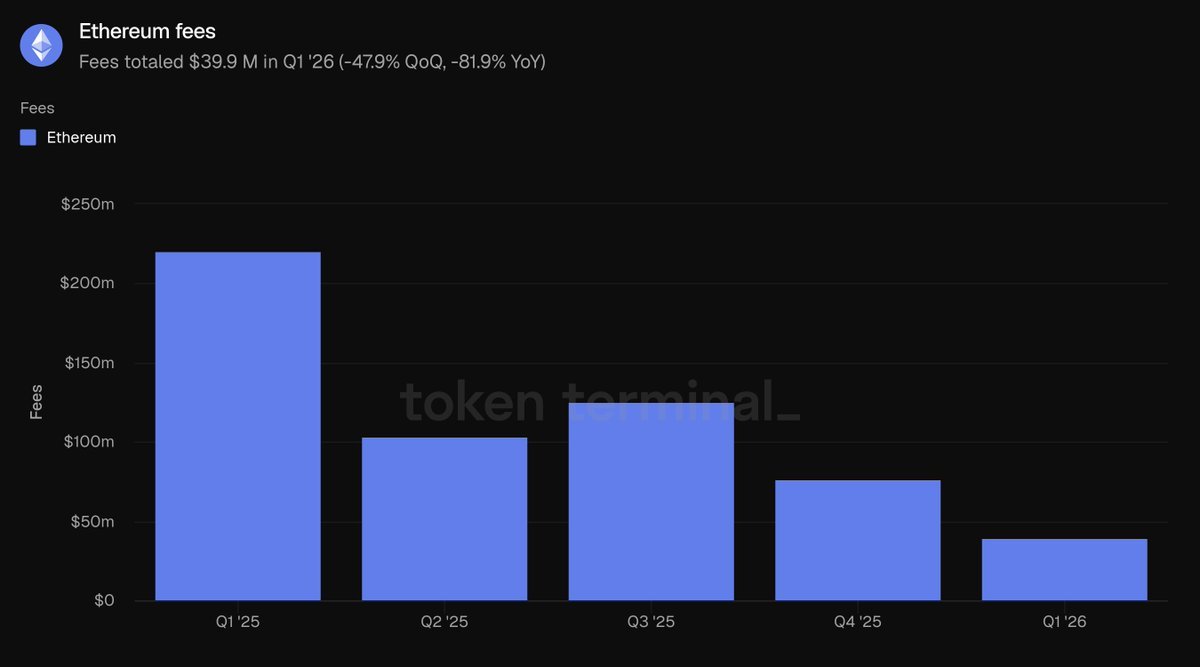
The core conclusion of this section is that the benefits of network expansion have materialized: the number of users and transactions have reached new highs simultaneously, while the overall network usage cost has decreased. When the rate of network throughput expansion exceeds the growth rate of market transaction demand, it will exhibit the characteristics of "increased activity and decreased transaction fees."
Fundamentals of the native token ETH
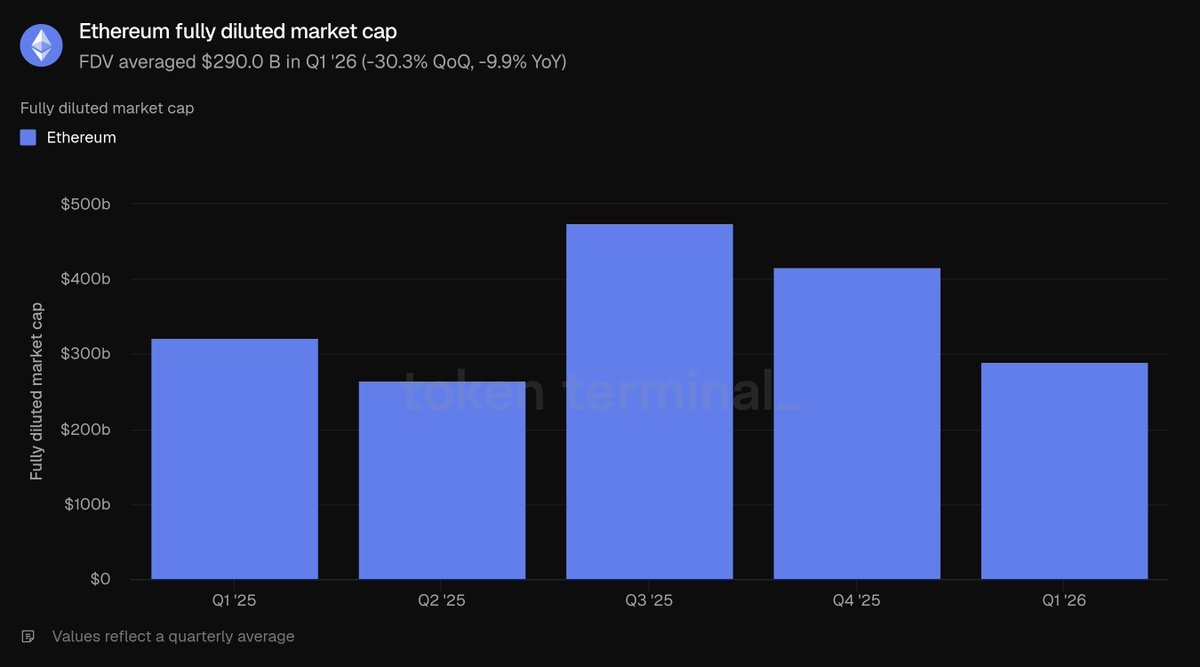
The calculation logic for fully diluted total market capitalization is: ETH token price × total supply under the current token economic model (including circulating, locked, unreleased, and pending tokens). In the first quarter, ETH's average fully diluted market capitalization was $290 billion, a sharp drop of 30.3% quarter-over-quarter and 9.9% year-over-year. This was the largest quarter-over-quarter decline among all valuation metrics in the report and a core factor driving the overall decline in the size of USD-denominated assets across the entire ecosystem.
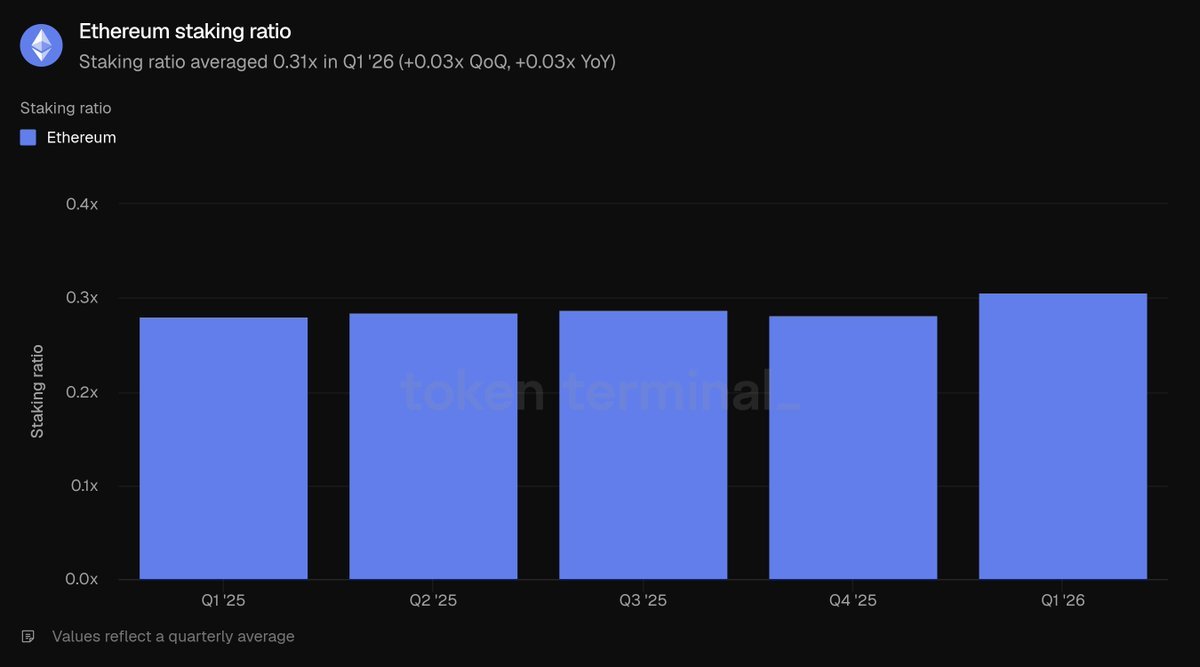
Staking Ratio: The ratio of the total value of ETH staked to secure the Proof-of-Stake network to the overall market capitalization of ETH; 0.31 represents approximately 31% of the ETH market capitalization involved in staking. The average staking ratio in Q1 was 0.31, higher than 0.28 in the previous quarter and the same period last year. Even with a significant correction in the overall market capitalization of ETH, the proportion of tokens used for staking on the network continued to rise, indicating that users' long-term staking intentions remained stable during periods of price decline.
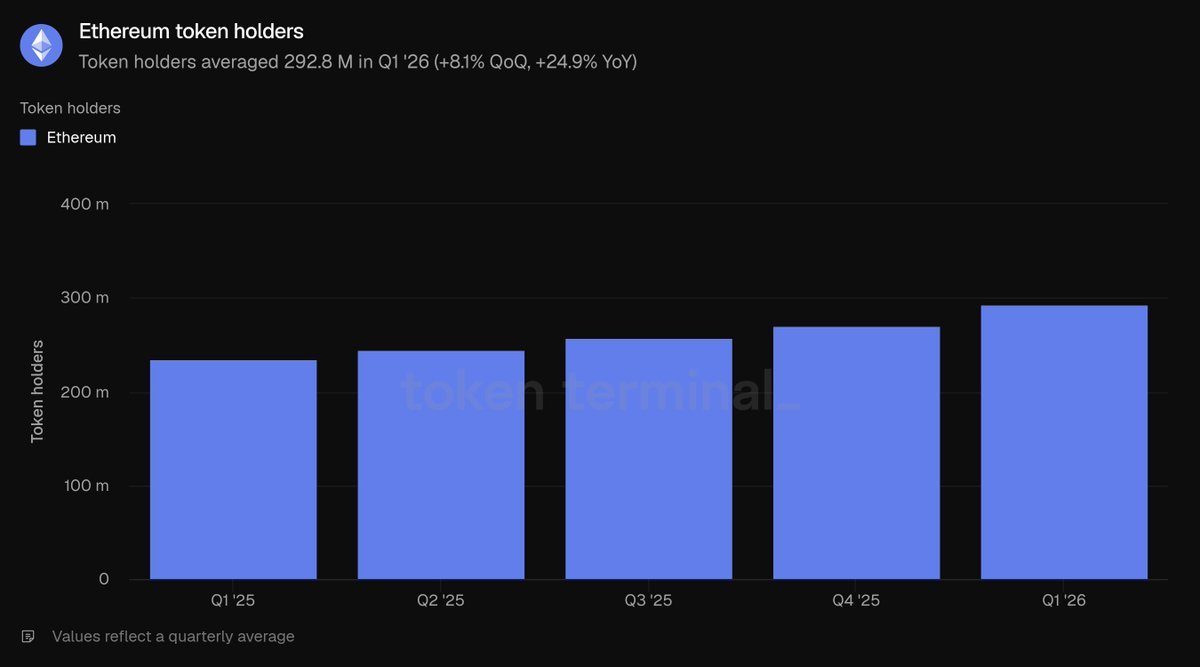
Token Holder Metrics: The total number of unique wallet addresses holding ETH. The average number of ETH holding addresses in Q1 was 292.8 million, up 8.1% quarter-over-quarter and 24.9% year-over-year, marking five consecutive quarters of steady growth. Despite a continuously declining fully diluted market capitalization, the continued expansion of ETH holding addresses indicates a further diversification of the ETH holding community, demonstrating that the willingness of ordinary users to invest has not cooled down despite short-term market fluctuations.
Etherealize team's interpretation and commentary
The most significant contradiction this quarter: Ethereum's Layer 1 mainnet usage hit a record high, while transaction fees declined simultaneously. Ethereum proactively pushed for network scaling, sacrificing short-term transaction fee revenue. The long-term logic is that cheaper block space will release massive potential market demand, ultimately driving long-term revenue growth across the entire network.
Data from Token Terminal's "Ethereum Q1 2026 Report" proves that this long-term logic is being realized: year-over-year growth in monthly active users was 85.9%, total transaction volume increased by 81.5%, and network throughput improved by 81.7%. This is a typical manifestation of Jevons' paradox. The team predicts that the long-term increase in network-wide transaction demand will completely offset the short-term revenue loss caused by the decline in individual transaction fees. Analogous to the semiconductor industry: when Gordon Moore proposed Moore's Law in 1975, the industry's revenue was limited; today, the industry's revenue has grown by several orders of magnitude. The scaling benefits have not yet been fully realized: the Q3 Glamsterdam upgrade plan will increase the gas limit by more than three times; Ethereum's long-term roadmap plans to achieve tens of thousands of TPS by 2029, creating a high-speed first-layer public chain with second-level transaction final confirmation.
The team agrees with BlackRock CEO Larry Fink's view from last December: the current stage of the tokenization industry is equivalent to the internet in 1996—when Amazon's online book sales were only $16 million. Back then, the market generally believed Amazon was merely an online bookstore surviving the dot-com bubble and continuously losing money; however, Bezos predicted that the internet would completely reshape the retail industry, abandoning short-term profits to focus on building network effects and economies of scale. Ethereum is now making the same choice to solidify its position as a global financial settlement layer.
The development of the internet has brought another important lesson: open, permissionless networks will ultimately triumph over closed, private networks. In his 1995 book, *The Road Ahead*, Bill Gates predicted that digital commerce would rely on the "information superhighway" of proprietary corporate networks, rather than the open internet. At that time, Microsoft's MSN, AOL, CompuServe, and Prodigy all operated walled gardens, boasting millions of paying users; the French Minitel terminal system, until the end of 1996, had a user base exceeding that of the global internet. However, all these closed systems ultimately failed. No large, established enterprise was willing to build its business on a network controlled by competitors; more importantly, no enterprise could permanently keep up with the pace of innovation in a permissionless, open ecosystem. History repeatedly confirms this pattern: Linux surpassed proprietary Unix systems, open web pages replaced closed corporate intranets, and Wikipedia replaced the Encyclopedia Britannica. In the early stages of each transformation, proprietary products gain a first-mover advantage due to more precise functionality, ample marketing, and business resources; but once the open ecosystem accumulates sufficient development tools, developers, and neutral, trustworthy attributes, this first-mover advantage quickly dissipates.
This industry pattern is now being repeated in the financial infrastructure sector, and all the data in this report confirms that Ethereum has crossed the ecosystem tipping point: it holds an absolute market share in all core tracks. Institutions choosing Ethereum for tokenized finance is not based on ideological preference, but rather on the concentration of ecosystem liquidity, composability, and mature institutional implementation cases. The report data shows that Ethereum holds 79.2% of the active DeFi lending, 61.8% of stablecoins, 73% of token funds, and 84% of the token commodity market share among the top five public chains. Each new type of tokenized asset further enhances ecosystem liquidity, continuously attracting more institutions to enter the market; the neutral and unbiased underlying layer is the only stable and balanced solution in the industry—large financial institutions will never uniformly choose competing private chains for asset settlement. Furthermore, institutions are gradually realizing that privacy interactions, access restrictions, KYC compliance, and asset transfer control can all be achieved on the Ethereum layer through privacy computing environments and permissioned token standards, while simultaneously achieving full access to the entire network's public liquidity; conversely, closed private chains cannot bridge the massive liquidity and diverse applications of an open ecosystem.
Following the quarter's conclusion, institutional investors accelerated their deployment efforts, with several significant initiatives launched in May alone: In asset management: BlackRock submitted applications for two new tokenized funds; JPMorgan Chase launched its second Ethereum-based on-chain money market fund, JLTXX; Fidelity International launched FILQ, a Moody's AAA-rated USD liquidity fund, listed as an ERC-20 token. In the stablecoin sector: The Japan Blockchain Foundation's yen stablecoin, EJPY, is about to deploy on Ethereum; a consortium of 12 major European banks (including BNP Paribas, ING, UniCredit, and Banco Bilbao Vizcaya Argentaria) is preparing a compliant euro stablecoin.
In 1990, the internet seemed a distant dream, but by 2005 it had become a social necessity. If Fink's assessment of the development stage of the tokenization industry is accurate, the next few years may be the most opportune period in Ethereum's history. The team's previous report, "Efficient Money," presented the core argument that network transaction fees provide a floor for ETH's intrinsic value; the long-term optimistic logic is that, relying on its more complete monetary attributes, ETH is expected to absorb the over $30 trillion in monetary storage value premium of gold and Bitcoin combined. Ethereum can establish its leading position in the industry without relying on high transaction fees.