

SOL is the native token of the Solana blockchain , created by Anatoly Yakovenko. SOL price has fallen below the long-term descending resistance line since reaching an all-time high of $259.90 in November 2021. The downtrend led to as low as $8 in December 2022.

SOL price rallied after that, gaining 230% in January 2023. However, it failed to break through the $27 resistance area (red symbol). This is an important level as it has previously acted as support since March 2021. Hence, this level is now expected to provide stiff resistance.
Moreover, this zone will soon coincide with the long-term descending resistance line outlined above.
Finally, the weekly RSI has also found resistance at the 50 level, which often occurs during breakouts and retests. So, the trend can only be considered bullish when Solana price breaks out of the $27 resistance area and the descending resistance line. In that case, a move to $47 is possible.
However, if it continues to be rejected, the SOL price could drop to the single digit region once again.
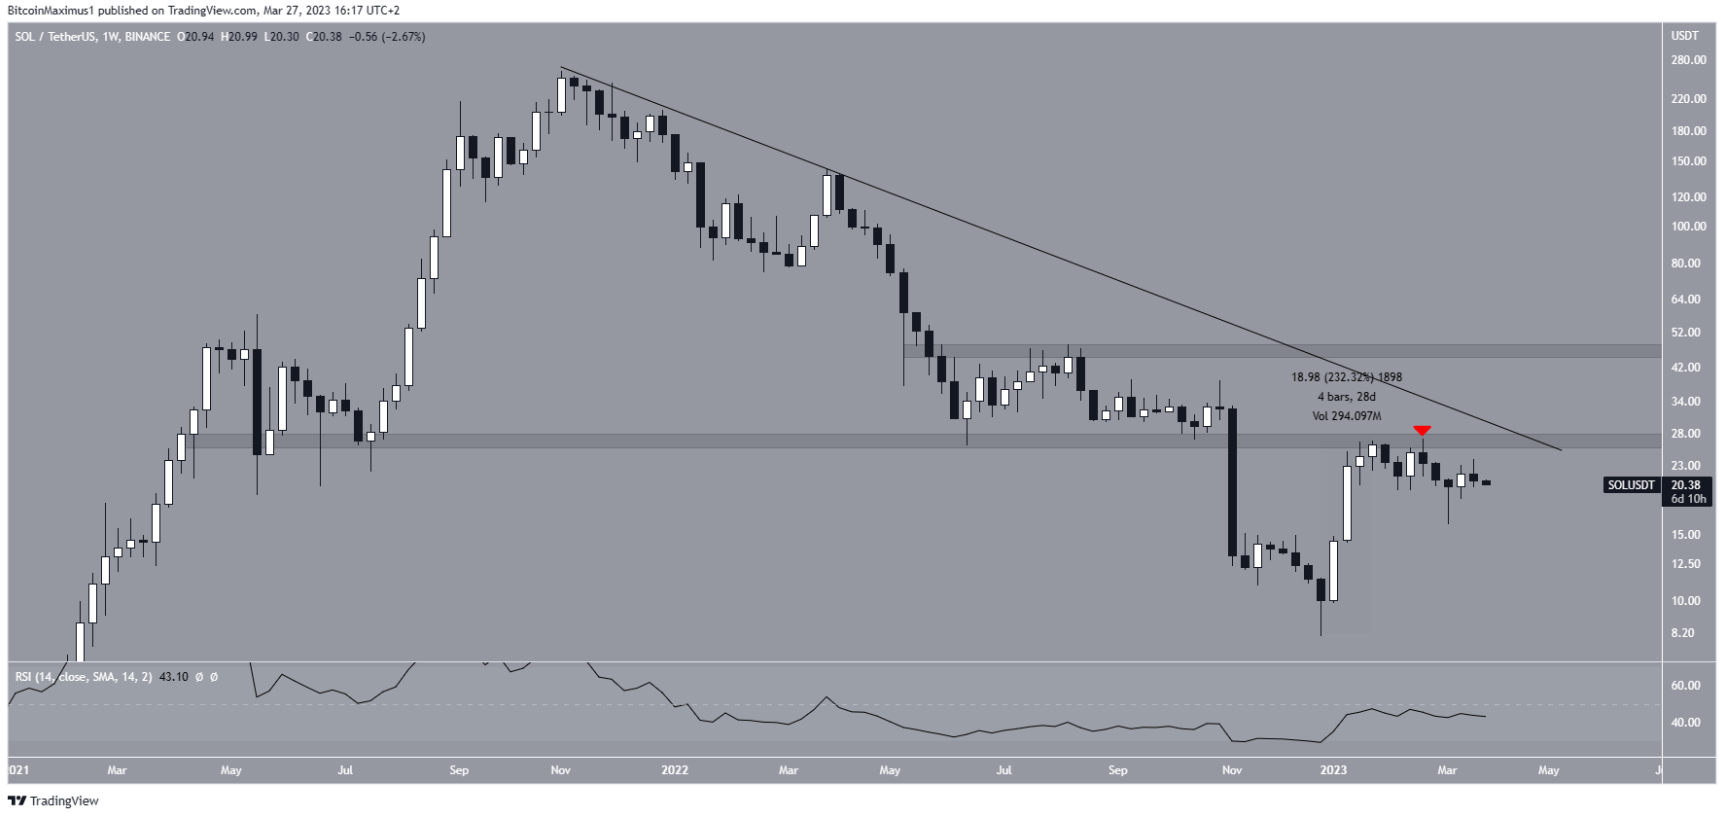
Weekly SOL/USDT Chart | Source: TradingView
Technical analysis from the daily timeframe shows that SOL price is trading at the critical support of $20.30. Whether the price bounces or breaks below this zone will be important in determining the future trend.
If broken then the previous breakout will be invalid. Moreover, it also causes the RSI to do the same thing as it has also broken out of its bearish divergence (green line). After that, the RSI will drop below 50 and the price can drop to the $17.60 support area. This issue may occur in the next 24 hours.
On the other hand, a bounce and a higher low could help the bulls make another attempt to break the long-term resistance line.
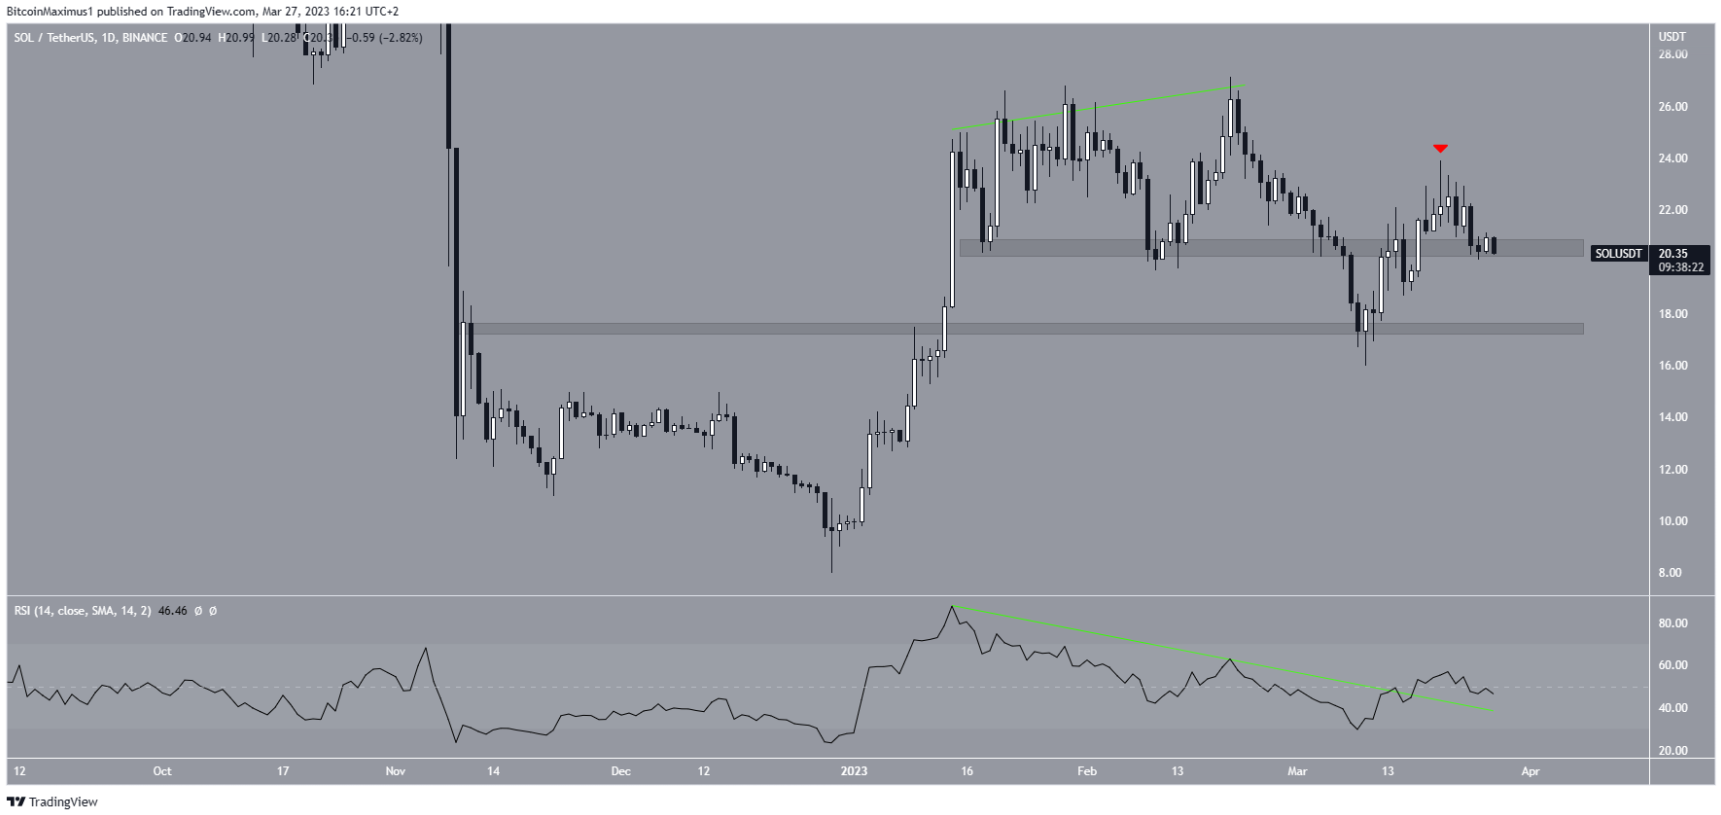
Daily SOL/USDT Chart | Source: TradingView
Finally, the short-term six-hour time frame shows that SOL price has broken below an ascending parallel channel. Since this is a bearish pattern, it supports the possibility of a continuation of the decline.
Therefore, the wave count most likely to indicate that SOL is in wave C of the ABC correction structure (black). Giving the A:C waves in a 1:1 ratio would lead to a low of $12.90. As this level coincides with the 0.786 (white) Fib retracement support at $12.10, the entire $12-$13 zone can be considered support.
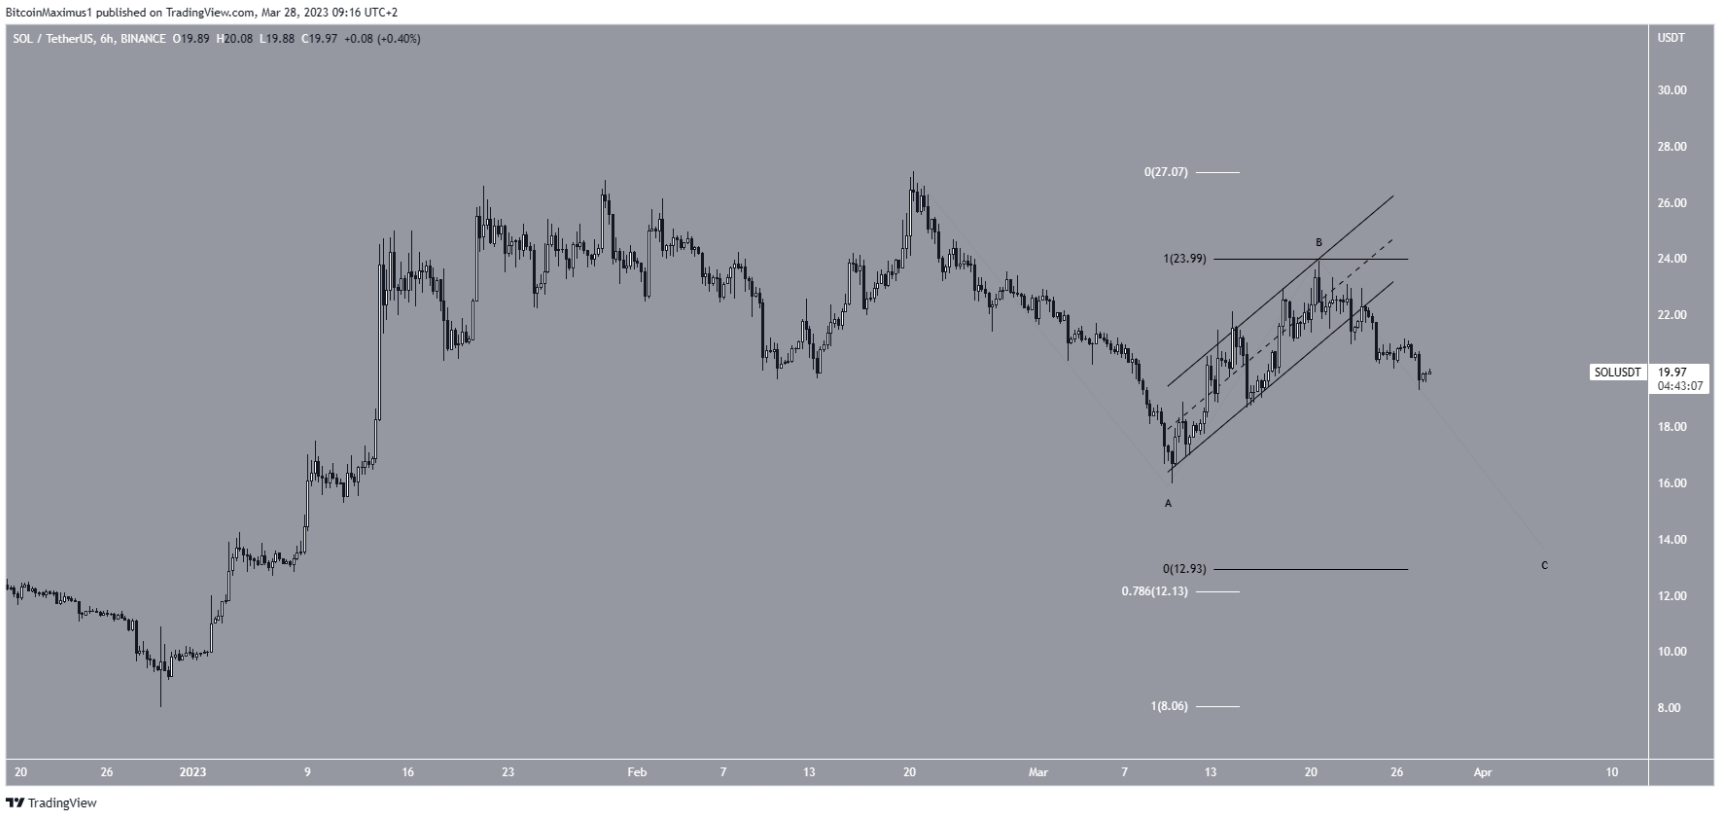
SOL/USDT 6-hour chart | Source: TradingView
In summary, the most likely Solana price forecast is a continuation to $12-$13. Whether the price will fall further remains unclear.
On the other hand, a move above $27 will invalidate this bearish forecast and could catalyze a rally to $47.
Disclaimer: This article is for informational purposes only, not investment advice. Investors should research carefully before making a decision. We are not responsible for your investment decisions.
According to Beincrypto
FOLLOW US ON FACEBOOK


