

Written by: BEN LILLY
Compilation: Deep Tide TechFlow
When will the bull market return? This is the question everyone wants to ask.
There is no exact answer to the question, but an analytical framework helps us get closer to the right answer.
Encryption analyst BEN started from the most basic supply curve of economics, analyzed the possible price changes of Ethereum and Bitcoin after the supply changes, and took the historical oil price changes as an example, trying to penetrate the law of the supply and demand relationship.
Is the following original text, is it an exact prophecy or a precise prophecy? Maybe after reading, each of you will have your own answer in your heart.
The second half of 2023 will usher in a flowering of narratives of all kinds. This has happened before in 2020 and 2021, when the printing presses were in full swing that year due to COVID. The hangover, of course, is inflation.
In a bull market, every trader, investor, and player is touting the narrative that Bitcoin is a hedge against inflation. This is why many people believe that the long-term trend of Bitcoin is up.
But rewind the time to a year ago, and the results are not ideal. Inflation was above 8% every month for the months of March-September 2022... yet Bitcoin fell 50% over the same timeframe.
As it turns out, the narrative of bitcoin as a hedge against inflation isn’t working. So what happened? Well, many pundits are starting to change the narrative and say Bitcoin is an early indicator of inflation.
In fact, you can ignore any narratives, macro sentiment, and everything else, and just focus on one main thing — the halving. As we'll mention later, many price changes are based on supply fundamentals.
But let's start today with Ethereum.
It underwent a Shanghai upgrade. While the upgrade appears to have minimal impact on its supply...however, in the coming months, it could create a supply shock that no one anticipates. This may give ethereum an edge over bitcoin in Q3 and Q4.
And then we'll talk about what I mentioned earlier... the full story for bitcoin in late 2023 and 2024.
Eigen Layer, affecting ETH price from the supply side
I've spent over a decade trying to grasp the laws of the "social science" of economics, so when I entered crypto about six years ago, I thought I was dropping what I had learned and starting to try new things. It turns out that the supply and demand curves learned from "social science" have been etched in my head.
So, when analyzing ETH(and other tokens), I can't help but look at things in terms of supply and demand curves, and apply monetary theory to ETH.
Eigen Layers are no exception.
Briefly, the Eigen Layer aims to allow people to use staked ETH to secure other areas of the Ethereum ecosystem. The team believes that the ability to re-stake ETH (so-called Liquidity staking) can make the ETH more productive.
This is a great idea. First, it will reduce the cost for users to participate in multiple parts of the ecosystem, since they do not need to launch additional services or stake additional ETH.
Additionally, it can help projects that want to leverage Ethereum’s powerful consensus layer to make themselves more secure. New projects tend to overrun their security budget early on, rewarding validators with tokens too much for high security spending that the network doesn't need. This creates an oversupply in the market, placing an additional financial burden on projects.
So it could be a very powerful solution in the market. However, I am conflicted when it comes to monetary economic effects.
The main benefit of implementing Liquidity staking is that instead of buying more ETH to stake into a new project, users can reuse the ETH currently staked.
The following set of charts can help reinforce this point.
In the first chart below, the white line represents the supply of ETH . The purple line below the supply line represents the supply of ETH minus the staked ETH . This is a way of looking at the "net Liquidity " of ETH .
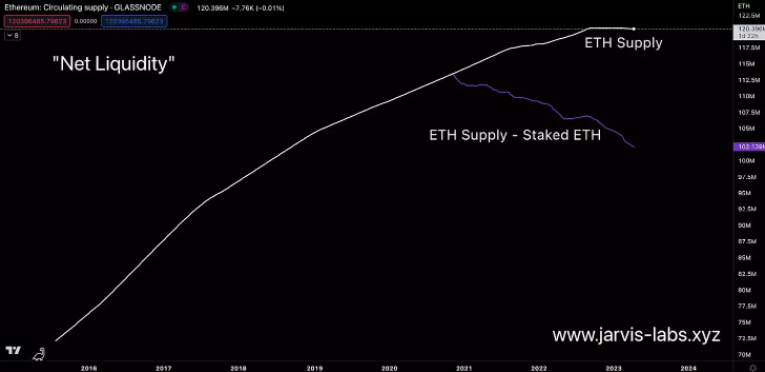
The problem with this approach is that because Lido, Frax, Rocket Pool, and others offer Liquid Staking Derivatives(LSDs), they essentially make staked ETH Liquidity again. This means that this view of net Liquidity is inherently flawed from the start.
Therefore, in the chart below, I have recalculated the net Liquidity curve for ETH by adding Lido's LSD - stETH supply.
Regardless, net Liquidity is significantly higher, as shown below. If we add Rocket Pool's rETH and Frax's frxETH, it will be even higher.
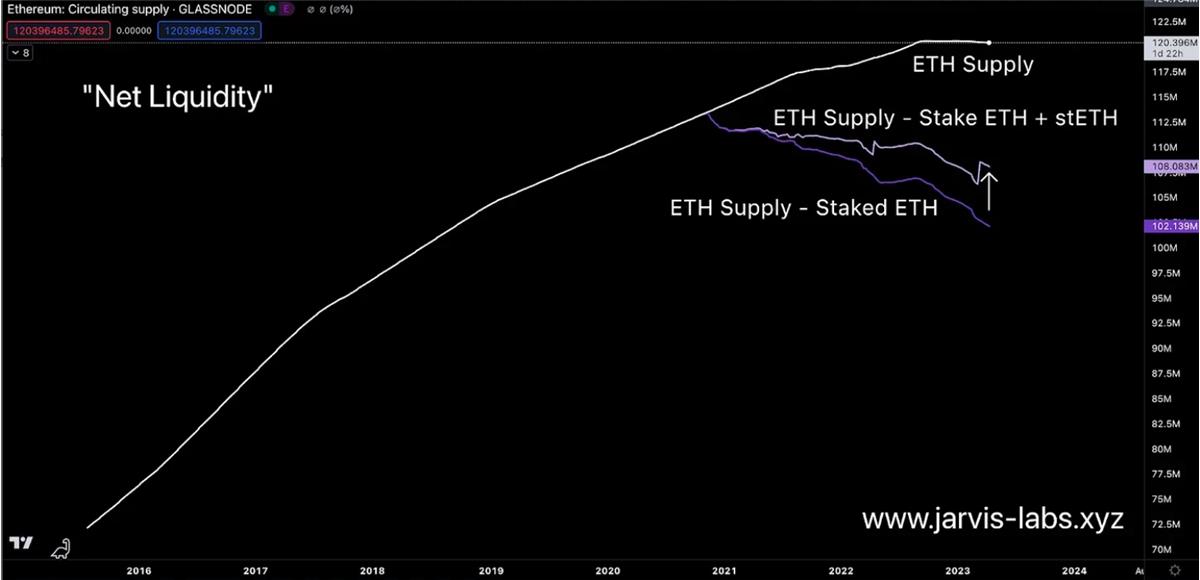
In other words, on the face of it, the Eigen Layer seems to make staked ETH more Liquidity, as it allows the staked ETH to be reused.
But in reality, Eigen Layer will cause the ETH supply to become less Liquidity than before. Because users will no longer pledge ETH on LSD, but use Eigen Layer for re-pledging. This means that Eigen Layer will lead to a decrease in net Liquidity.
Less supply in the market leads to stronger price trends . The Eigen Layer solution may not get the attention of the crypto market, but once it is in effect, we can expect to see its lifting effect on price fundamentals be stronger. We look forward to tracking the usage of Eigen Layer.
But remember, the fate of ETH is still decided by the king of the market , BTC . Wherever it goes, ETH will follow in BTC 's footsteps.
BTC supply halved, ushering in a new bull market
After discussing ETH, let's move on to BTC.
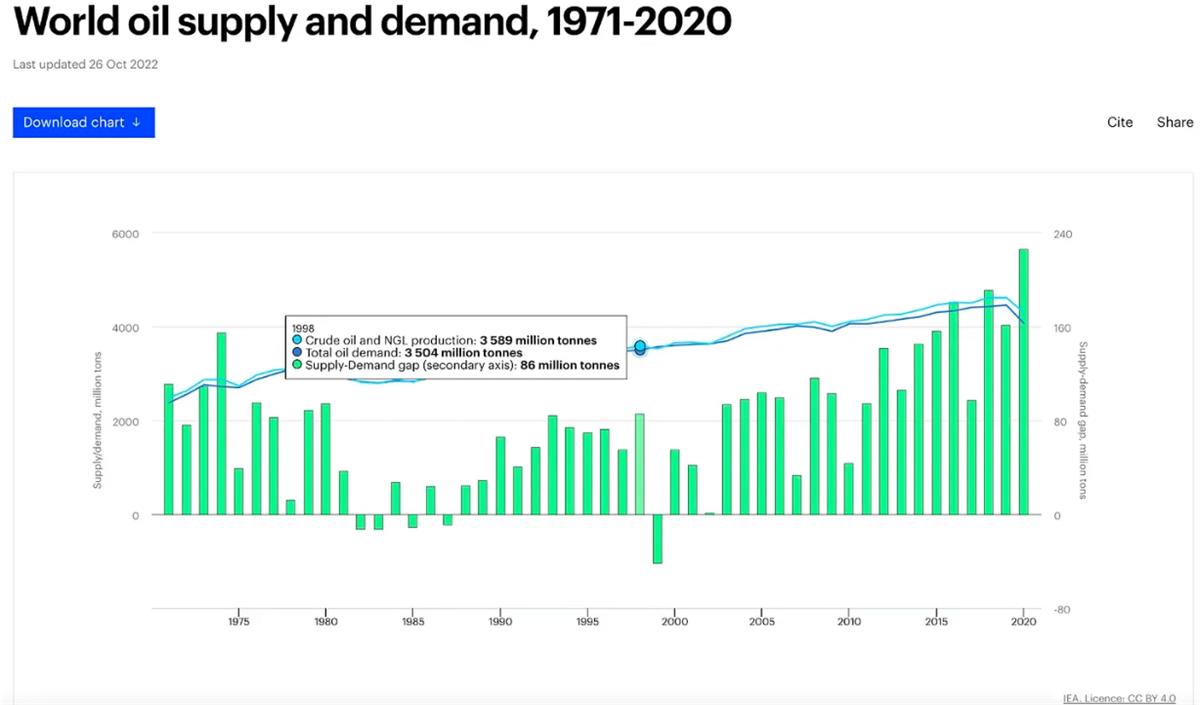
Bitcoin's next halving is about a year away. Every Bitcoin halving reduces the amount of new Bitcoins in circulation, creating a supply shock. If we compare it to oil, then this is equivalent to getting less oil out of the ground. When we see oil producers discussing this topic, the market price will rise accordingly. More often than not, news creates price volatility...followed by a lull in the market...followed by a slow rise in prices over an extended period of time. For example, around 1999, there was a decline in global oil supply.
This was due to the global agreement to cut production announced in March and June 1998. Interestingly, we have seen price action ahead of these production cuts. The chart below shows the price of crude oil futures with a vertical red line drawn over that time period. Note the price changes around that time period. There were two rapid rises of more than 20%, indicating that the market expected to reduce oil supply.
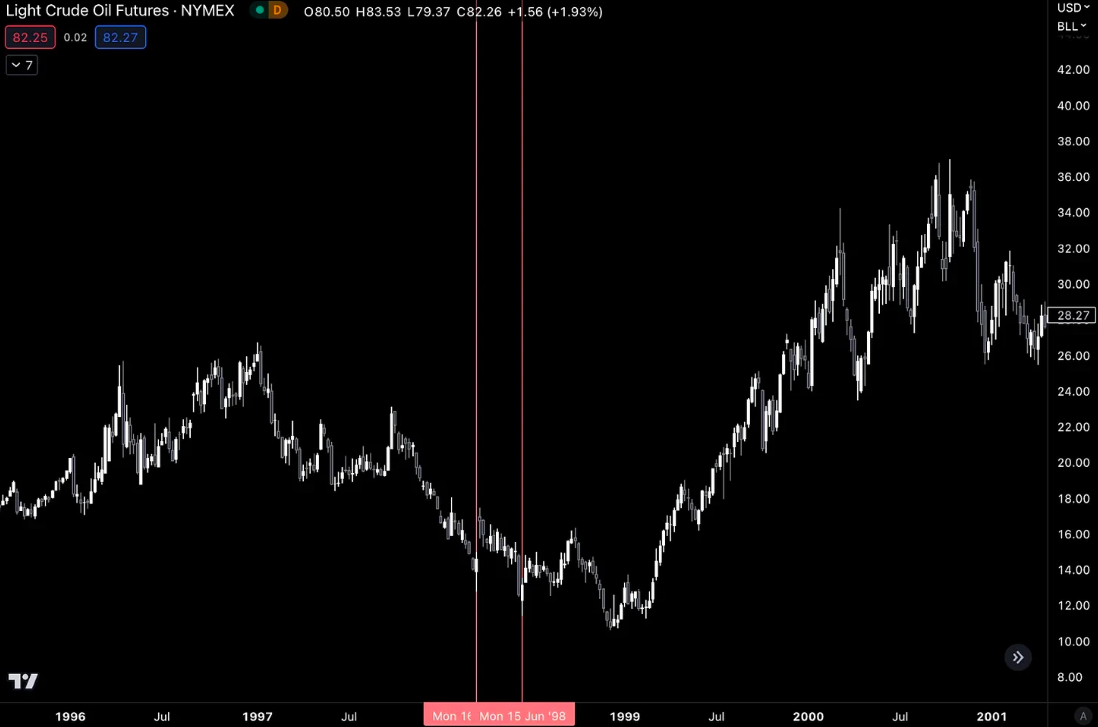
But prices continued to fall until 1999. This is because supply changes like this take time to be reflected in global market prices.
There is a lag between the supply cuts and the price reaction , as there is still an inventory of supply in the market to back it up. But once the available supply in the market starts to dwindle significantly, the price will react.
In 1999 and 2000, oil prices rose more than 200% once supply cuts were detected by the market.
The same is true for Bitcoin. The main difference is that its reduction is programmed into its code. This means that no news release is required, the market knows what is coming and can react to it essentially in advance.
History shows that the price will bottom out between 13-18 months before each production reduction event of BTC . We are now 12 months away from the next halving, and based on this history, this is why BTC prices have been on the rise lately.
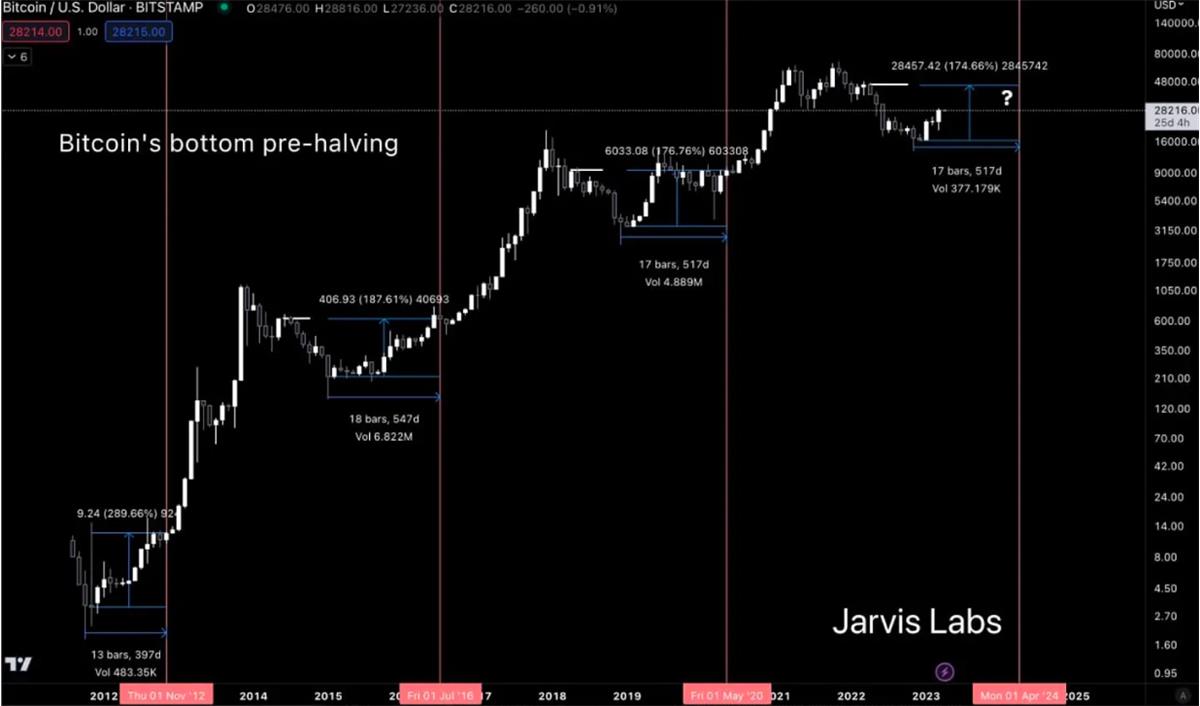
Another important concern is that there is often a cooling off period between the bottom and the halving event...and it is this cooling off period that provides some of the best buying opportunities in history.


