Despite the breakout three months ago, Ripple XRP price has remained stable above horizontal support.
Today the price of XRP fell below this support but is on the way to recovery. Will you succeed?
Ripple falls below horizontal support
A look at Ripple’s weekly technical analysis shows that the altcoin has been rising with rising support since May 2022. During this period, Ripple broke an important horizontal zone and hit a new 2023 high in July.
However, the sharp rise proved unsustainable, and it subsequently fell, forming a higher low in August (green icon). This resulted in the formation of a steep upward support trend line, which is still in effect.
XRP fell today, but reaffirmed this support trend line .
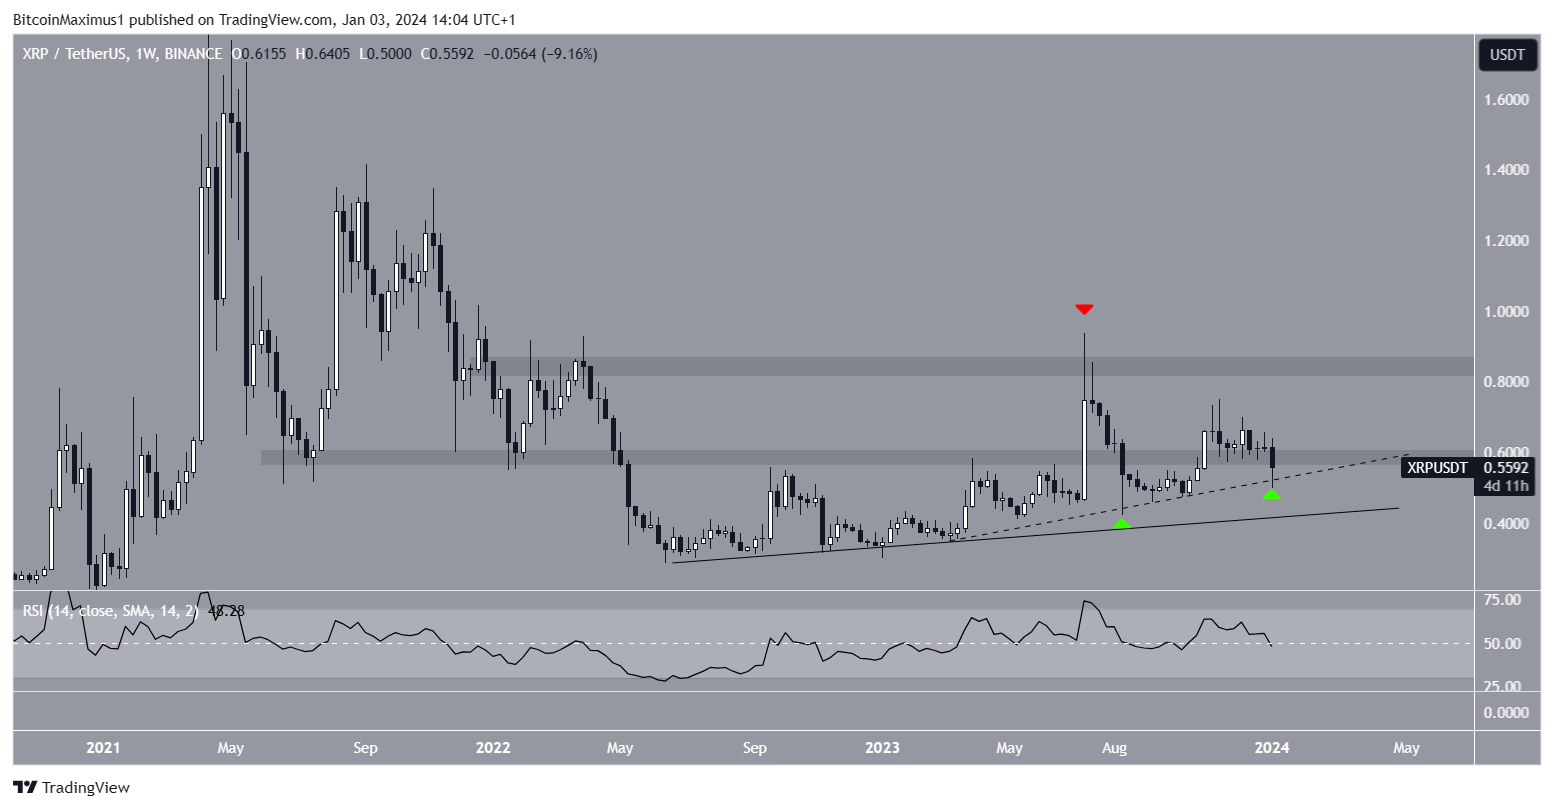
When evaluating market conditions, traders use RSI as a momentum indicator to determine whether the market is overbought or oversold and whether to accumulate or sell.
If the RSI reading is above 50 and the trend is up, the bulls are dominant, but if it is below 50, the opposite is true. If the RSI is at 50, it indicates a neutral trend.
What do analysts say?
Cryptocurrency traders and analysts at X are positive about the future XRP price trend.
RealXRPWhale predicted that XRP would rise strongly, noting that it broke the downward resistance trend line.
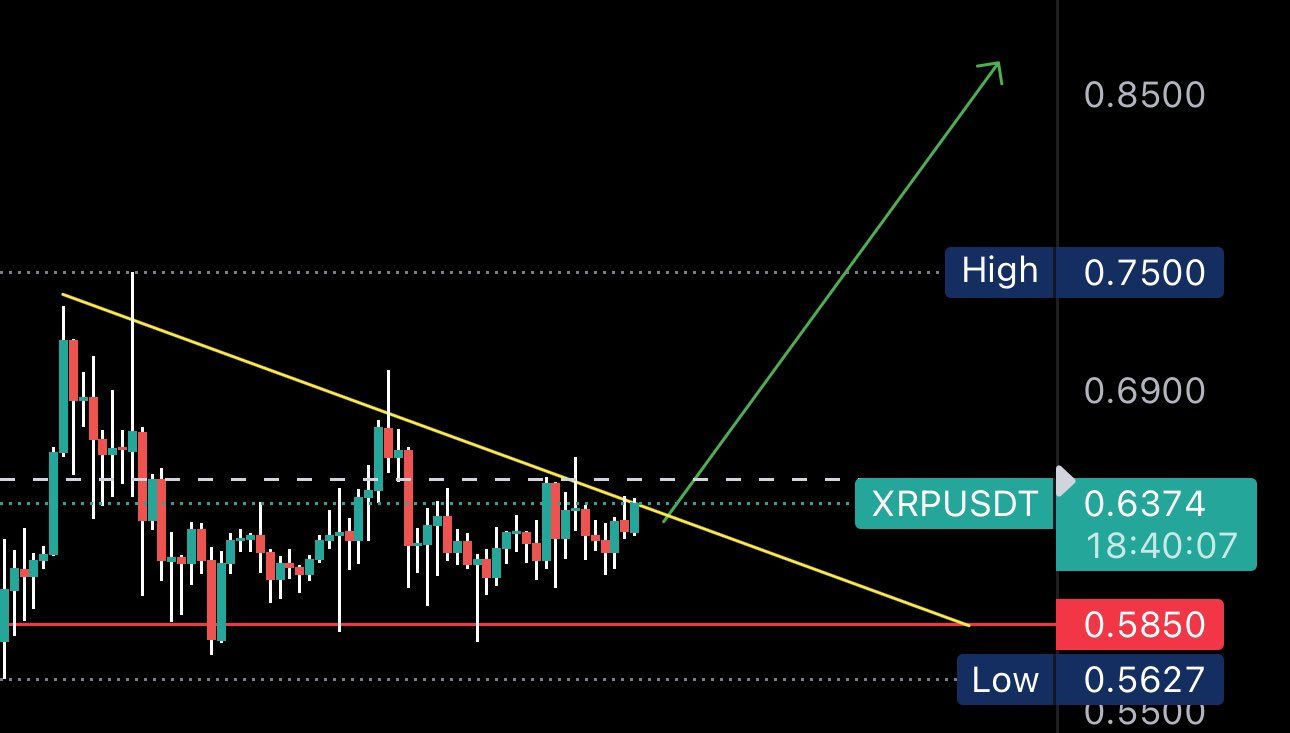
FLASH mentioned a symmetrical triangle pattern and said a breakout of this pattern could accelerate the rise to $0.85.
Lastly, the cryptocurrency is bullish because the price closed above horizontal support .
Read More: Getting Started With XRP Wallets
XRP Price Prediction: What Should We Make of Today’s Drop?
Like the weekly time frame, technical analysis on the daily time frame provides a neutral outlook. This is due to price movements and RSI readings.
The price action shows that Ripple broke the horizontal resistance area of $0.54, forming a symmetrical triangle. However, today the price fell from the triangle and reaffirmed the support area (green icon).
RSI is below 50, which is a sign of a bearish trend. Therefore, future trends may determine whether XRP price bounces from this area or declines .
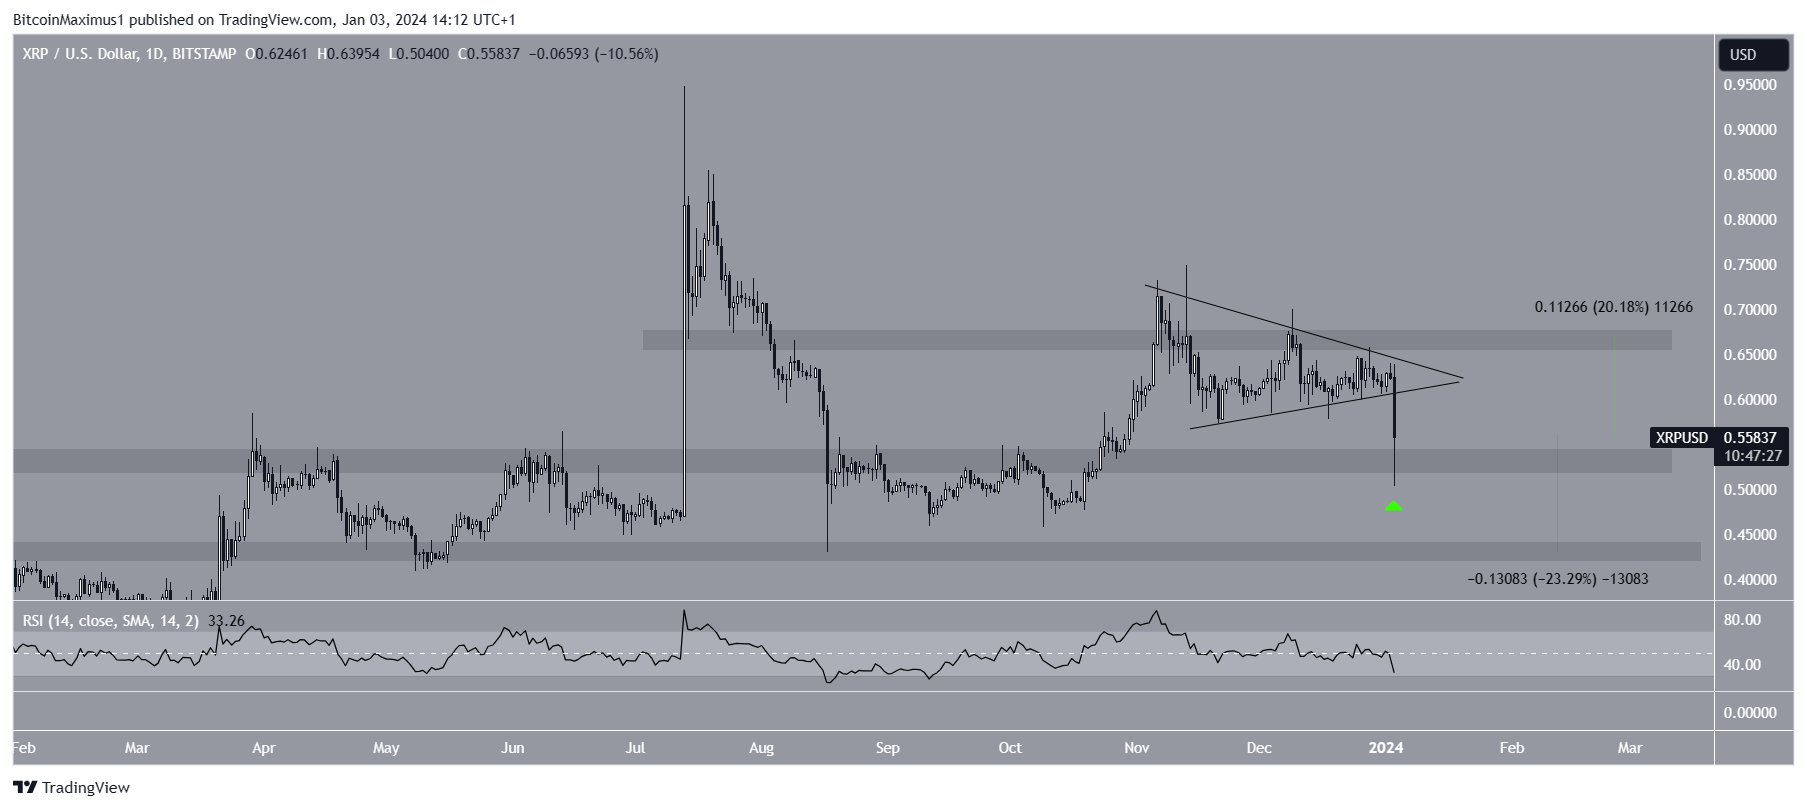
A break below $0.54 could result in a 25% decline in XRP price towards the next nearest support at $0.42. On the other hand, a successful rebound could push the price up 20% to retest the $0.67 resistance level.
Click here to view BeInCrypto’s latest cryptocurrency market analysis.


The above article is a BeInCrypto article written in English translated into Korean using AI.