

executive Summary
- The U.S. Securities and Exchange Commission (SEC) successfully approved ten new spot Bitcoin ETF products, setting the tone for a chaotic week for Bitcoin investors.
- Bitcoin prices hit a new multi-year high, followed by a year-to-date low, as the market fell 18% over the weekend. This was primarily driven by derivatives leverage and spot profit-taking.
- Several indicators reached important resistance levels seen in past cycles and were highlighted by long-term holders taking profits on approximately 75,000 BTC.
💡All charts can be found in the chain reporting dashboard
The first two weeks of 2024 have proven to be a real roller coaster ride for Bitcoin investors. In one of the most high-profile financial product launches in history, the U.S. Securities and Exchange Commission has approved ten spot Bitcoin ETF products for trading in U.S. markets.
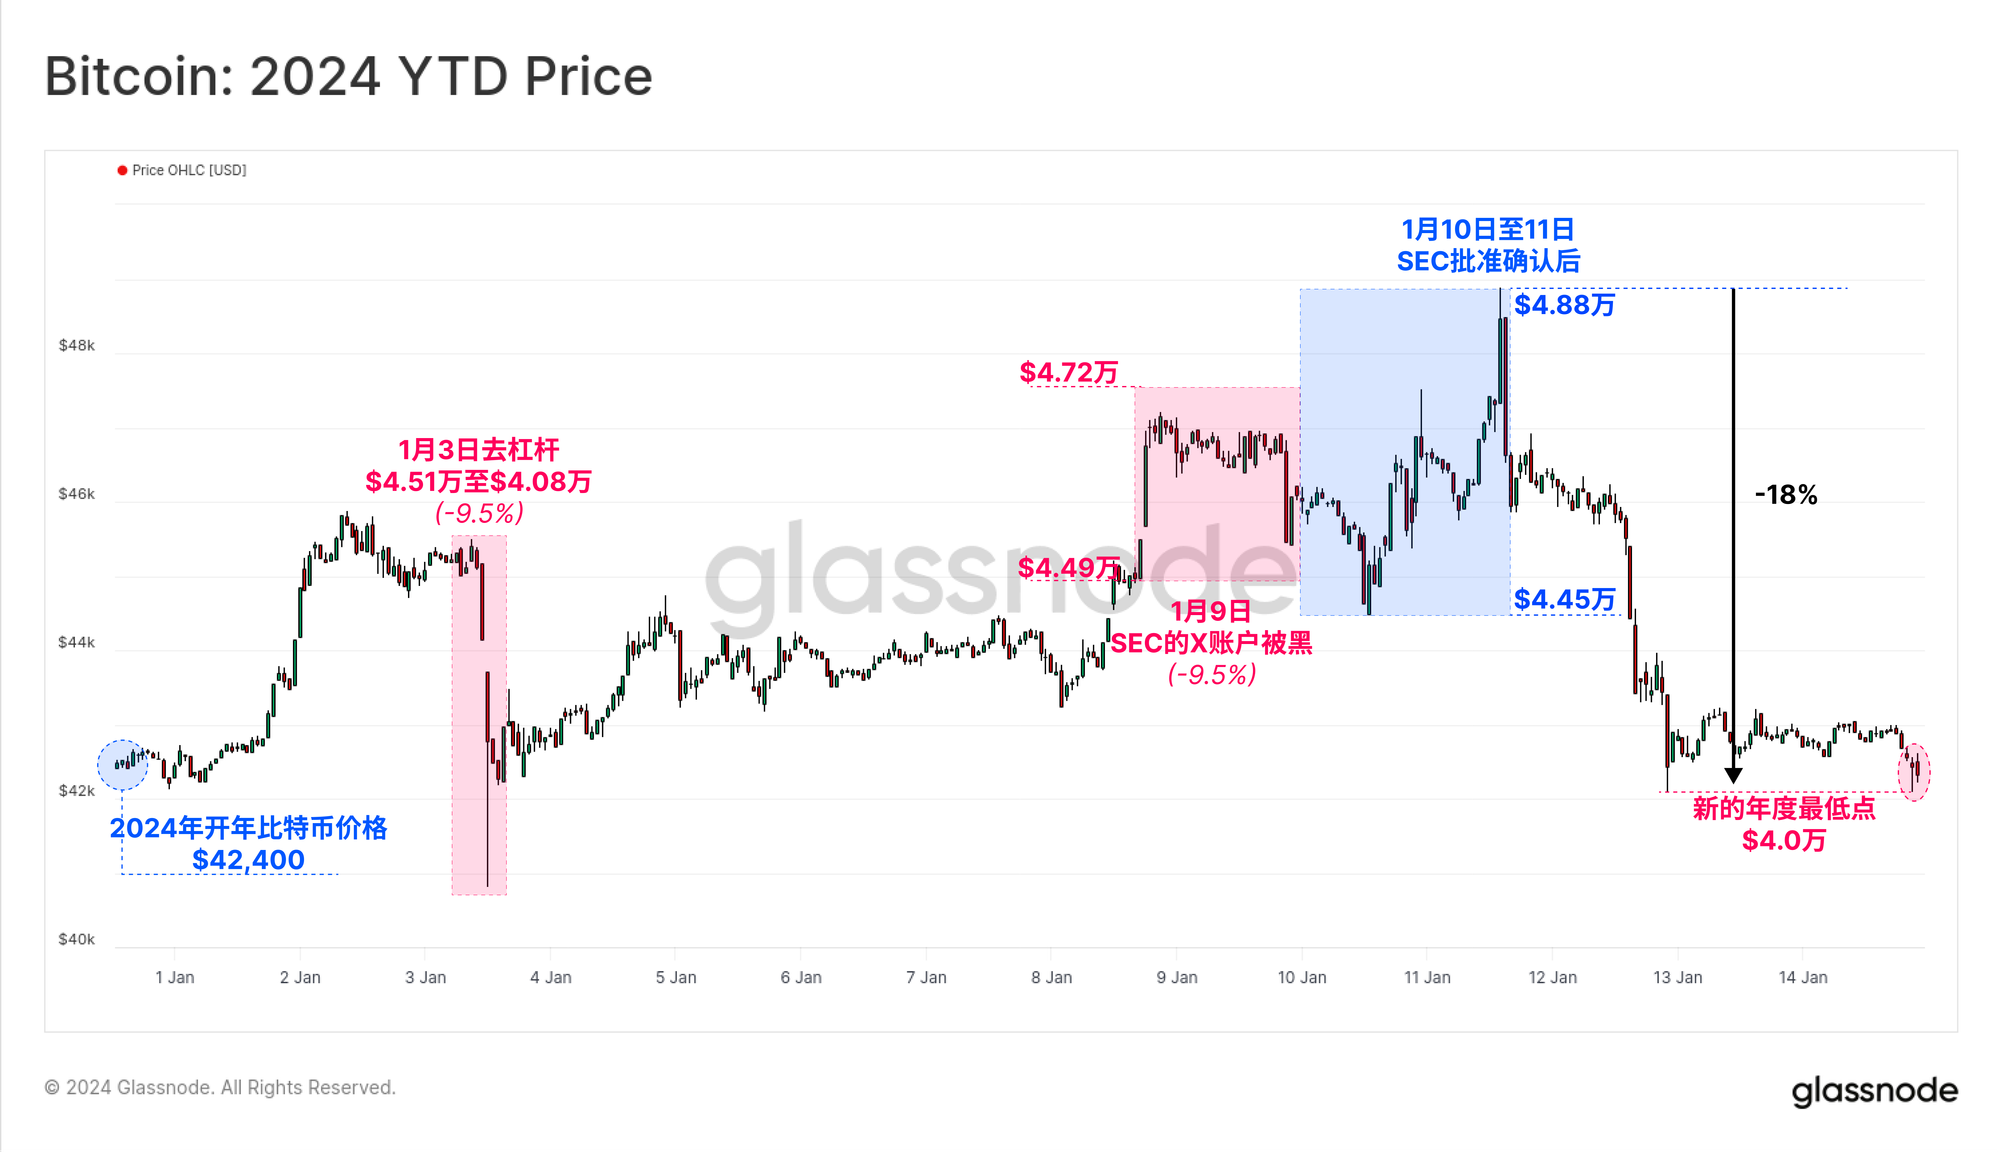
In many ways, Bitcoin has succeeded in bringing the traditional financial world and U.S. regulators into its notorious world of chaos and volatility. On January 9, the SEC’s X account was hacked and a false ETH approval notice was issued, and the ETF approval suffered a false start. The price of Bitcoin once soared to $47,200, but soon fell back to $44,500 as the real intention was revealed.
The second false launch occurred on January 10, before the U.S. stock market closed, and the real SEC approval documents were leaked from the SEC website. Finally, approval documents for all ten ETF products were finalized and trading began on January 11.
In response, Bitcoin prices hit multi-year highs near $48,800. But then the market sold off significantly over the weekend, down 18% to a new yearly low of $40,000, and Bitcoin once again welcomed Wall Street into its world.
 real time chart
Spot ETF officially launched
In the first two days of trading, the cumulative trading volume of spot ETFs reached $7.823 billion, with more than $1.4 billion in AUM inflows. This exceeds the $579 million in outflows from the now-converted GBTC ETF product, as investors reallocated funds after years of poor performance during the fund's time as a closed-end fund (and saw ETF fees fall from 2.0% to 1.5% ).
Despite these outflows, GBTC remains a significant player in the ETF market, with trading volume reaching $4.166 billion over the two trading days, accounting for 57% of the total trading volume. It is likely that funds will continue to reallocate to GBTC in the coming weeks.
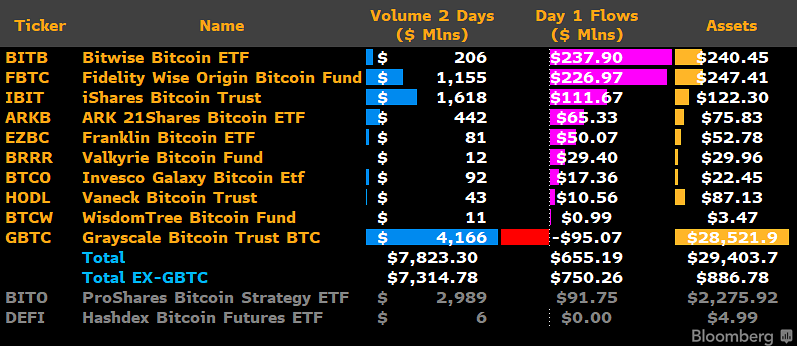 Source: James Seyffart (Blumberg)
The size of GBTC relative to other ETF products can be seen in the chart below from bitcointreasuries.net . Despite GBTC outflows, its massive holdings of 617,080 BTC dwarf its competitors, and the associated liquidity conditions remain attractive to any liquidity- and depth-sensitive traders and investors.
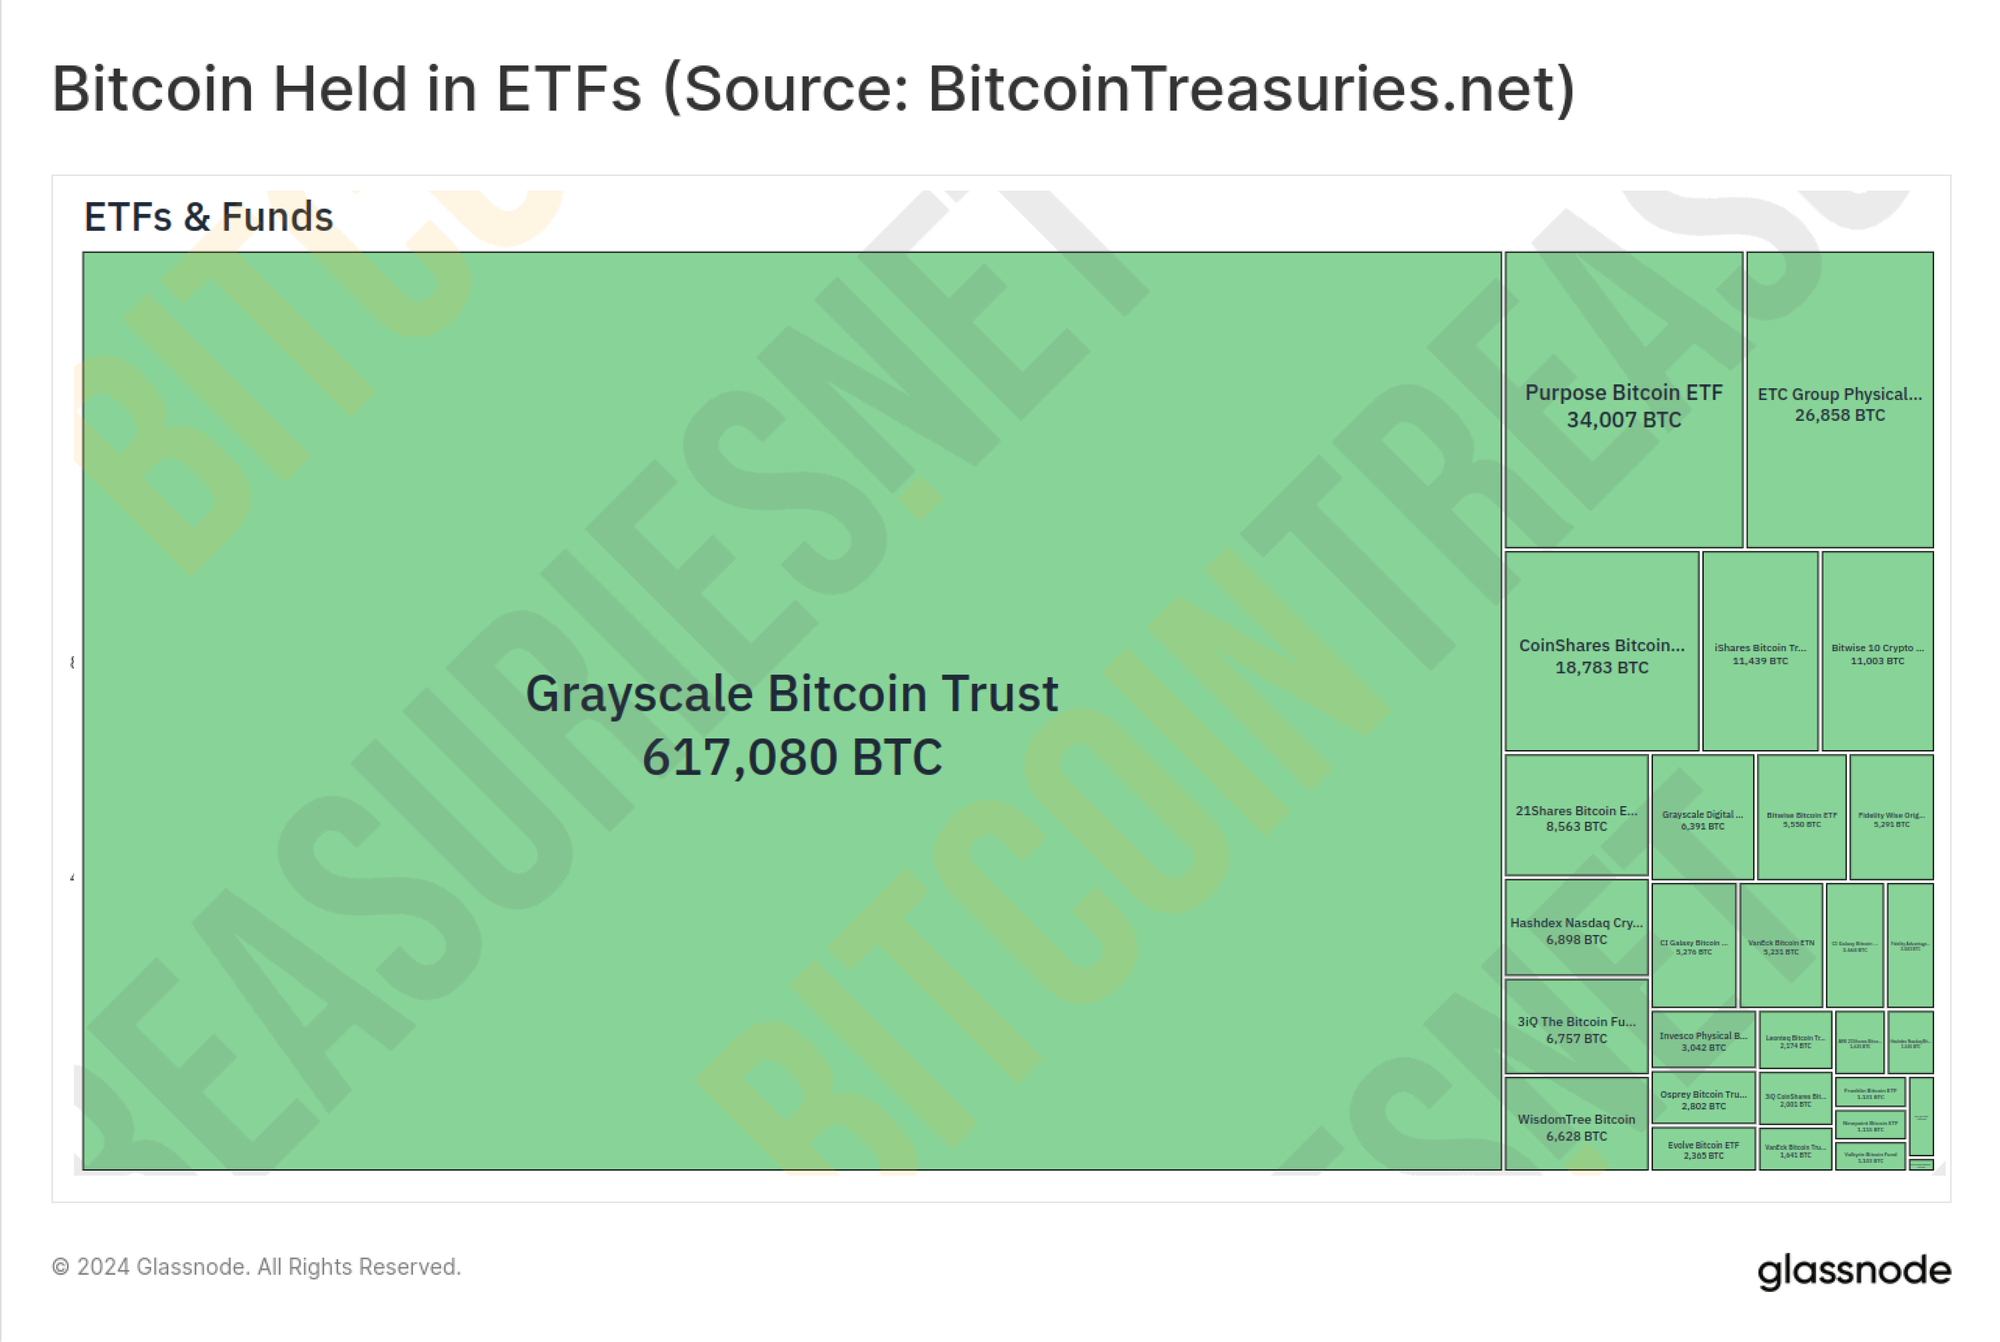 Source bitcointreasuries.net
Overall, U.S. spot ETF products now hold a total of 644,860 BTC (approximately $27.2 billion), accounting for 29.7% of global ETF holdings after just two trading days.
Collectively, these trading volumes and AUM make it one of the largest and most important ETF launches in history, marking in many ways the end of Bitcoin’s maturity and growth phase.
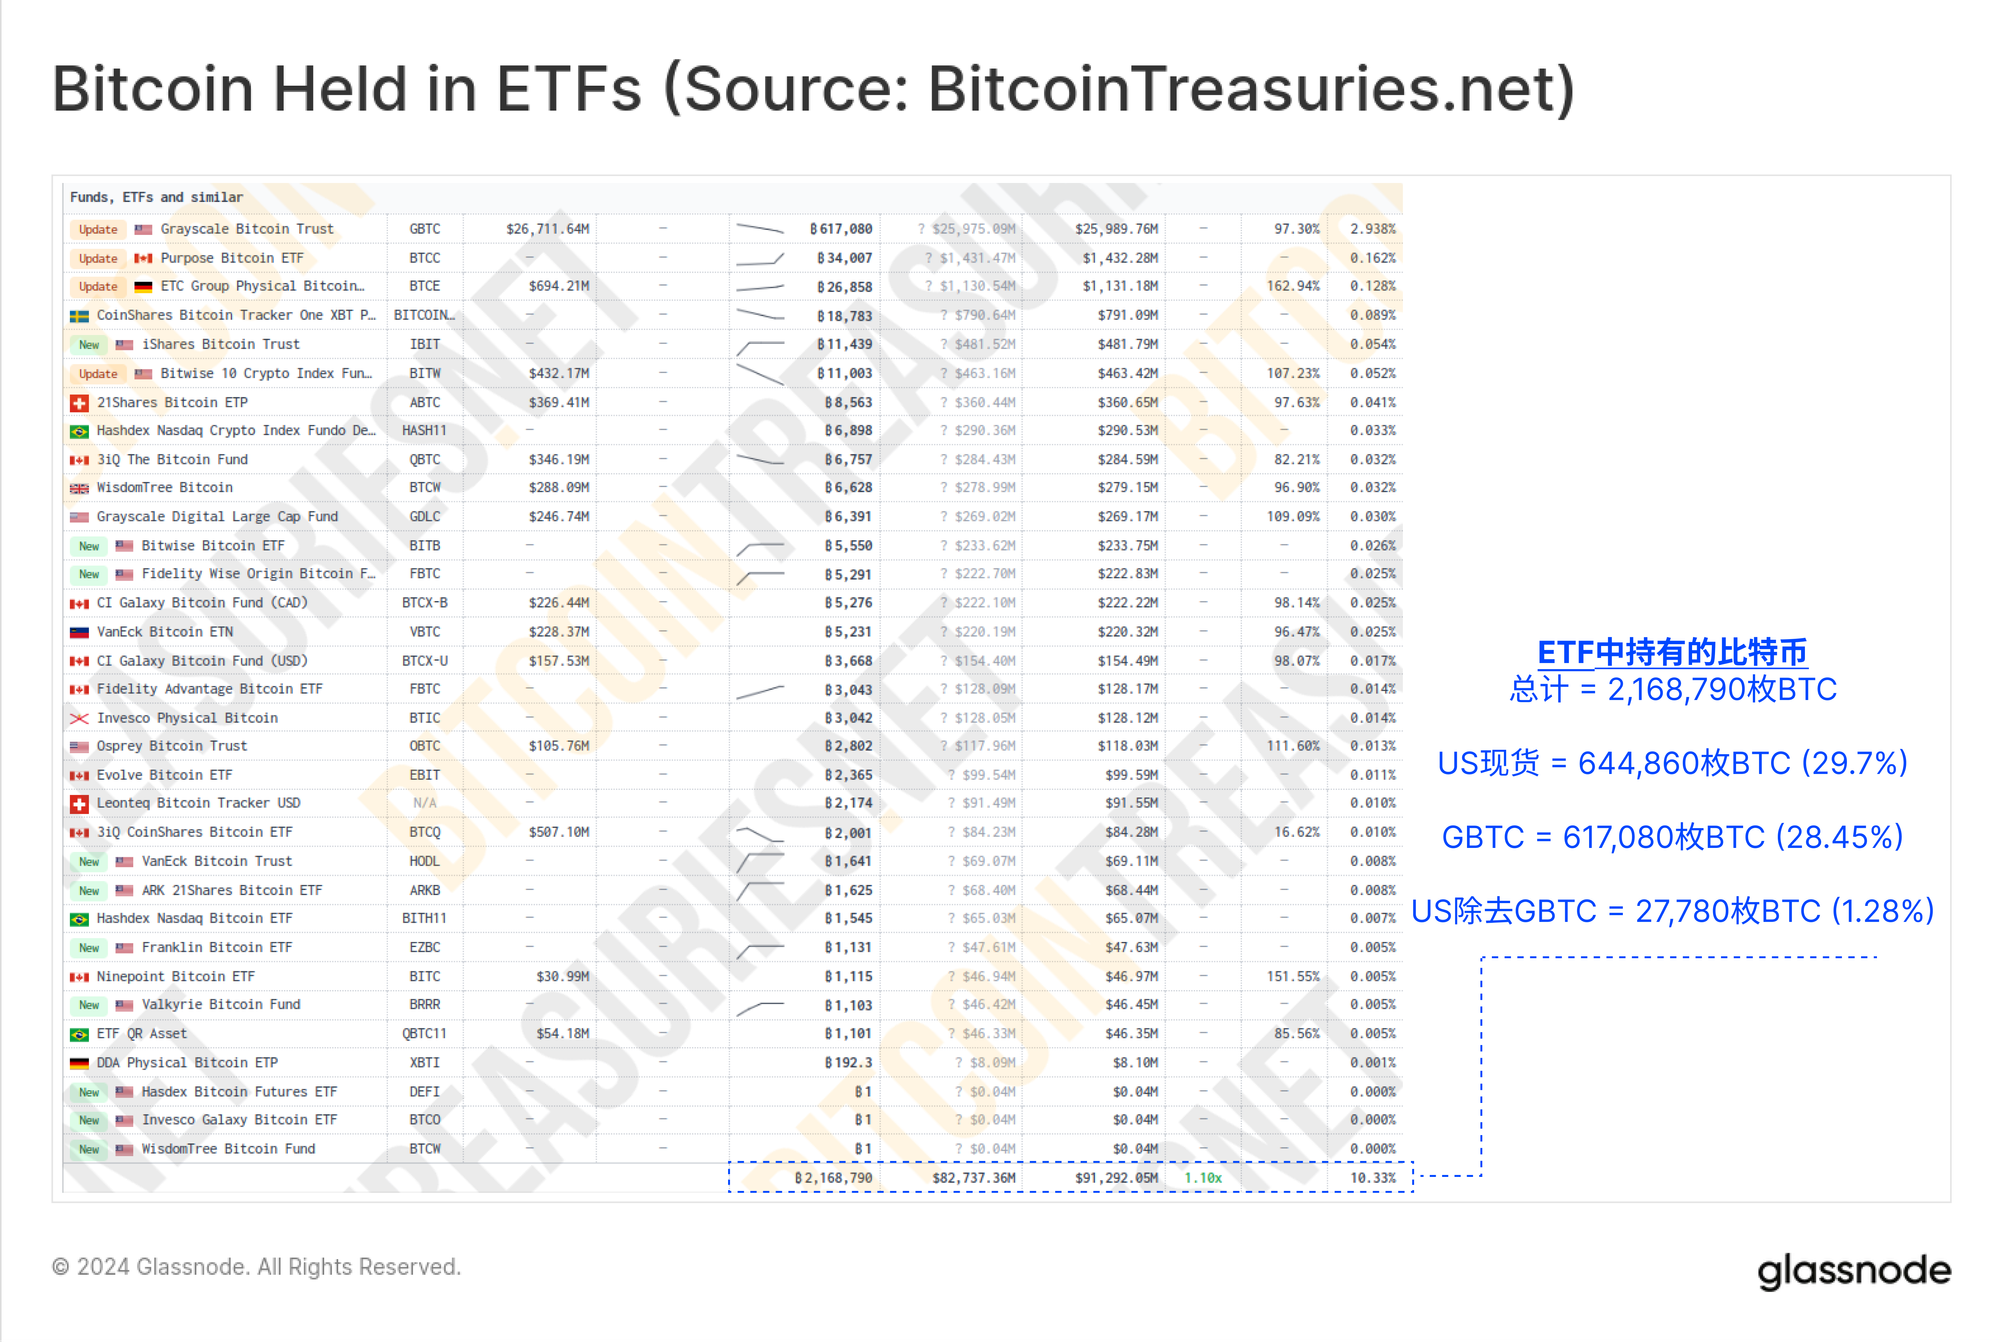 Source bitcointreasuries.net
A “sell the news” event?
Whether it’s a halving event, an ETF launch, or just any other Thursday, Bitcoin investors love to discuss whether the event was anticipated by the market. Despite significant volatility along the way, Bitcoin prices have remained essentially flat year to date, suggesting that this particular event has been priced in perfectly.
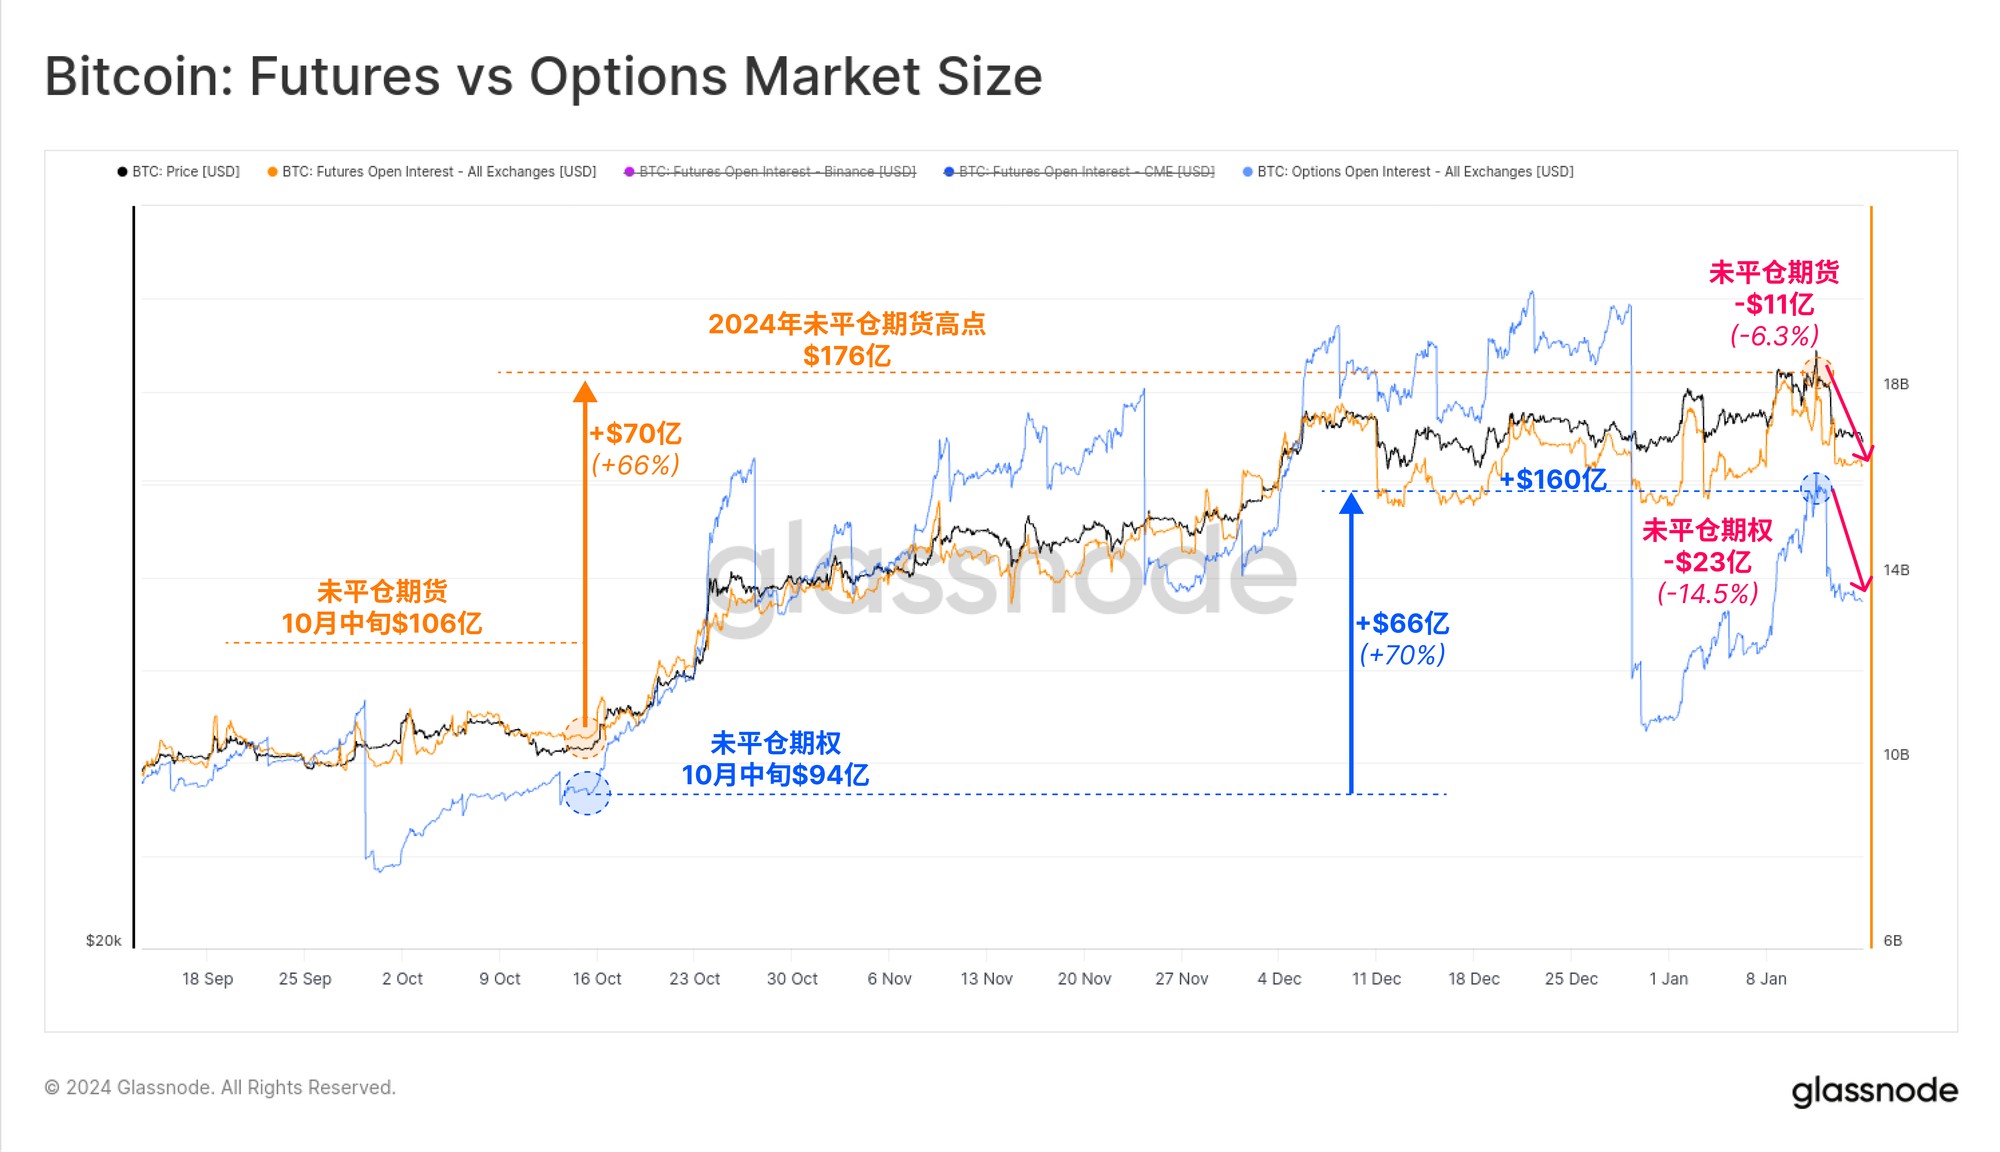
Of course, there are key drivers behind the volatility during this period, with open interest (OI) rising significantly in both futures and options markets since mid-October:
- 🟠 BTC futures OI increased by $7 billion (a 66% increase), with $1.1 billion liquidated this week.
- 🔵 BTC options OI increased by US$6.6 billion (an increase of 70%), and US$2.3 billion was liquidated this week due to contract expiration and position closure.
Open interest in both markets remains near multi-year highs, indicating that rising leverage levels are becoming a dominant force in the market.
 real time chart
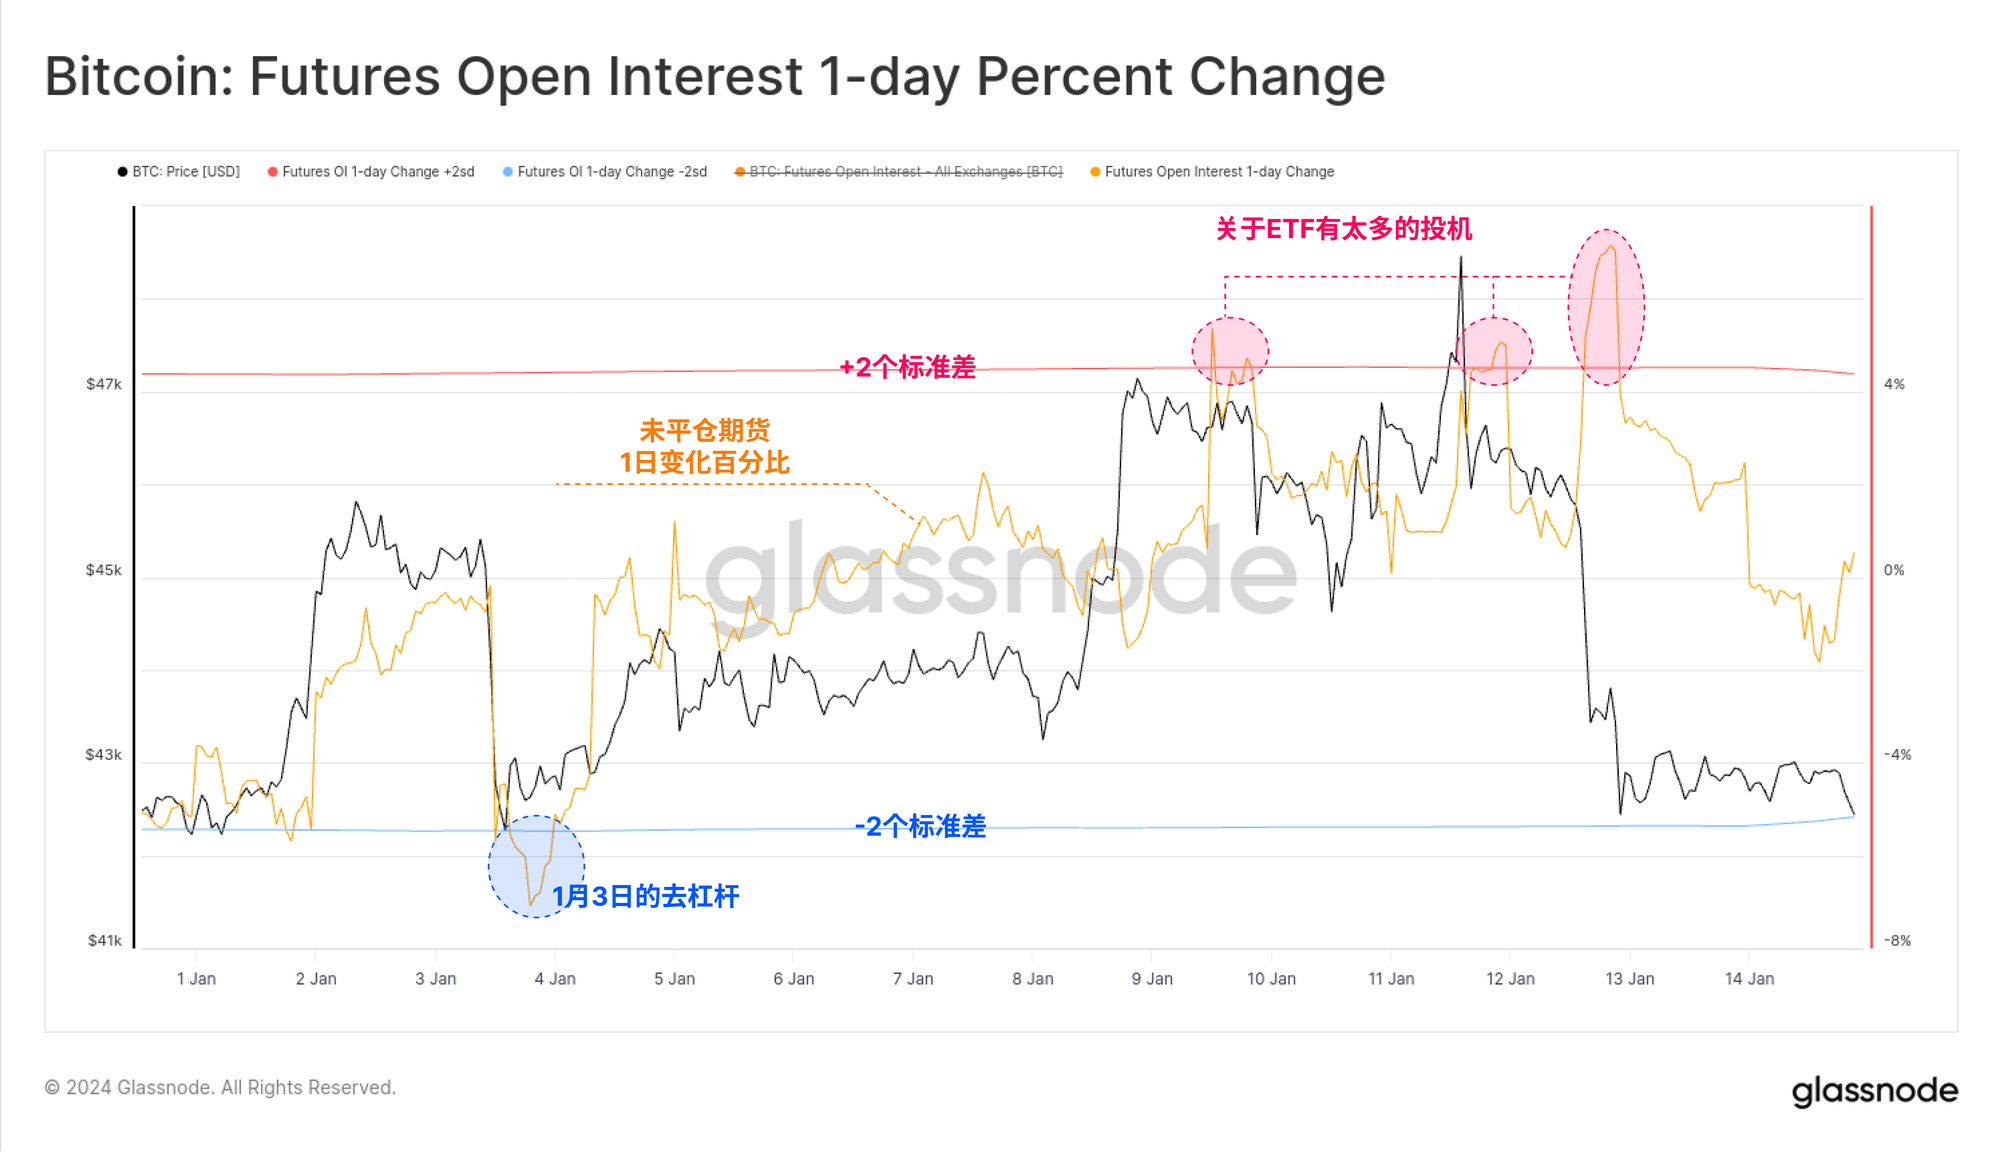
The chart below shows the oscillator for the percentage change in futures open interest. This tool can be used to spot periods of rapid change in total market leverage.
- 🔴High values indicate an increase in OI of +2 standard deviations.
- 🔵Low values indicate a -2 standard deviation drop in OI .
We can see that a major deleveraging event occurred on January 3, with nearly $1.5 billion in OI liquidated in a single day. Instead, between January 9 and 11, as ETF speculation peaked, OI increased significantly, with prices approaching $49,000.
This was followed by a sell-off over the weekend, with the price falling back to $40,000, and new ETF shareholders being introduced to Bitcoin’s round-the-clock trading environment.
 real time chart
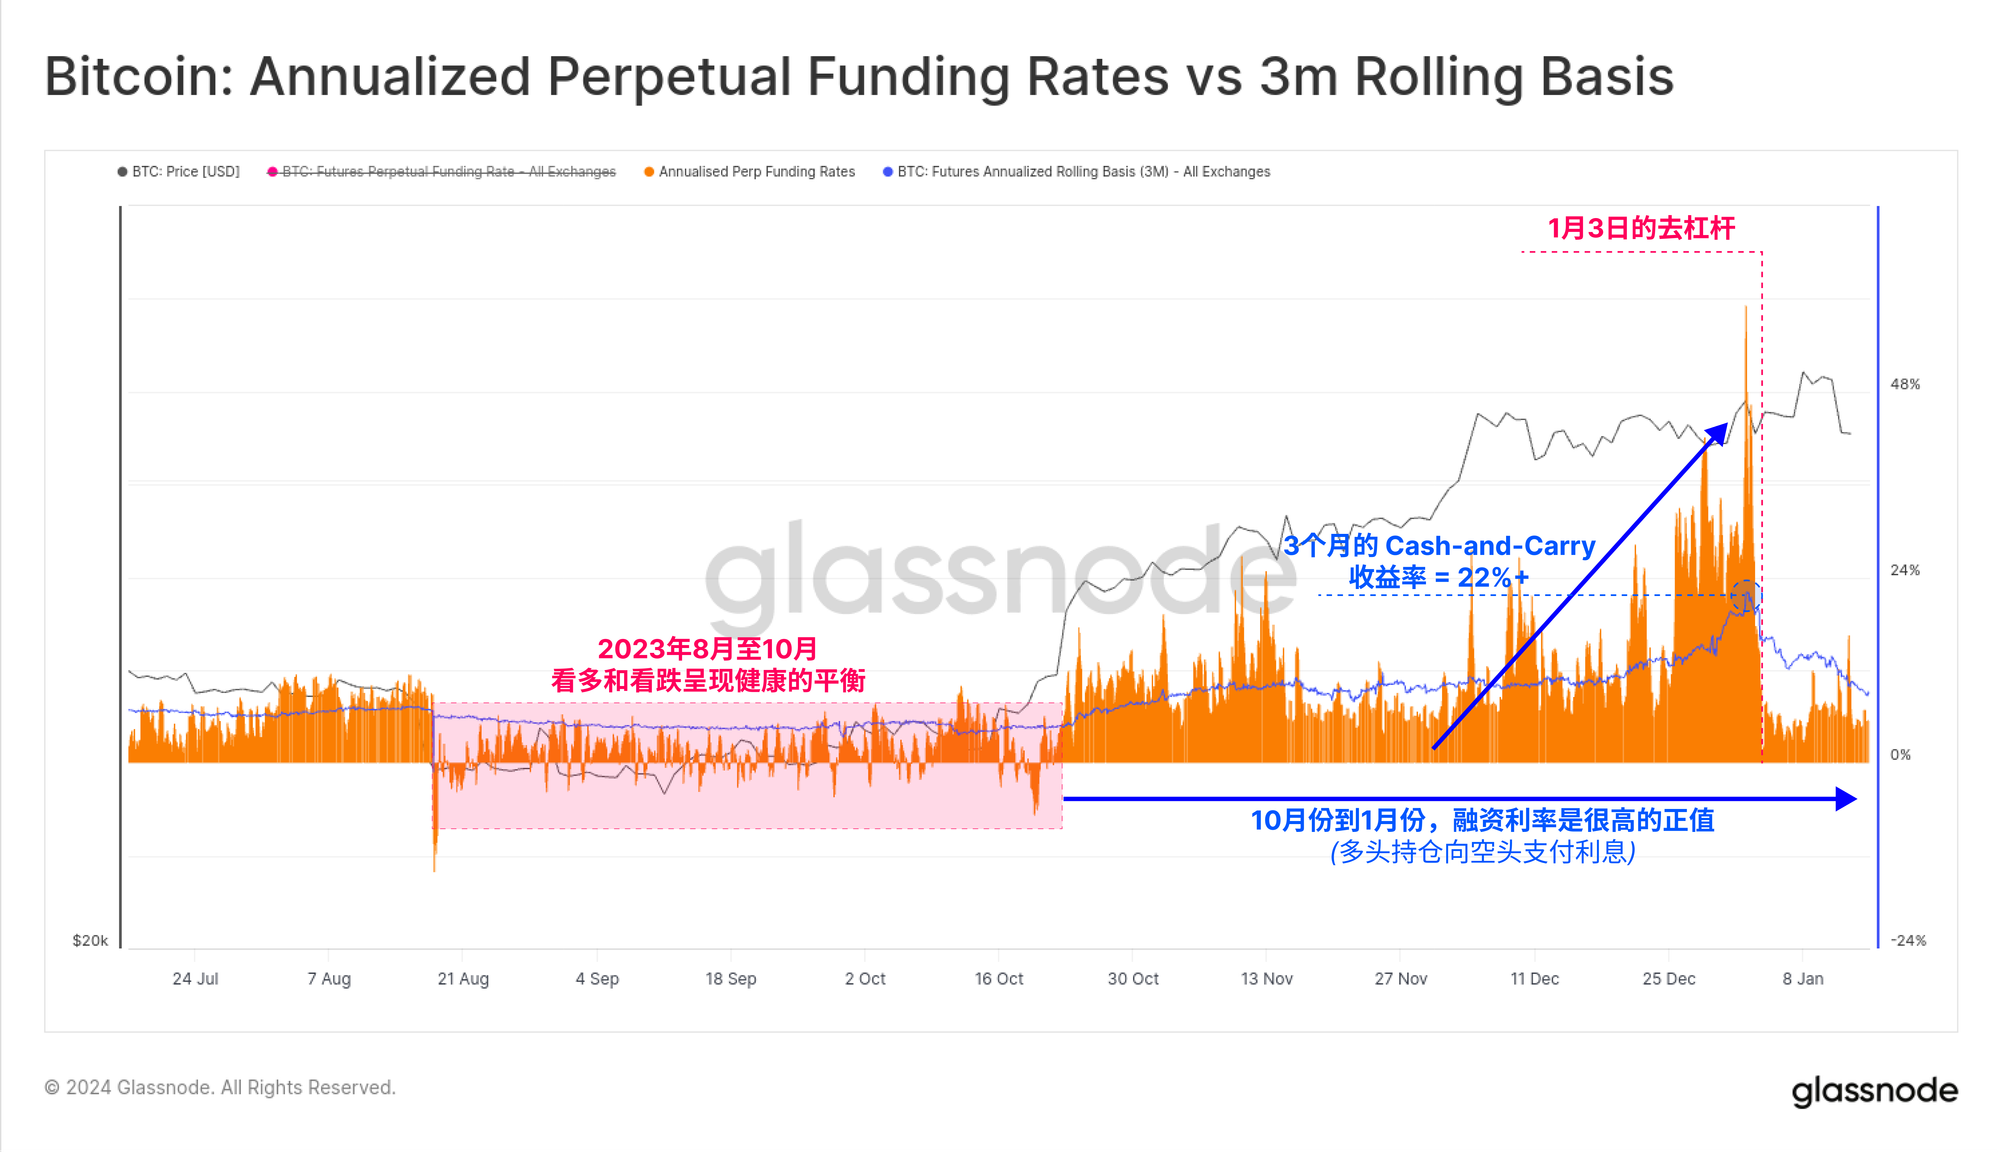
Perpetual funding rates have also maintained a strong positive bias, indicating that leveraged traders are net long, with annualized returns paid to shorts sometimes exceeding +50%. We can also see a clear phase shift in mid-October, that is, the funding rate changed from a structure around neutral shocks to a sustained positive value.
Funding rates have fallen back this week, but overall they remain positive.
 real time chart
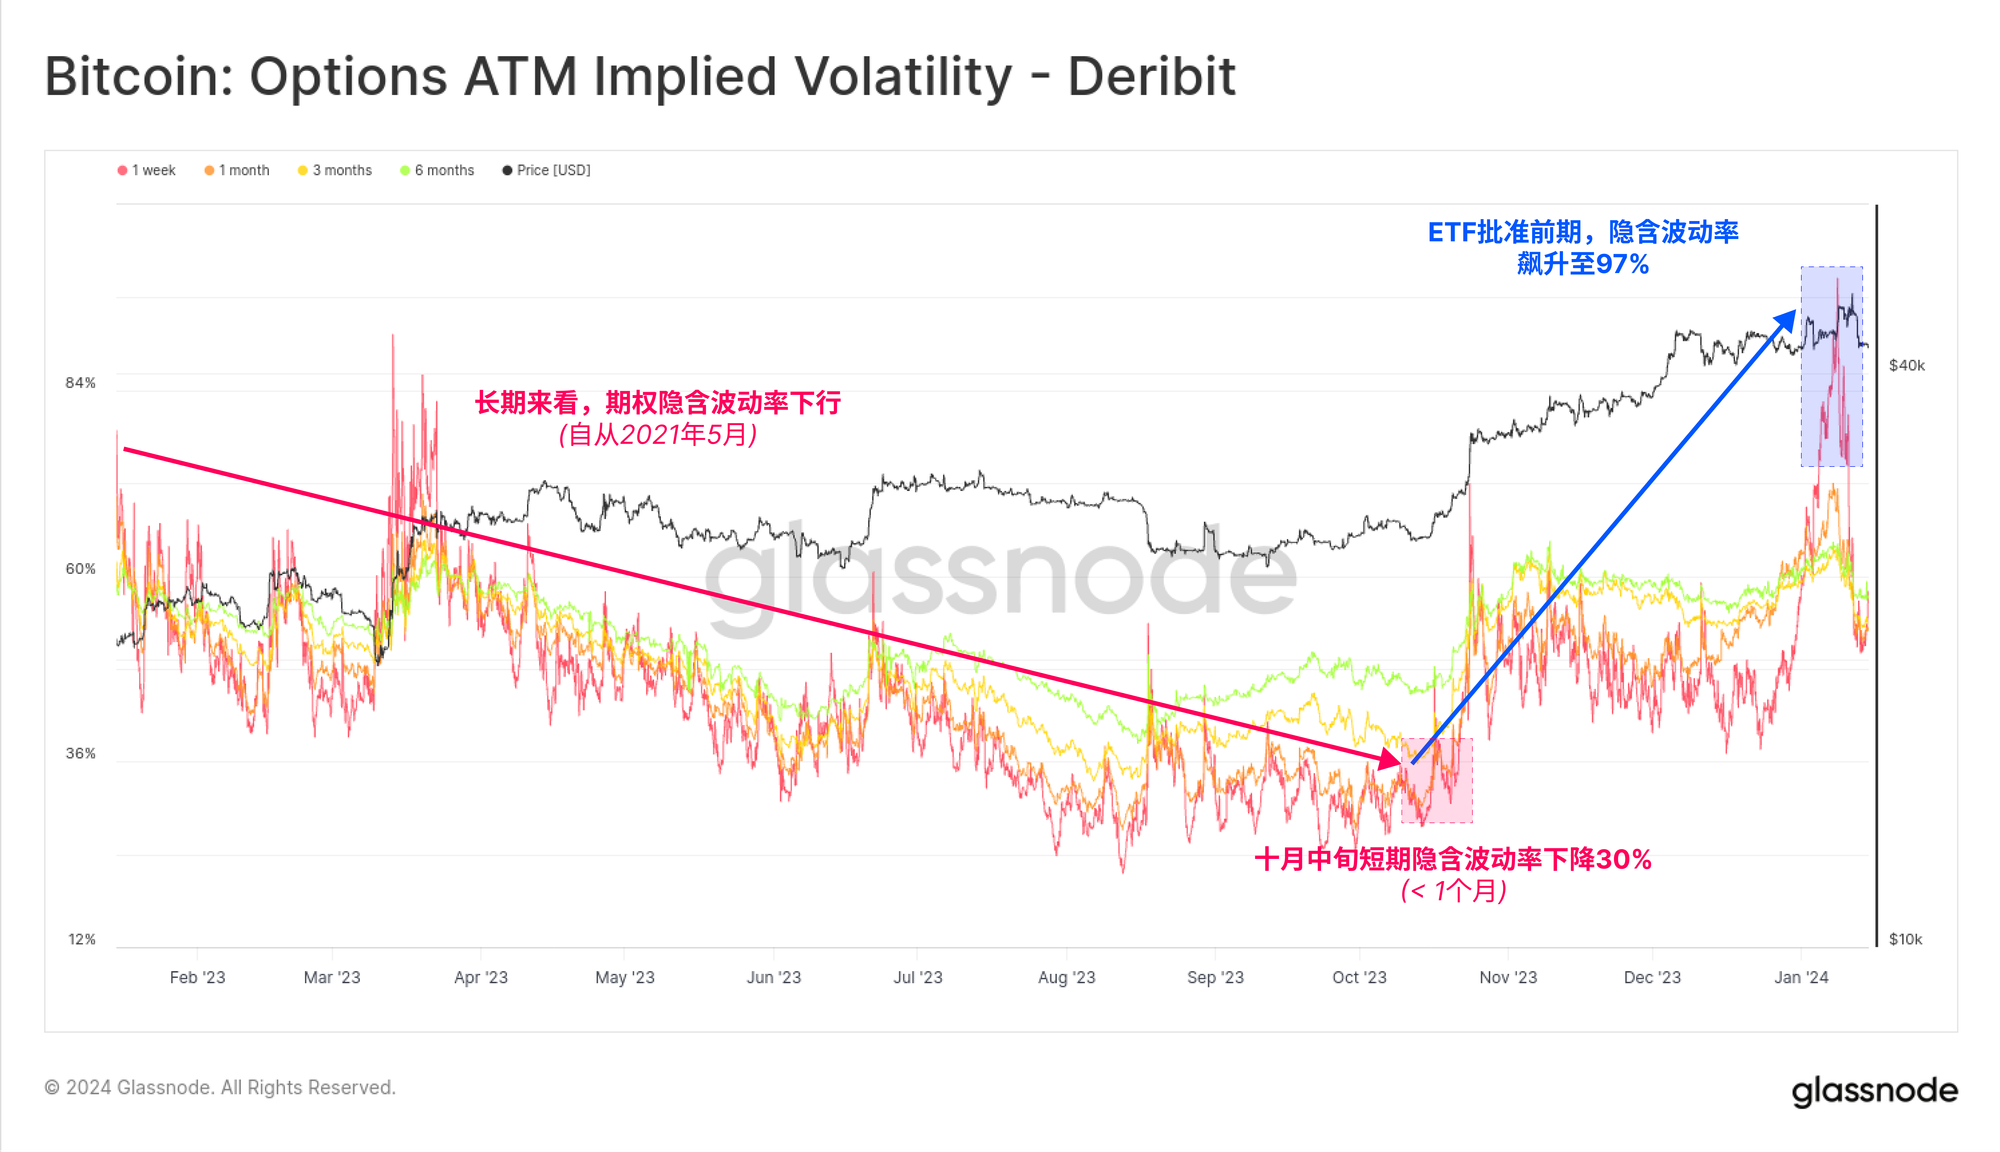
Options implied volatility has also reversed course since mid-October, rising sharply amid this week's chaotic events. Implied volatility has been declining for years since May 2021 as market interest wanes during the bear market. It is also worth noting that the infrastructure, liquidity and depth of the options market have matured significantly in 2023, with open interest currently on par with the futures market (see Weekly Report for Week 51 of 2021 ).
This downward trend appears to have reversed recently, with implied volatility more than tripling from October lows of around 30% to over 97% this week. Bitcoin’s volatility characteristics may also begin to evolve as spot ETF products open new doors for institutional and retail capital.
 real time chart
Old Bitcoin, new holders
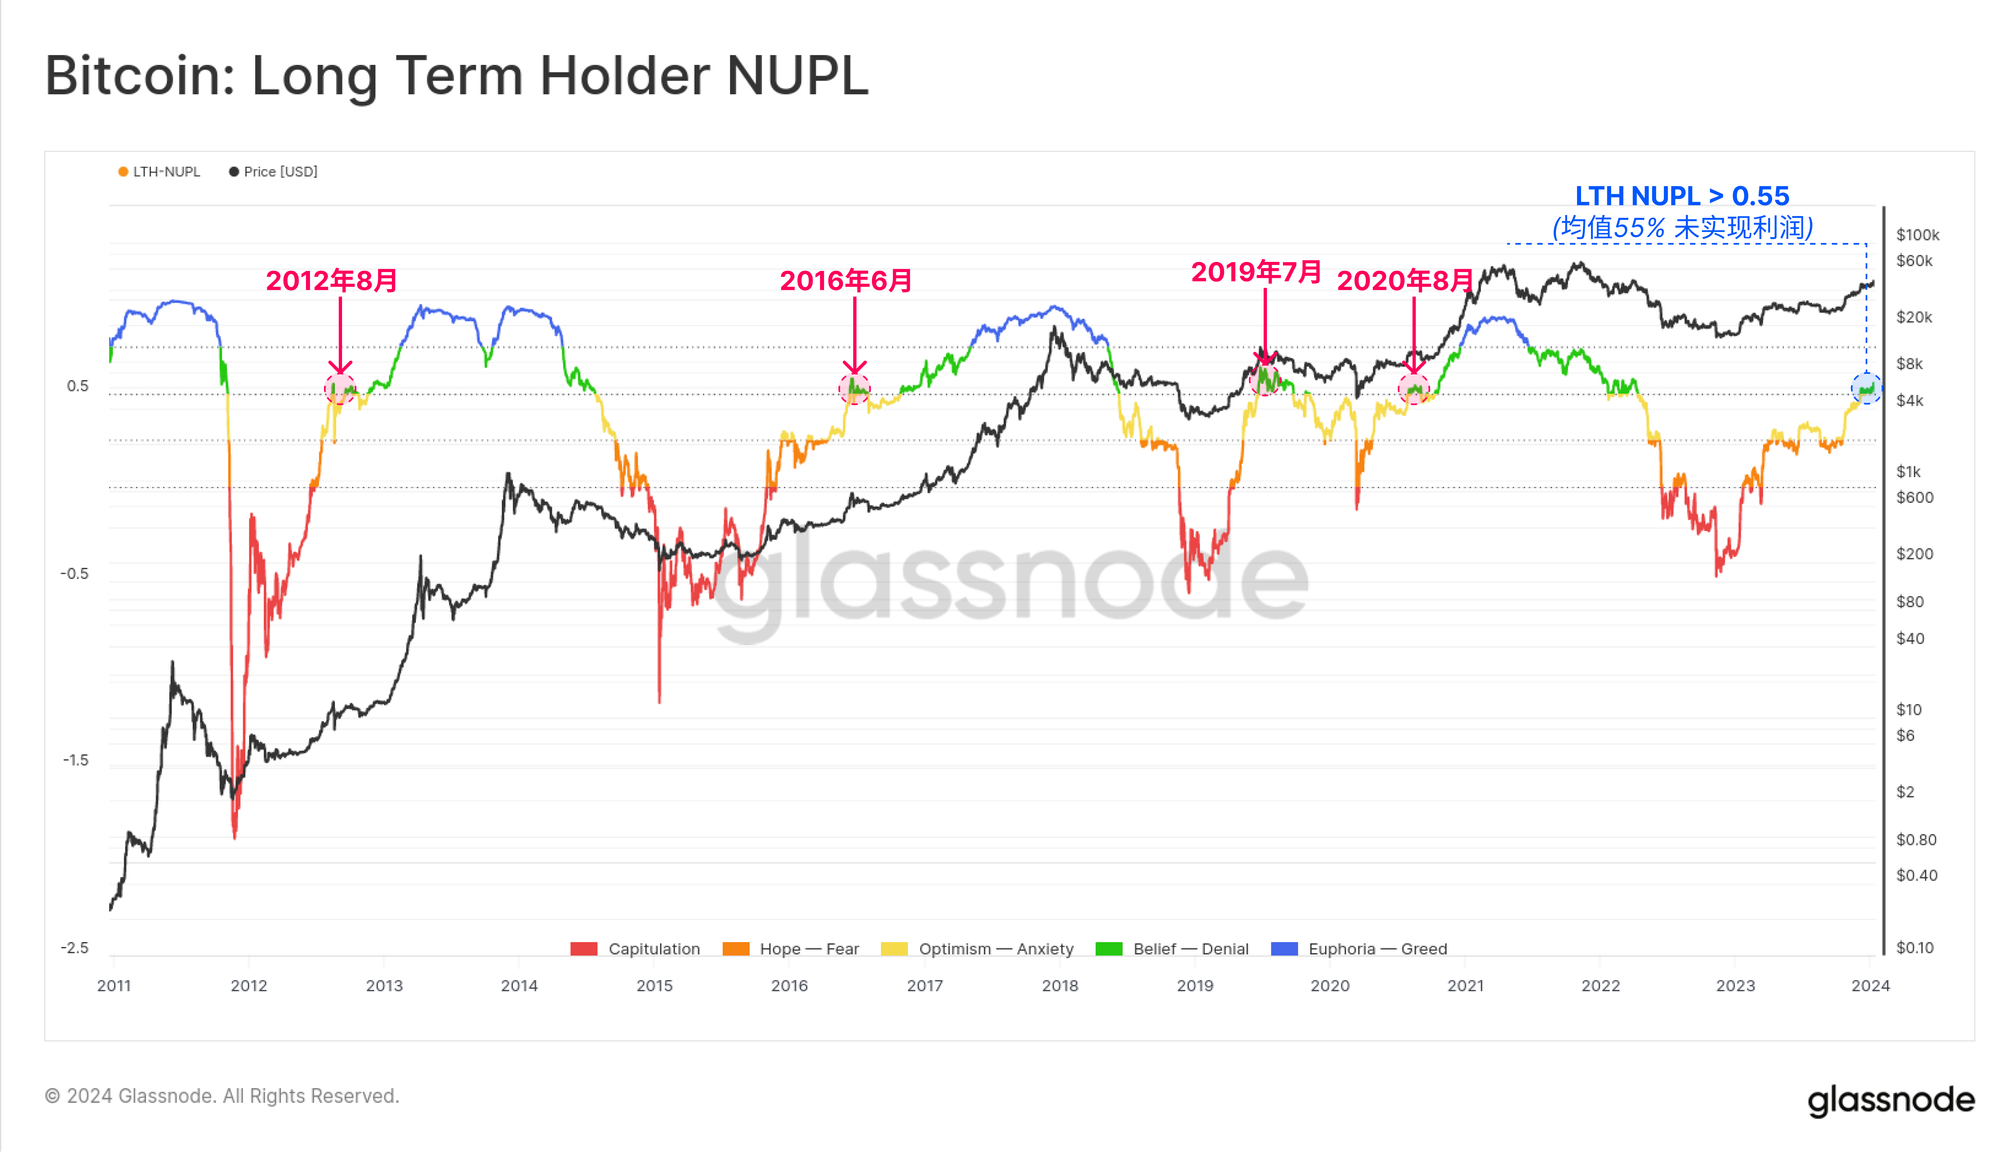
For long-term holders, their long-term inactive Bitcoin holdings often react during major events in the market. This includes when markets hit new all-time highs, cycle tops and bottoms, and when there are significant changes in market structure (such as Mt Gox, halvings, and now spot ETF launches).
The unrealized profits and losses of these long-term holders can be measured by the LTH-NUPL indicator. This week the indicator reached 0.55, a meaningfully positive level that means the average long-term investor has 55% unrealized profits.
This is also a level where the Bitcoin bull market has encountered significant resistance in previous cycles.
 real time chart
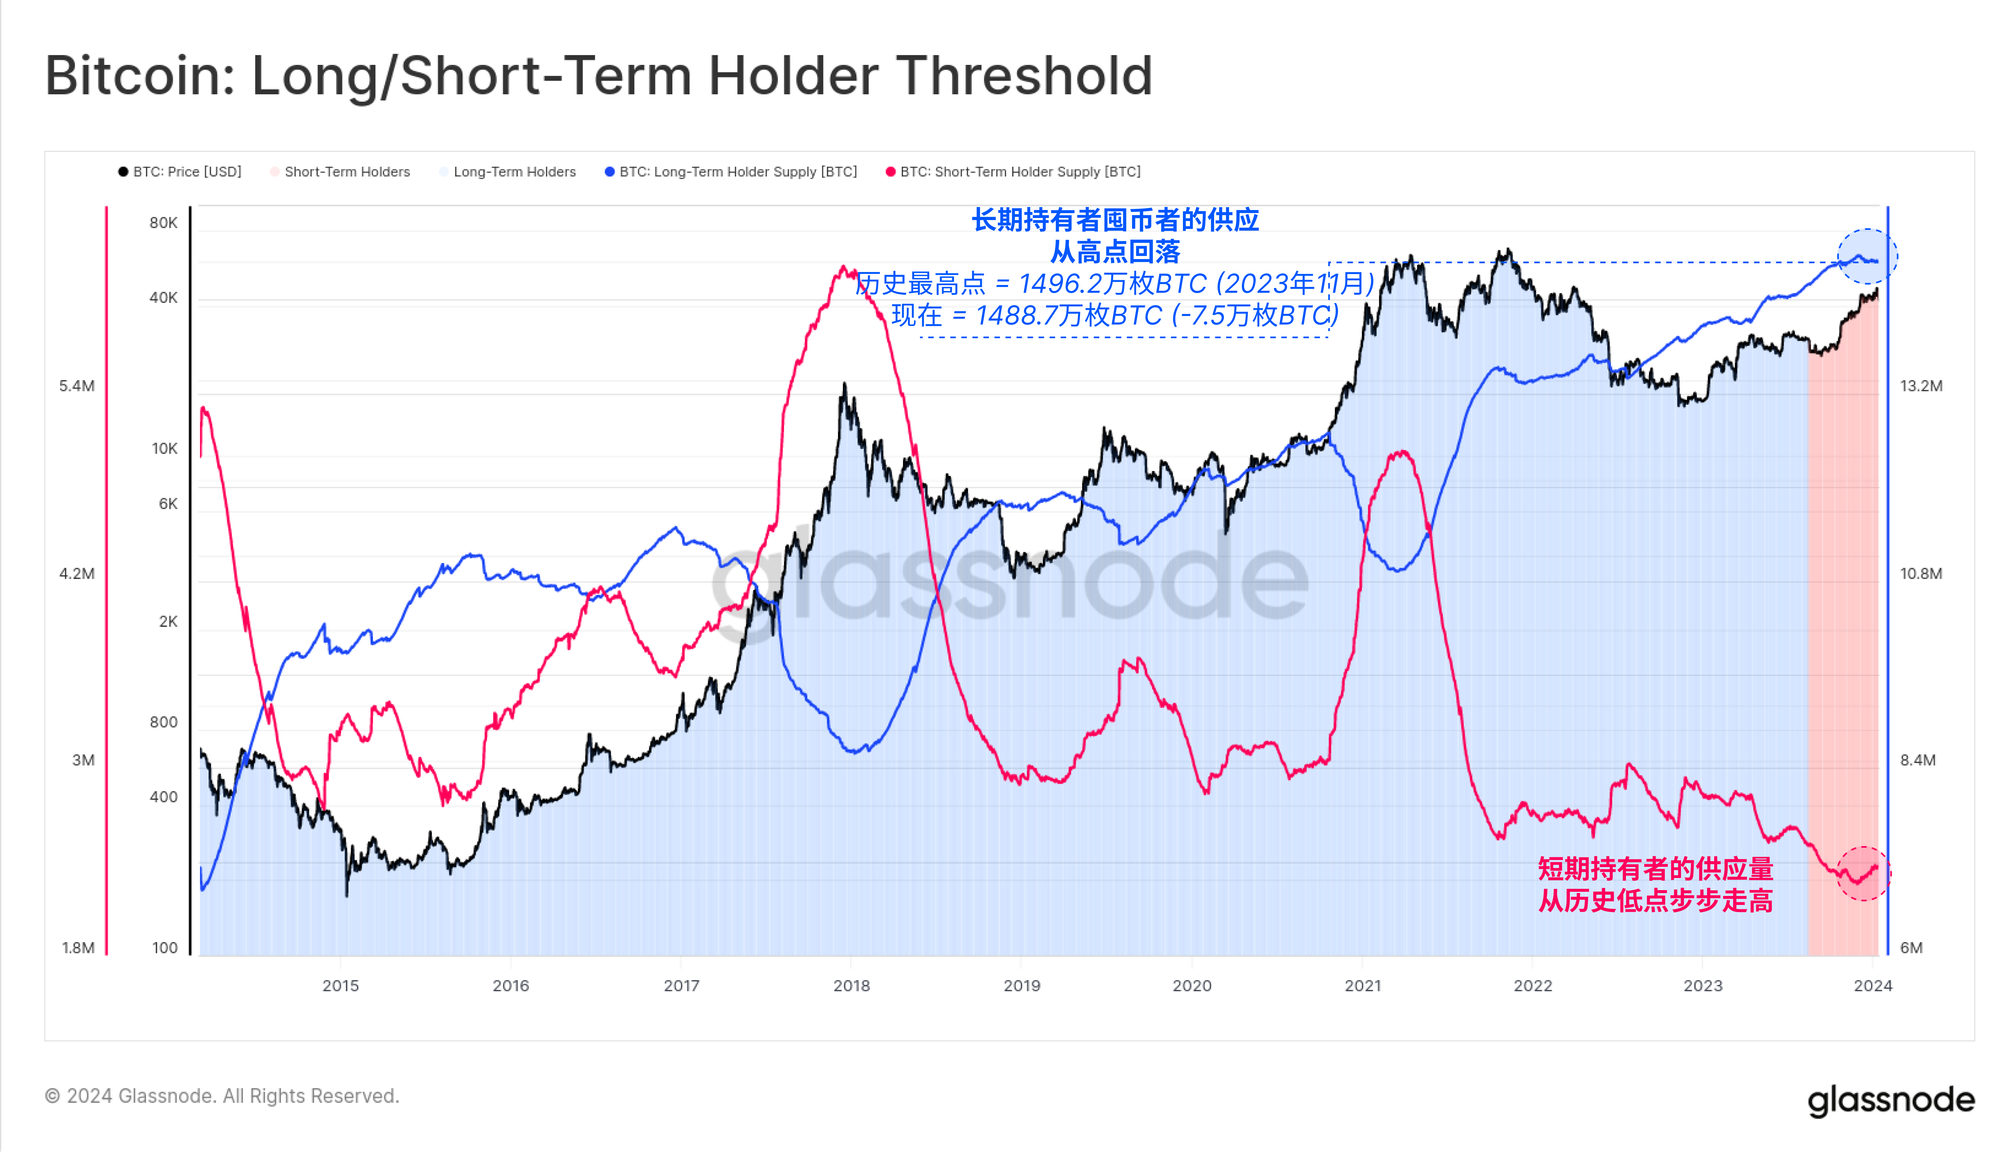
The long-term holder supply has also declined slightly from its all-time high, down by around 75,000 BTC since November, as older Bitcoins are used to take profits.
While 75,000 BTC is a significant amount, it should also be viewed in the context of the long-term holder supply accounting for a staggering 76.3% of the circulating Bitcoin supply. The opposite metric, short-term holder supply, had only just risen from its all-time low when these expenditures occurred (already covered in the 2023 Week 46 Weekly Report ).
 real time chart
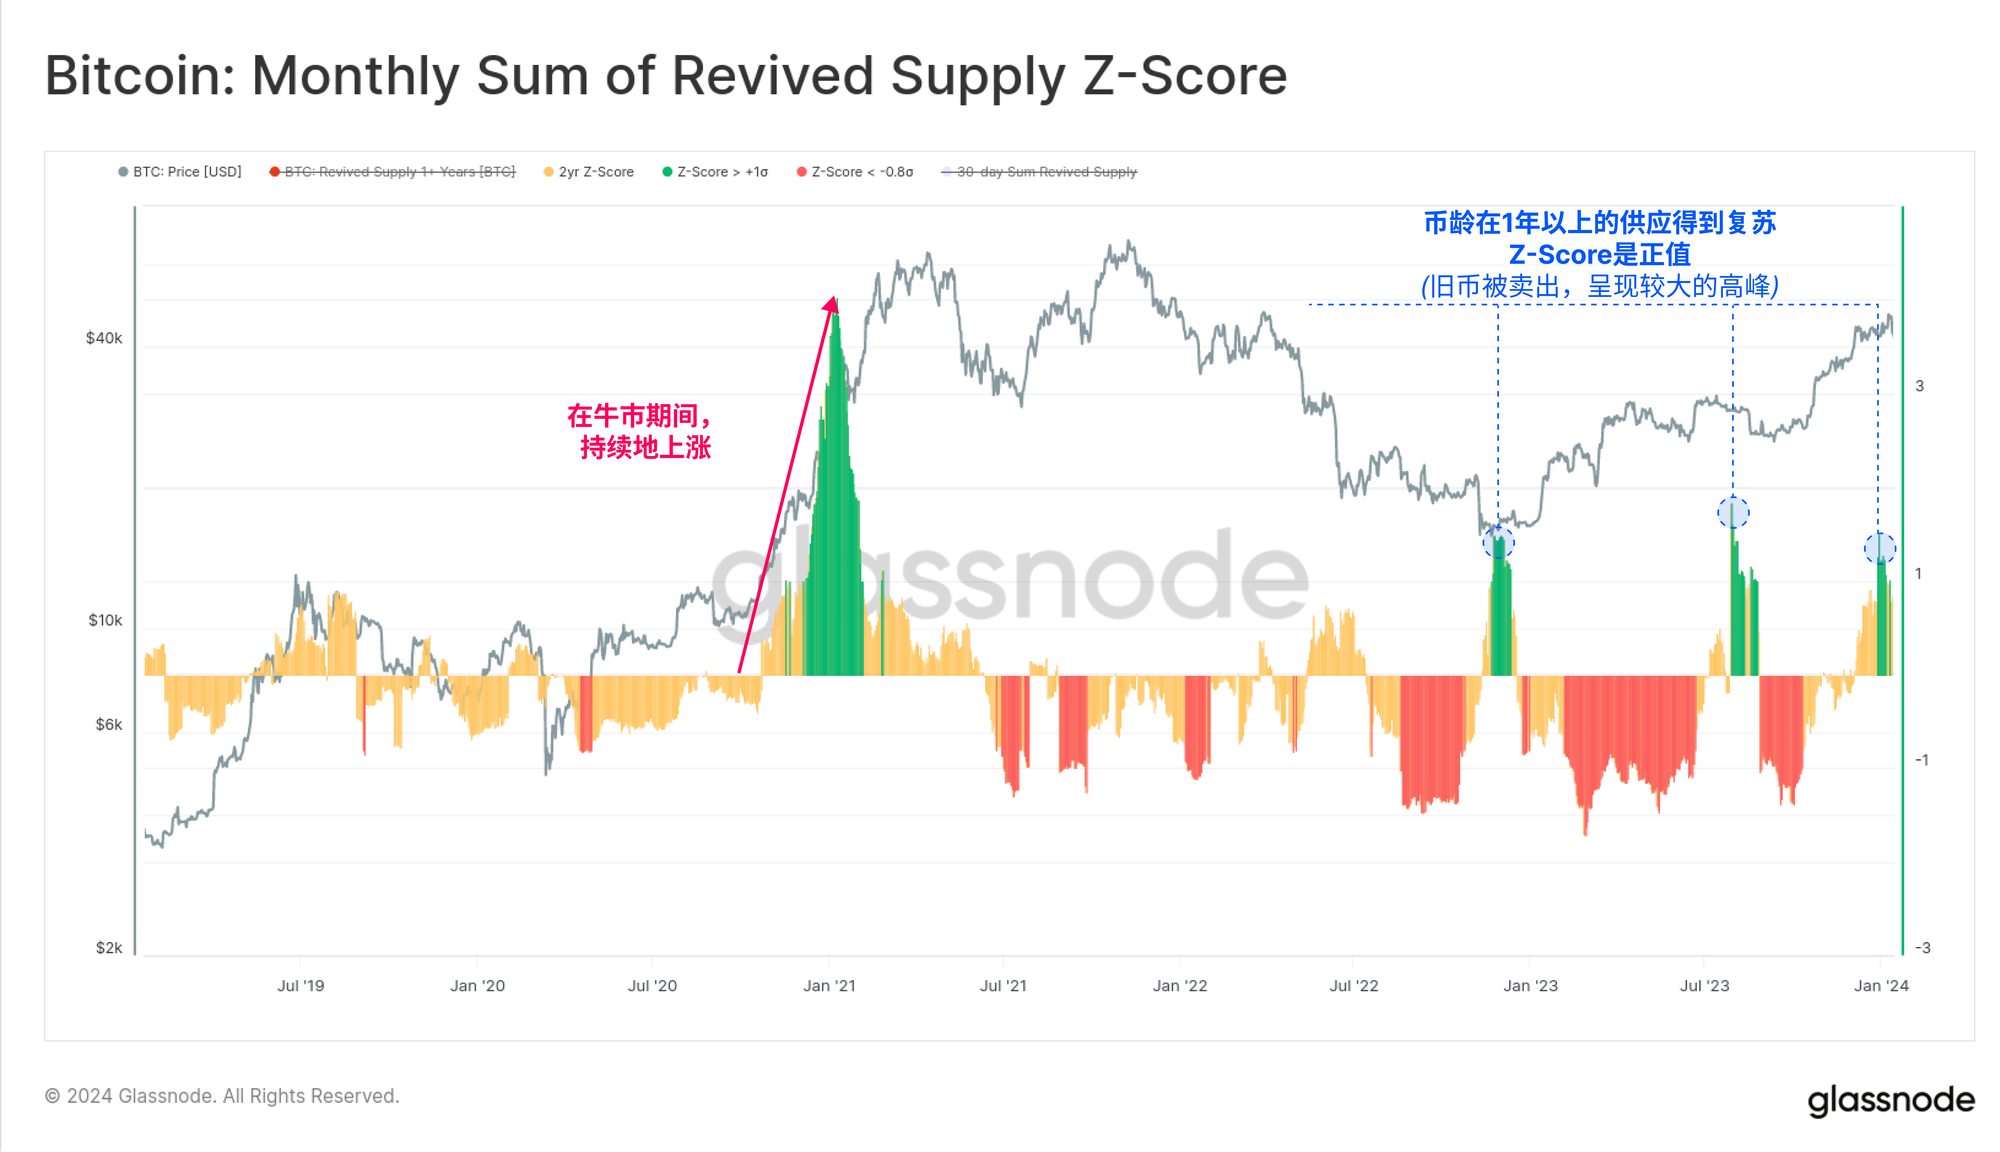
Nonetheless, the volume of sales by these veterans was statistically significant, resulting in a +1 standard deviation increase in the "recovery supply" (Bitcoins over 1 year old).
As we can see in the chart below, such events are relatively rare but tend to coincide with an uptrending market encountering meaningful resistance.
 real time chart
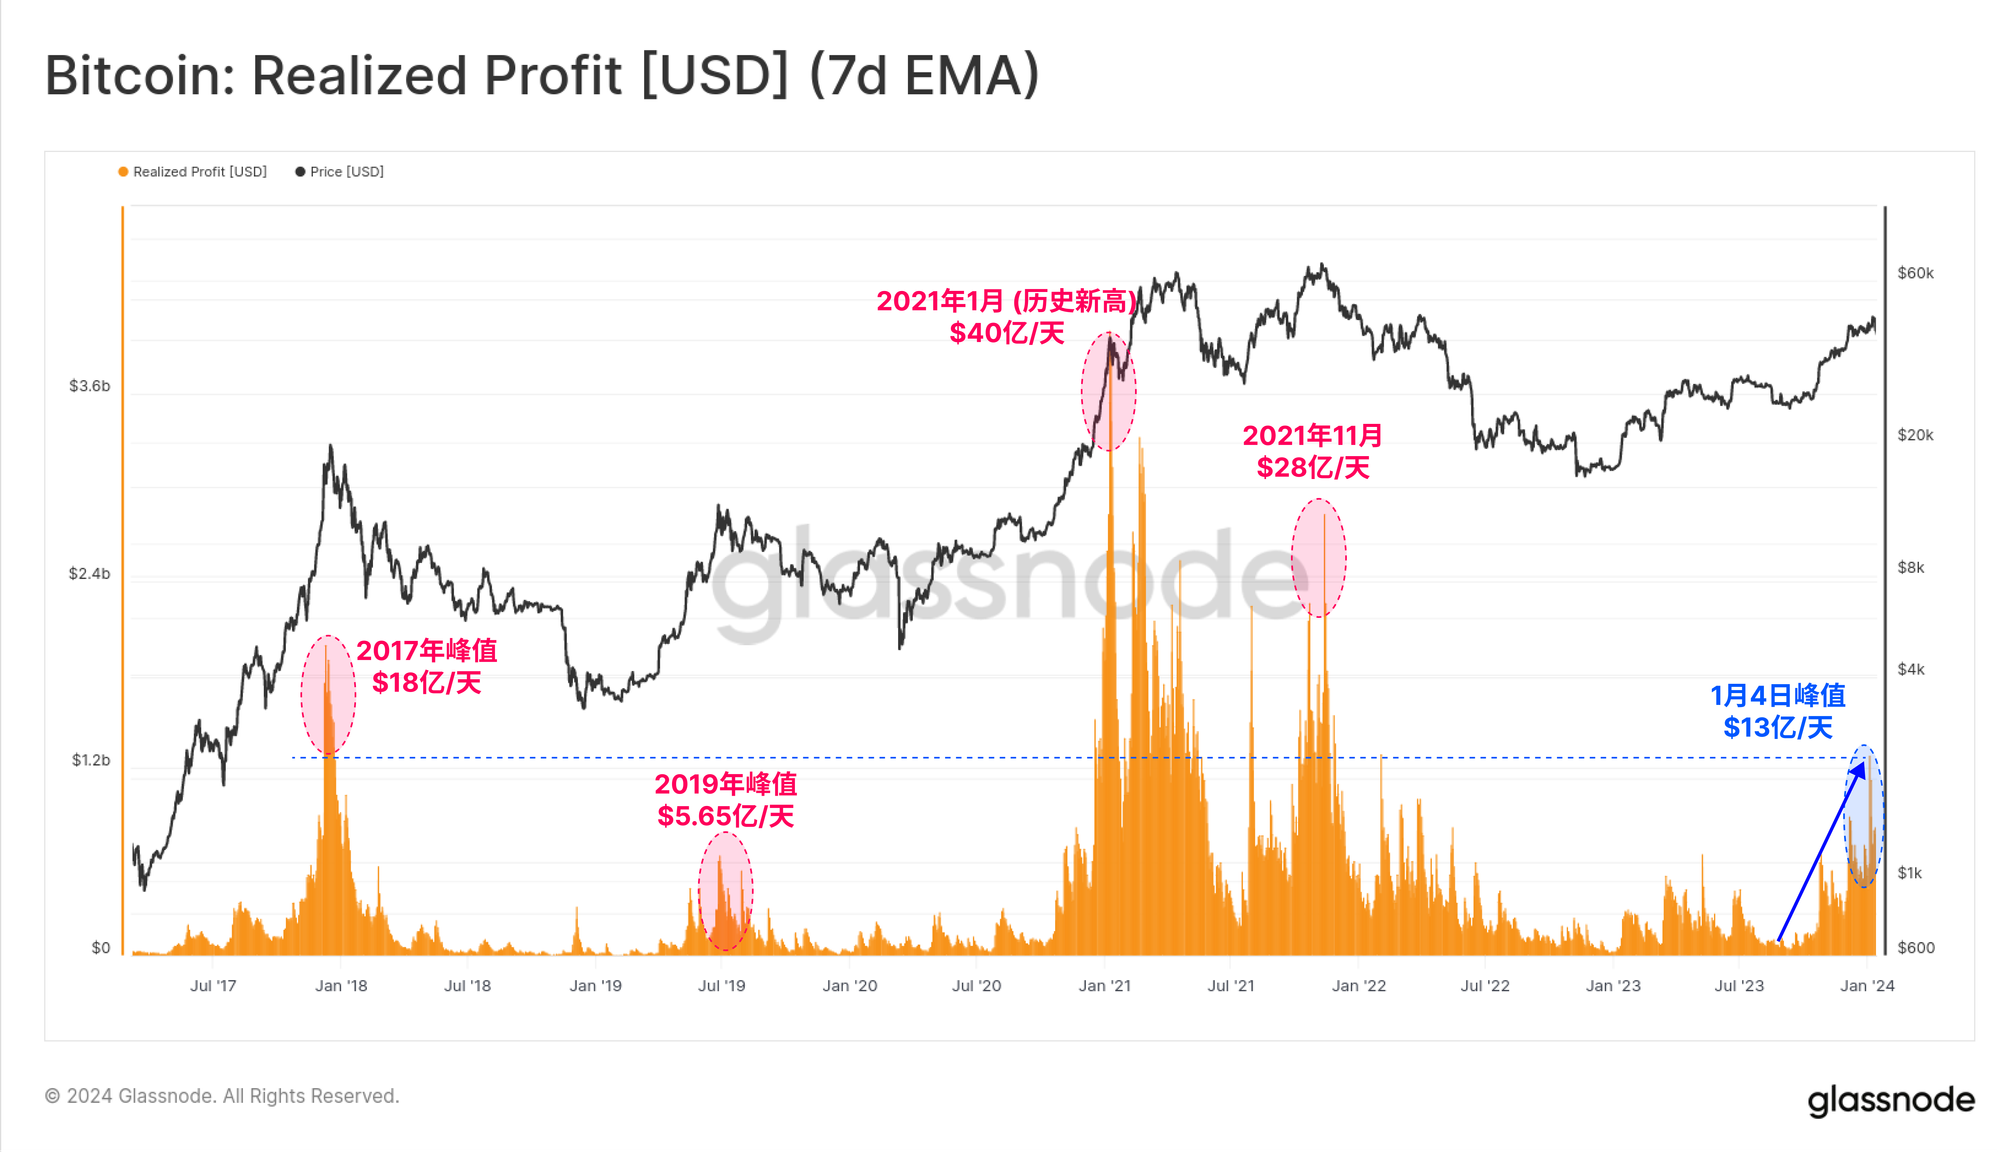
As these older Bitcoins return to circulation, they contribute to the largest profit-taking event since the previous all-time high in November 2021. The peak of realized profits for this cycle occurred on January 4, with more than $1.3 billion in profits locked in every day, and Bitcoin changing hands at a higher cost price.
Profit-taking is the norm during market uptrends, and the real question is whether the influx of new demand will be enough to absorb it all.
 real time chart
Summary and conclusion
This past week has been historic, both literally and figuratively. These new spot Bitcoin ETFs set a new record in size and are the culmination of a decade of industry efforts. After more than a decade of hard work against a backdrop of significant political, regulatory and financial headwinds, spot ETFs have finally reached the finish line.
These spot Bitcoin ETFs began trading, poetically, on the 15th anniversary of Hal Finney first tweeting “Run Bitcoin” on January 11, 2009. The first Bitcoin transaction between Satoshi Nakamoto and Hal occurred the next day, January 12, 2009.
Several indicators in the on-chain and derivatives space suggest that a significant portion of Bitcoin investors are indeed viewing this as a “sell the news” event. The key question going forward is whether demand inflows from ETFs, expectations of the April halving, or demand from humble and reliable HODLers will be enough to break through this resistance.
ETFs may be priced in, but how long can they last?


