

Q2/2024 may be the period when market Capital ends its sideways process around 2,500 billion USD and is the quarter that confirms that the trend will continue or reverse. With some measurements from technical analysis and correlation with other data, it is possible to make some predictions for Capital in the coming quarter.
The following are the latest Crypto market Capital reviews and predictions, from BeInCrypto.
Indicators that can serve as a measure for Crypto market Capital fluctuations in Q2/2024
The following observation uses two technical indicators to measure market Capital fluctuations over a very large, quarterly time frame. With this time frame, there is not much historical data left to compile Medium, but there is enough to identify a few things worth noting:
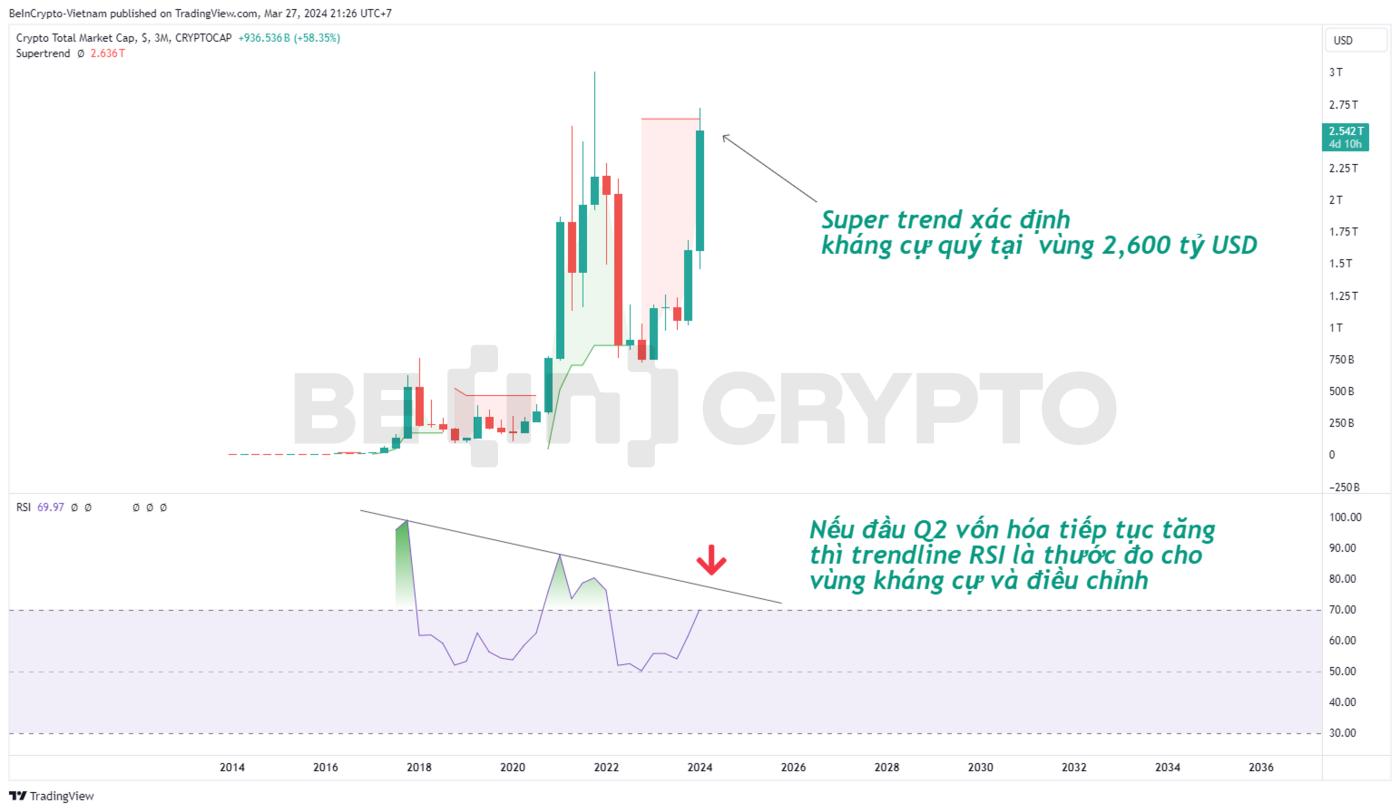 Technical analysis of Crypto market Capital with RSI and Super Trend indicators.
- The quarterly Super Trend indicator shows that Capital is still within the "allowable" recovery range below the 2,600 billion USD area. This resistance is shown through the red indicator signal, indicating that the market Capital has not yet escaped the true downtrend, remaining below the ATH level even though the BTC price has established a new ATH. Thus, with Super Trend, market Capital has entered a high correction zone, predicting Q2 will be a red candle.
- The quarterly RSI indicator helps identify a unique and most notable trendline at this time, in the entire history of market Capital fluctuations, which is the resistance trendline connecting peak periods together. With RSI, Capital has not yet reached an alarming level, that does not mean Capital must necessarily increase to the trendline. But it suggests that, if Q2/2024 Capital does not adjust soon but continues to increase, RSI touching the trendline is a warning time.
It is predicted that in a positive situation, the candle in the second quarter of 2024 will probably be a spinning top or doji candle with a new ATH level and close so that the RSI is still below the trendline. In a negative situation, Capital could adjust from the current $2,600 area.
The correlation between market Capital and volatility of Tether Dominance (USDT.D) is a notable sign
The correlation between USDT.D volatility and market Capital is a signal rarely mentioned by Crypto market analysts in recent times. But past data shows that it can be a good signal to refer to Capital peak areas.
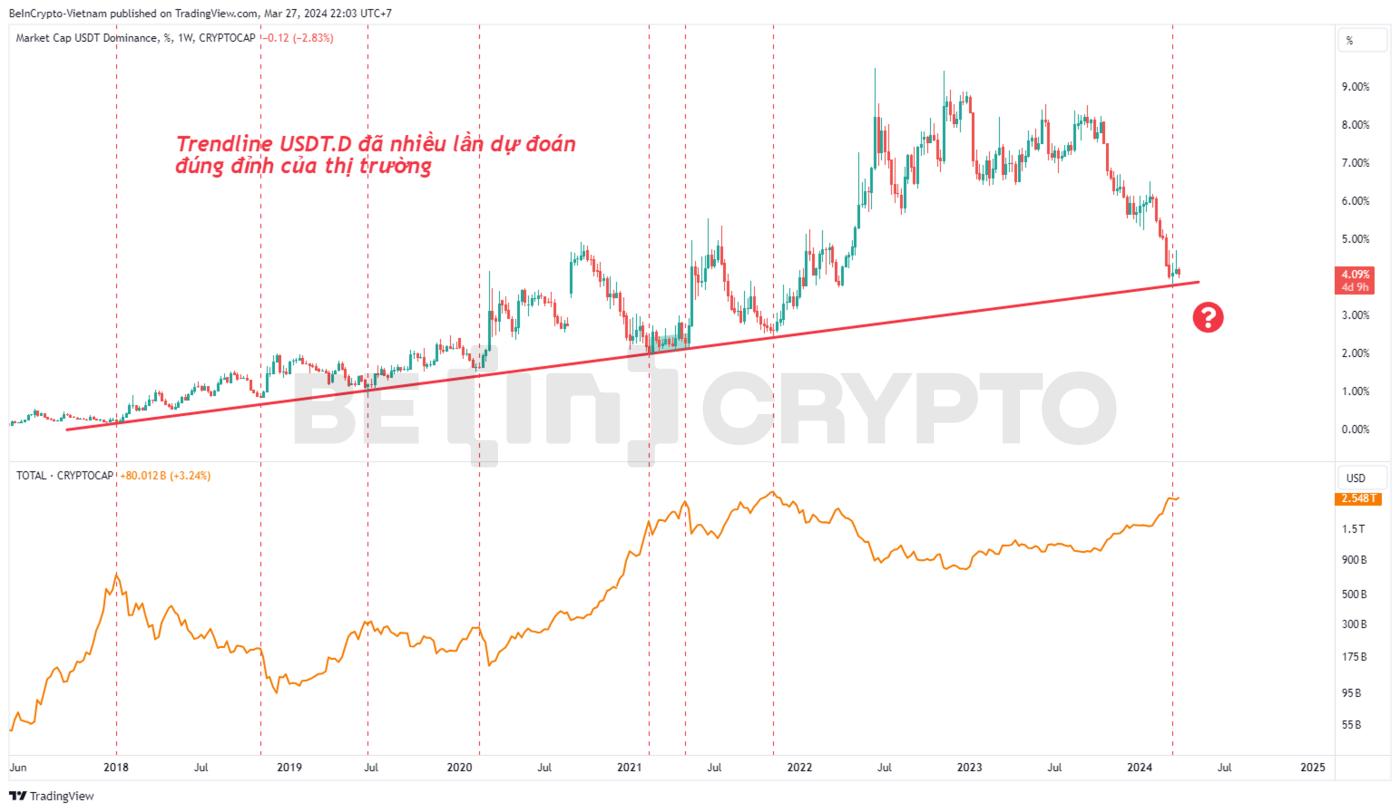 Correlation between USDT.D volatility and market Capital .
USDT.D is the proportion of Tether (USDT) in total market Capital . Tether (USDT) is the leading liquidation stablecoin used by investors to trade Bitcoin and Altcoins. This proportion decreases when Capital increases and vice versa.
- The volatility of USDT.D over the entire history observed under the weekly frame has kept on a fairly stable trendline. When USDT.D falls towards this trendline, it is equivalent to the market Capital entering the peaking zone. In 2021, USDT.D fluctuates along this trendline (marked in green), the market Capital also creates an increasing peak.
- What is interesting is that in the current period, USDT.D has approached the trendline, signaling that Capital has entered the peaking phase. USDT.D still holds the trendline and follows the trendline like in 2021, and the market will witness new ATH levels. Or more positively, USDT.D broke the trendline and fell below 4%, and the market Capital entered the boom phase.
However, whether the positive scenarios will happen or not is still a question mark. Current data shows that Capital is in a dangerous and high-risk area according to USDT.D.
What do you think about the Crypto market Capital analysis mentioned above? Chia your comments now in our community Telegram chat | Telegram channel | Facebook fanpage .


