

This study was done by MigaLabs.
Executive Summary
This report presents an empirical analysis of Ethereum’s blob throughput and network stability following the Fusaka hard fork and subsequent Blob-Parameter-Only (BPO) updates. The study examines blob distribution patterns, missed-slot correlations, and overall network health over a multi-month observation period.
Key findings raise significant concerns:
- Capacity underutilization: The network is not reaching the target blob count (14). The median has actually decreased since BPO1, and high blob counts (16+) remain extremely rare.
- Elevated miss rates at high blob counts: Miss rates at 16+ blobs range from 0.77% to 1.79%, more than double the baseline rates at 0-14 blobs (~0.50%).
- Recommendation: No further BPO updates should be considered until miss rates at high blob counts normalize and there is demonstrated demand for the current capacity.
Timeline of Events
| Event | Date | Description |
|---|---|---|
| Data Collection Start | October 1, 2025 | Baseline measurement period begins |
| Fusaka Hard Fork | December 3, 2025 | Fusaka hard-fork takes place, no blob parameter changes |
| BPO Update #1 | December 9, 2025 | Target blobs increased from 6 to 12, and max from 9 to 15 |
| BPO Update #2 | January 7, 2026 | Target blobs increased from 12 to 14, and max from 15 to 21 |
Analysis
Blob Distribution per Slot
The temporal evolution of blob counts per slot was recorded throughout the observation period, along with the corresponding missed slot data. Figure 1 presents the daily distribution of blobs per slot as a boxplot, with missed slot counts overlaid on the secondary axis (90 days).
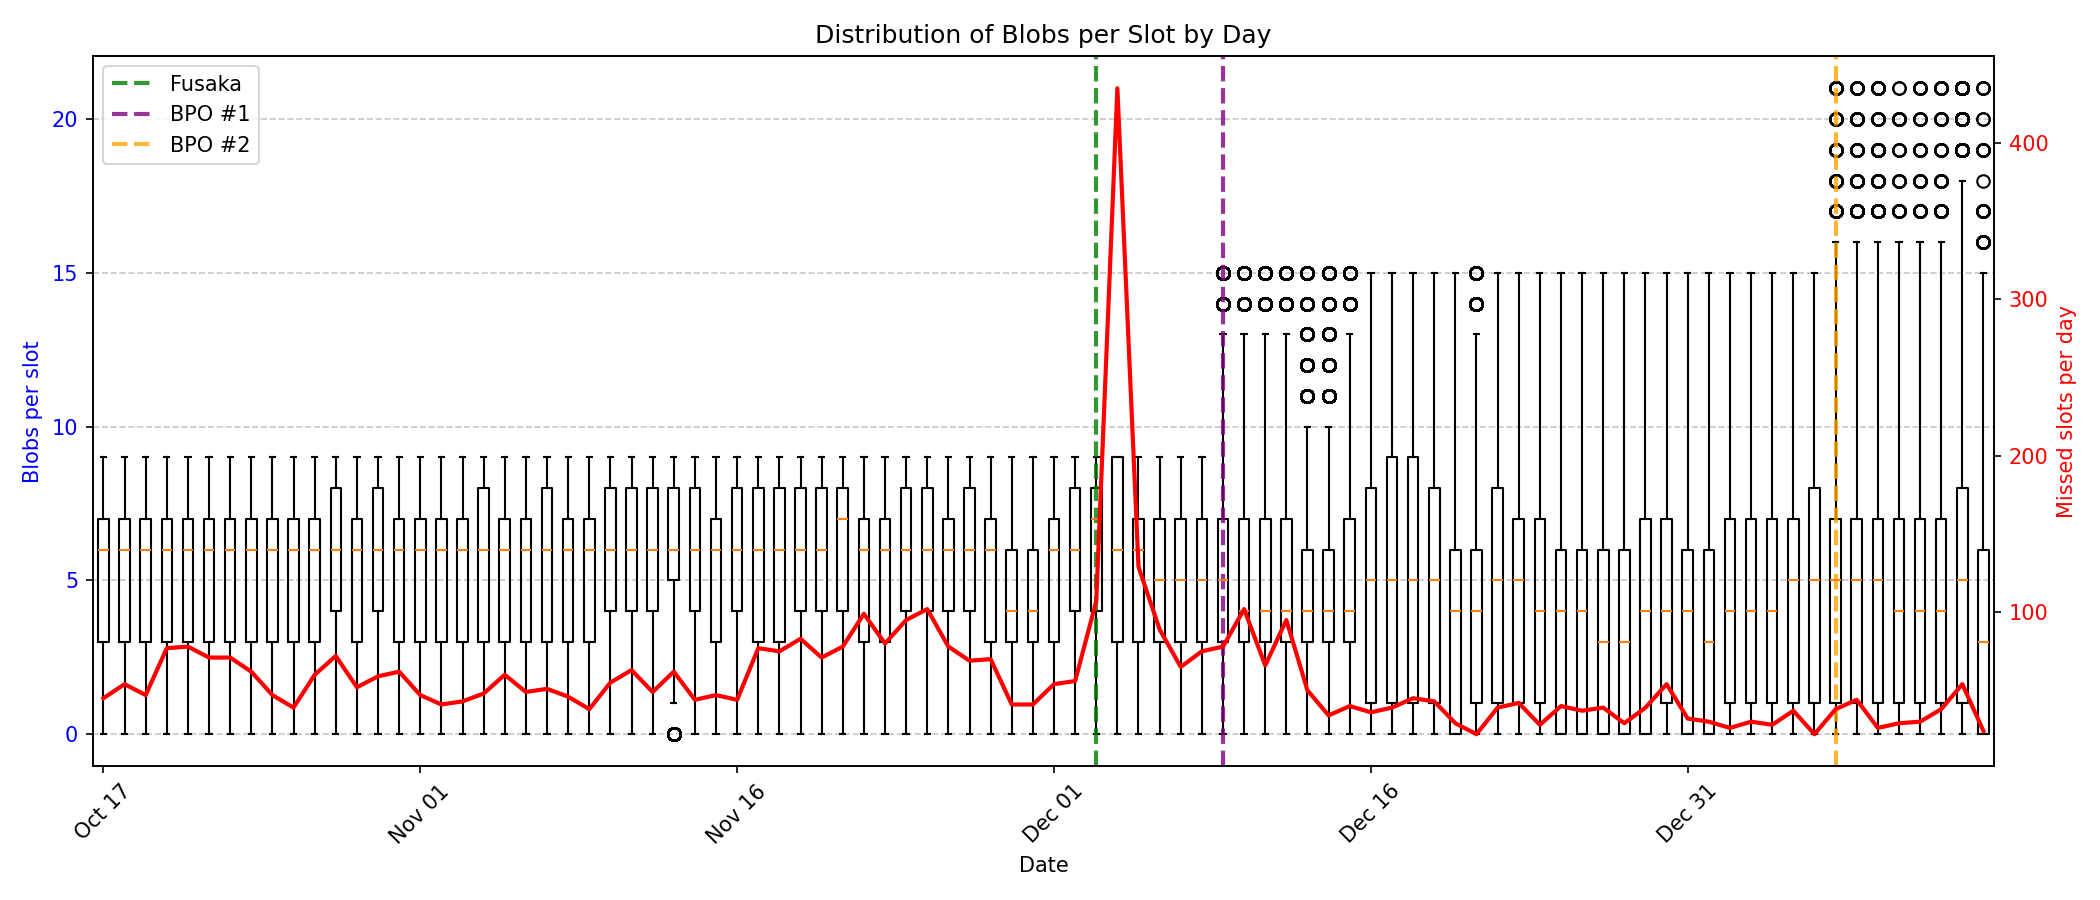
Figure 1: Boxplot showing the daily distribution of blobs per slot (left axis) and the number of missed slots per day (right axis). Vertical dashed lines indicate protocol upgrade events.
The data reveals several noteworthy observations:
Target capacity not being reached: Despite the increased blob limits, the network is not approaching the new target capacities. The median blob count has actually decreased since BPO1, from 6 blobs per slot to 4 blobs per slot. High blob counts (16+) are extremely rare, occurring only 165-259 times each, out of over 750,000 total slots observed.
Capacity expansion without demand: The successive BPO updates have expanded theoretical capacity, but actual utilization has not followed. This raises questions about the necessity of further capacity increases when current limits are far from being reached.
Missed Slot Correlation Analysis
To investigate potential correlations between blob counts and subsequent missed slots, we analyzed the frequency of missed blocks following slots with varying blob counts since the Fusaka hard-fork (40 days). We leave out the first couple of days after Fusaka, as there was an abnormal number of missed slots those two days.
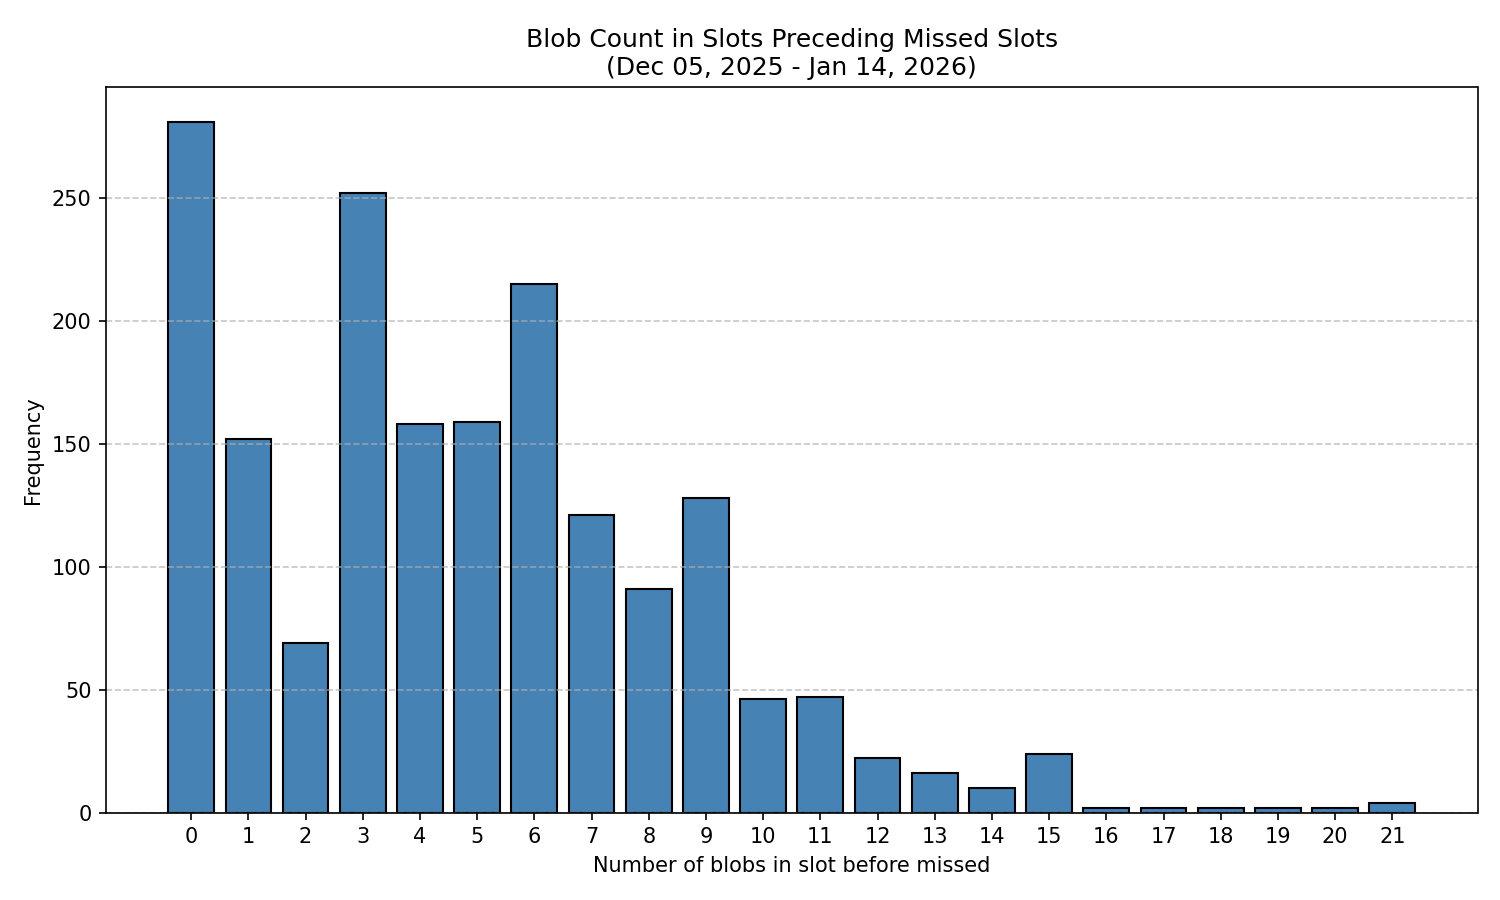
Figure 2: Absolute count of missed blocks categorized by the number of blobs in the preceding slot.
The raw data in Figure 2 suggests a higher incidence of missed blocks following slots with zero or few blobs. However, this observation requires normalization to account for the non-uniform distribution of blob counts across the network.
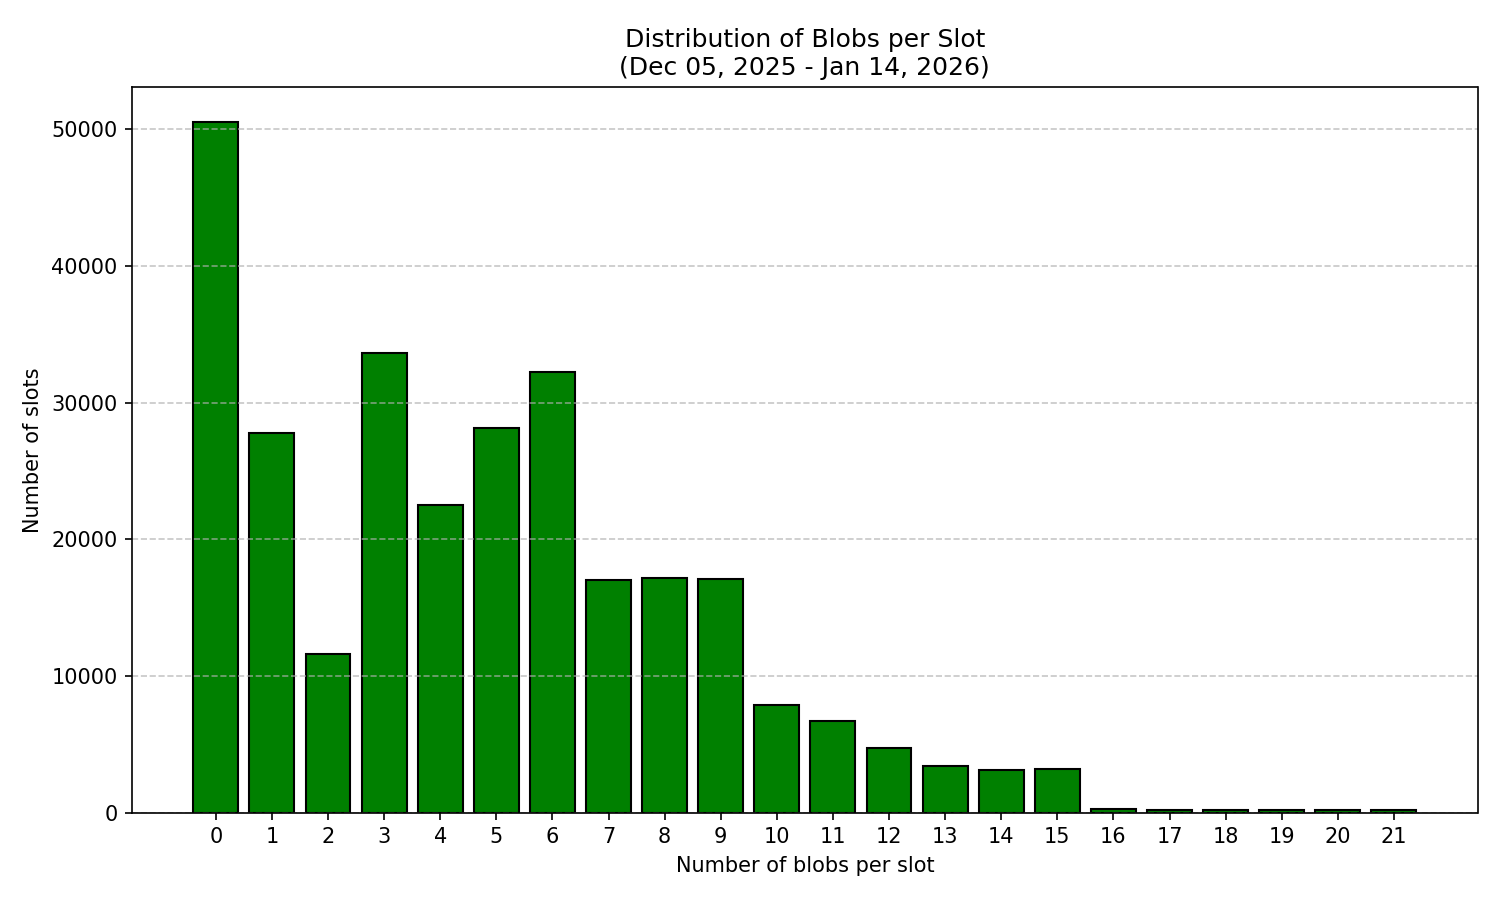
Figure 3: Distribution of blob counts across all observed slots, demonstrating the non-uniform frequency of different blob counts.
To obtain an accurate assessment of miss probability, we computed the normalized miss rate using the following formula:
Missed blocks after slots with X blobsMiss Rate(X) = ——————————————————————————————————————————— × 100Total slots with X blobs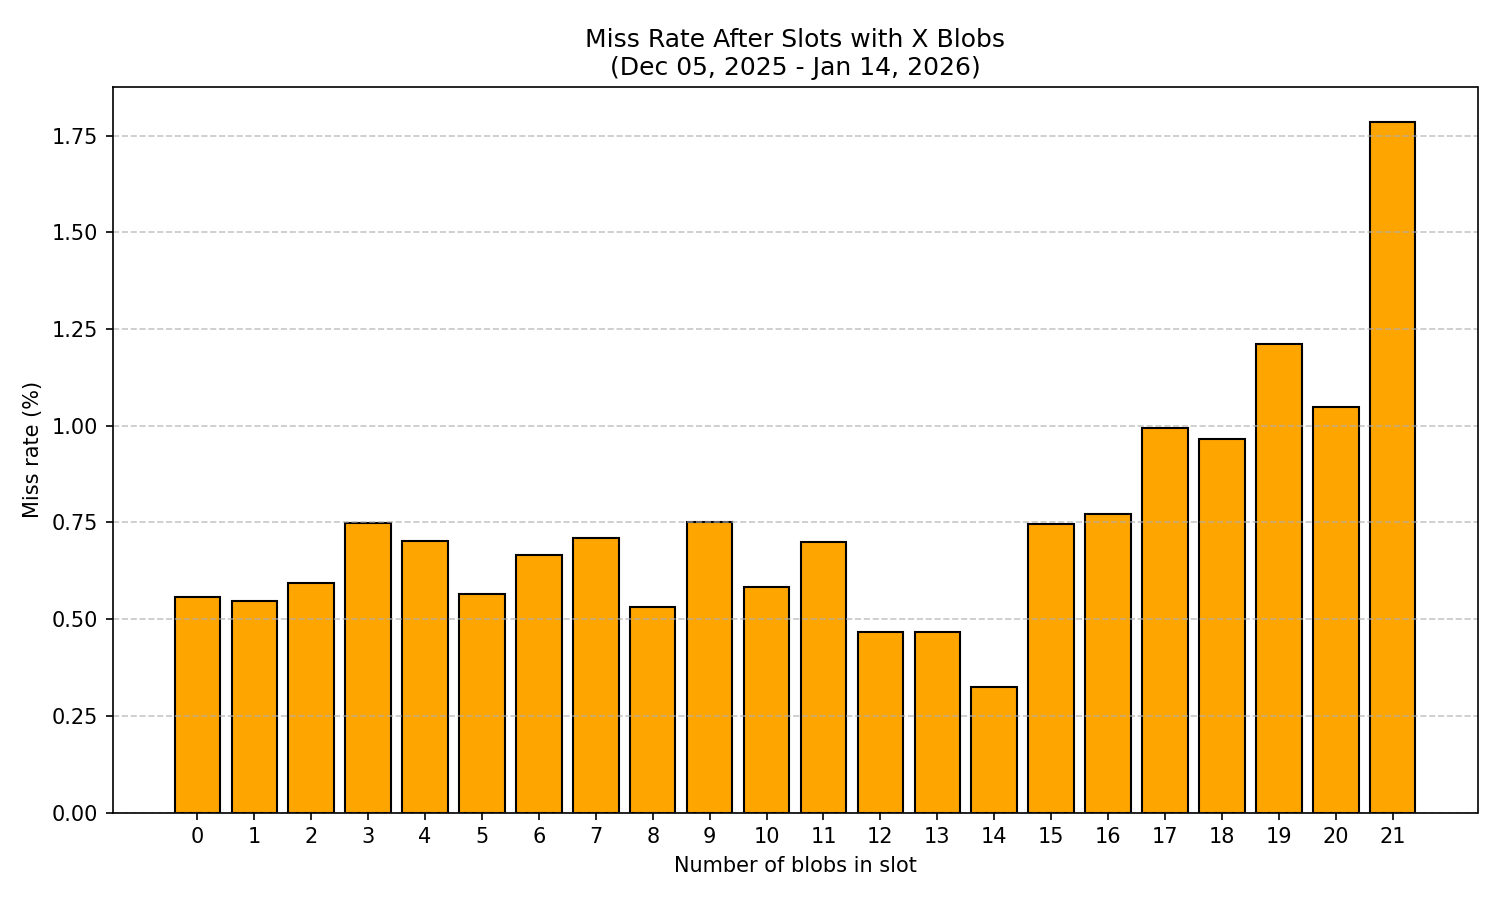
Figure 4: Probability of a missed block following a slot with a given number of blobs.
The normalized analysis reveals alarming patterns:
- Baseline miss rate (0-15 blobs): Ranges from 0.32% to 1.03% across blob counts, with an average around ~0.5%.
- Significantly elevated miss rates at 16+ blobs: Miss rates climb sharply, ranging from 0.77% to 1.79%. At 21 blobs, the miss rate reaches 1.79%—more than three times higher than the average ~0.5% rate observed at lower blob counts. This represents a concerning degradation in network reliability when processing high blob counts.
Consecutive Missed Slots by Blob Count (for 10+ blobs)
| Blob Count | Total Slots | Missed Slots | Miss Rate (%) |
|---|---|---|---|
| 10 | 7880 | 46 | 0.58 |
| 11 | 6723 | 47 | 0.70 |
| 12 | 4717 | 22 | 0.47 |
| 13 | 3431 | 16 | 0.47 |
| 14 | 3088 | 10 | 0.32 |
| 15 | 3213 | 24 | 0.75 |
| 16 | 259 | 2 | 0.77 |
| 17 | 201 | 2 | 1.00 |
| 18 | 207 | 2 | 0.97 |
| 19 | 165 | 2 | 1.21 |
| 20 | 191 | 2 | 1.05 |
| 21 | 224 | 4 | 1.79 |
Statistical Considerations
The dataset for high blob counts (16+) remains limited, with sample sizes ranging from 165 to 259 slots per blob count, compared to tens of thousands for lower counts. However, the consistent pattern of elevated miss rates across all high blob counts (16-21) is concerning. Even with limited samples, the trend is clear: higher blob counts correlate with higher miss rates. If these elevated rates persist or worsen as demand increases, network stability could be seriously compromised.
Conclusions
Capacity not being utilized: The network is not reaching the new target capacities. The median blob count has decreased since BPO1, and high blob counts (16+) remain extremely rare. There is no evidence of demand pressure that would justify further capacity increases.
Alarming miss rates at high blob counts: Slots containing 16+ blobs exhibit miss rates of 0.77-1.79%, representing a significant increase over the 0.32-0.47% baseline observed at 12-14 blobs. This pattern indicates that the network infrastructure is struggling to handle high blob counts reliably.
Risk of network instability: If demand were to increase and high blob counts became more common, the current elevated miss rates could compound and threaten network stability. The data suggests the network is not ready for sustained operation at high blob counts.
No further BPO updates until stabilization: Further increases to blob capacity should not be considered until:
- Miss rates at high blob counts (16+) return to baseline levels (~0.5% or below)
- There is demonstrated demand that actually utilizes the current capacity
Continued monitoring required: The network should be observed operating at current limits before any changes are made. Premature capacity increases the risk of breaking the network if L2 protocols begin utilizing the expanded limits while the underlying infrastructure cannot reliably support them.
Methodology
This study was conducted by MigaLabs using this code.


